1. Introduction
The synthesis and properties of nano-size magnetic materials has been explored in the recent past because of their uniqueness and interesting properties which often show difference from the bulk phase substances due to large surface to volume ratio [1-2]. The nano-sized particles particularly have gained much more attention because of their significant practical applications in bio-processing, colour imaging, storage memory devices, ferro-fluids, magnetic refrigeration, etc. [3-7]. Co 0.5 Ni 0.5 Nb x Fe 2−x O4 (x = 0.0 − 0.10) ferrite nano-particles prepared by hydrothermal have been reported [8]. The spinel phase was confirmed by X-ray diffraction. The crystallite size varies from 18 to 26 nm. The lattice constant increased due to larger ionic radius of Nb+3. It was observed that magnetization, content and remanance decreases as a function of Nb+3 content. In another report [9], Ni 1−x Cu x Fe2O4 ferrites were prepared by double sintering method. The magnetic properties and dielectric constant were found to decrease as a function of Cu ions. Single phase NiCuFe2O4 ferrites prepared by co-precipitation technique at 1000◦C were also reported [10]. It was observed that magnetization shows a non-collinear ferrimagnetic structure for x = 0.5 − 0.9 indicated a magnetic phase change. Ni 1−x Cr x Fe2O4 (x = 0.0−1.0) prepared by sol-gel auto combustion technique in single phase form for x > 0.2 are reported [11]. Scanning electron microscopy (SEM), results of the samples revealed the formation of nano-particles. Mössbauer spectra exhibited two normal Zeeman split sextets that showed ferromagnetic behavior. It was also observed that iron was in Fe+3 state and magnetic hyperfine field at tetrahedral sites decrease as Cr+3 is substituted. The magnetization was observed to decrease up to 4.465 emu/g with the doping of Cr+3. It has been reported [12-14] that copper ferrites can be distinguished from other ferrites due to tetragonal distortion of ferrite structure displayed by them as well as on the basis of inability to have cation/oxygen ratio greater than 3/4.
At room temperature, according to thermodynamic equilibrium copper ferrites are characterized by inverse structure with cation distribution Fe3+ [Fe3+ Cu2+] O42−. Due to the Jahn-Teller effect obtained from cupric ions placed at octahedral sites, the spinel structure greatly distorted through Axial ration (c/a), ratio having a value of 1.06 [12,14-18]. It has been observed that the coercive field of nano particles of copper ferrites immensely depends on the distortion of spinel ferrites, i.e., the greater the distortion, the greater the coercivity. [16].
It is reported [19] that CuFe2O4 is a partially inverse ferrite and it is observed that magnetization increases as Cu content increased. The Ni-ferrites are used in transformers, inductors, magnetic heads and at microwave frequencies in Ku-band whereas Cu-ferrite is also used as photocatalysts, in Li-based batteries as a catalyst, gas sensors, etc. To enhance the electrical and magnetic properties, Cr3+ is supposed to be good candidate. Cr3+ belong to group 6, period 4 with variable oxidation states, Cr3+ and Cr5+. The ionic radius of Cu2+ is 0.63 Å comparable to Fe3+0.67 Å. The substitution of Cr3+ may change the resistivity due to variable oxidation state and magnetic properties will also change due to magnetic moment (3 µB). The resistivity of CuCr 2−x Fe x O4 is reported 105-108 (Ωcm), M s = 34.52 − 18.92 (emu/g) and H c = 61 − 146 (Oe) for Mg 1−x Cu x Fe 2−x O4 [17].
The aims and objectives of the present work is to enhance the magnetic and electrical properties for possible applications at high frequencies and in photo-catalytic activity.
2. Experimental technique
The (Cu 0.7 Ni 0.3 )Cr x Fe 2−x O4 ferrites were prepared by Solgel method. This method involves the formation of sol which dispersed the particles of solid in a liquid. The sol is formed by the mixture of concentrated solutions containing the desired cations, having an organic solvent used as the dispersion medium. It is also feasible to start with a suspended colloidal in place of solutions.
In sol-gel method analytical grade reagents; Fe(NO3)3.9H2O (98% Duejung), Ni(NO3).6H2O (98% UniChem), Cu(NO3)2 (98% PubChem), Cr(NO3)3 (99% Sigma Aldrich) were used. The stoichiometric amounts of each salt was added in 100 ml deionized and stirred on a stirrer for half an hour. Each stock solution was put in 1000 ml beaker which put on a hot plate stirrer to obtain a homogeneous solution for few hours at 80◦C. The water evaporated after 6 hrs and gel formation occurs. During stirring and heating the solution, ammonia solution was added to maintain the pH in the range of 7 to 8. During this process, the variation in colour of the solution occurred and converted to gel and finally into ash at about 250◦C. The dried ash was ground in morter and pestle to obtain fine powder. This powder was then transformed into pallets by utilizing Paul-Otto Weber hydraulic press subjected to 30 kN pressure. The pallets were sintered at 900◦C in a tube furnace for 6 hrs. For the characterization purpose the Burker X-ray diffractometer was used for X-ray diffraction where as MH loops were plotted on a LakeShore 7400 vibrating sample magnetometer. The dielectric measurements were carried out on LCR meter GW INSTEK 8101. The two probe method was used to measure electrical resistivity using Keithly source meter model 2400.
3. Results and discussions
3.1. X-ray diffraction analysis
XRD patterns for (Ni 0.3 Cu 0.7 )Cr x Fe 2−x O4 ferrites having compositions 0.0, 0.1, 0.2, 0.3, 0.4 are shown in the Fig. 1. The patterns of X-ray diffraction confirmed single phase fcc structure without any impurity peaks [23]. The d-values were compared with JCPDS Card No. 25-0283 [25] for checking the phase purity of the samples. The reflections observed in XRD patterns are (220), (311), (222), (400), (333), (440), which belong to a fcc spinel structure having space group Fd3m [26]. The lattice constant of all samples was calculated by using the equation given below,
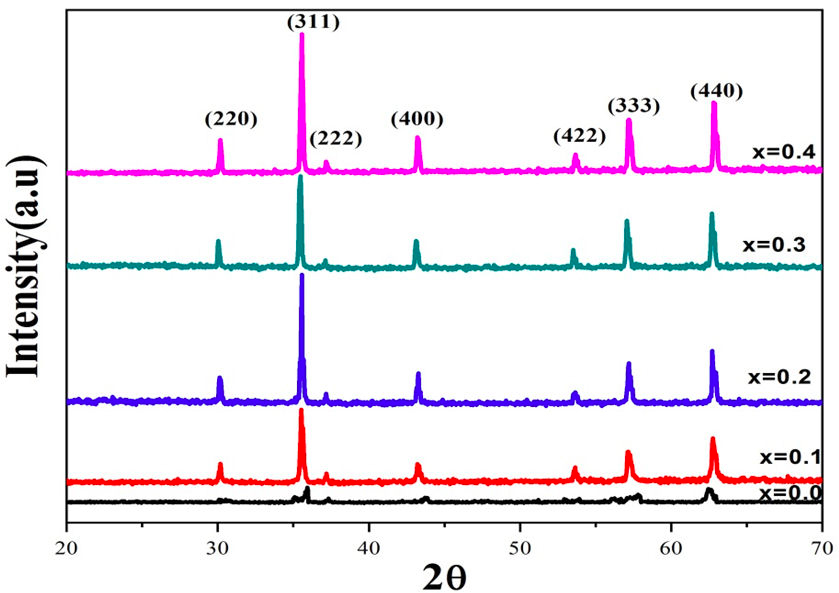
FIGURE 1 XRD profiles of Cr+3 substituted copper base (Cu 0.7 Ni 0.3 ) Cr x Fe 2−x O4 (x = 0.0, 0.1, 0.2, 0.3, 0.4) ferrites.
It is clear that the lattice constant “a” decreases with increasing concentration of chromium ions as listed in Table I. The lattice constant decreases due to difference in ionic radii of Fe3+ and Cr3+. Iron ions (Fe3+) having greater ionic radii 0.67 Å were replaced by chromium (Cr3+) ions having comparatively smaller ionic radii 0.64 Å [27]. The X-ray density of each sample was measured by utilizing the relation given below,
TABLE I Lattice constant (Å), Crystallite size D (nm), X-ray density dx (g/cm3) and Conduction mechanism (S value ) of (Ni0.3Cu0.7) Crx Fe2−x O4 ferrites (x = 0.0, 0.1, 0.2, 0.3, 0.4).
| Parameters | X= 0.0 | X = 0.1 | X = 0.2 | X = 0.3 | X = 0.4 |
| Crystallite Size | 53.09 | 53.05 | 53.01 | 42.41 | 35.36 |
| X-ray density | 5.38 | 5.36 | 8.37 | 5.39 | 5.52 |
| S-values | 0.375 | 0.77 | 0.97 | 1.20 | 2.33 |
Here 8 indicates formula unist, M is the molecular weight, N indicates Avogadro’s number while “a” represents the lattice constant. It is observed that X-ray density increases with increasing concentration of Cr3+ ions. The increase in density is attributed to molecular weight of the specimen. Also, the X-ray density has an inverse relationship with the lattice constant [28] as can be seen from Table I.
Crystallite size D XRD of all samples was calculated from the highest peak (311) of X-ray diffraction patterns by using the Debye-Scherrer equation,
Here β 1/2 represents the full width at half maximum of intensity in degrees, θ is the Bragg angle and K is the shape factor. Crystallite size decreases with increasing concentration of chromium ions. Table I shows the decreasing trend of crystallite size is attributed to the addition of chromium ions which creates hindrance in the growth grain [26].
3.2. Magnetic properties
Figure 2 shows the graphs of MH-loops for (Ni 0.3 Cu 0.7 )CrxFe 2−x O4 samples. Figure 3 shows saturation magnetization and coercivity vs Cr contents. It is observed that saturation magnetization decreases with increasing concentration of Cr3+ ions. The decrease in magnetization is based on the strength of A-B interactions. In the present work, the high value of magnetic moment Fe3+ ions (5 µB) are replaced by low magnetic moment Cr3+ ions (3 µB) [29]. Magnetic moments in spinel ferrite are primarily because of the un-compensated electron’s spin of the ions and the alignments of spins in the two sublattices which are ordered in an antiparallel manner. According to Neél’s molecular field theory, there exist A-B super exchange interactions that are dominant over A-A and B-B interactions. Hence, the total magnetic moment is obtained by taking the sum of the magnetic moments of the A sub-lattice (MA) and B sub-lattice (MB). Since Cr3+ ions prefer to occupy B-sites in the spinel lattice with magnetic moment equals to 3 µB and replace Fe3+ ions with magnetic moment equals to 5 µB thereby diluting the magnetization of B sublattice (MB). The total magnetization decreases because it is the algebraic sum of MA and MB., i.e.,
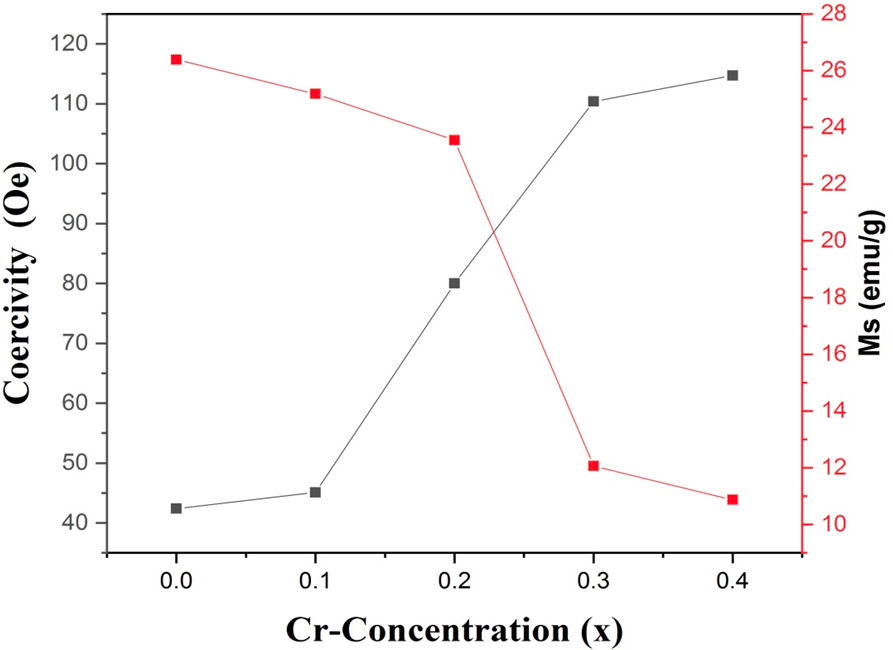
FIGURE 3 Saturation magnetization, Coercivity versus Cr3+ concentration for (Ni 0.3 Cu 0.7 )Cr x Fe 2−x O4 (x = 0.0, 0.1, 0.2, 0.3, 0.4) ferrites.
Hence the net saturation magnetization, M decreases. It can be seen from Fig. 3 that the coercive field H c increases as the concentration of Cr3+ ions increases. The saturation magnetization M s is related to coercive field H c by Brown’s relation [30];
Here K 1 represents the anisotropy constant and µ 0 represents the permeability constant. From above relation, it is noticed that H c is inversely proportional to M s , which is in agreement with our experimental results.
3.3. Electrical properties
3.3.1. Room temperature resistivity
Room temperature resistivity, shown in Fig. 4, increases as a function of Cr-content. It is noted that chromium possesses variable valance state, e.g., Cr3+ and Cr5+ ions. The chance for Cr5+ ions production is maximum during sintering. do not take part in conduction rather act as scattering centers [35] and thereby hinders the hopping mechanism and resistivity increases as a function of Cr-content.
3.3.2. Temperature dependent resistivity
Figure 6 shows the temperature dependent resistivity for each sample. Observations show a linearly decreasing trend of dc resistivity with increasing temperature, indicating the semiconducting behaviour of the material [31]. The relationship between resistivity and temperature is quantified by the Arrhenius equation [32],
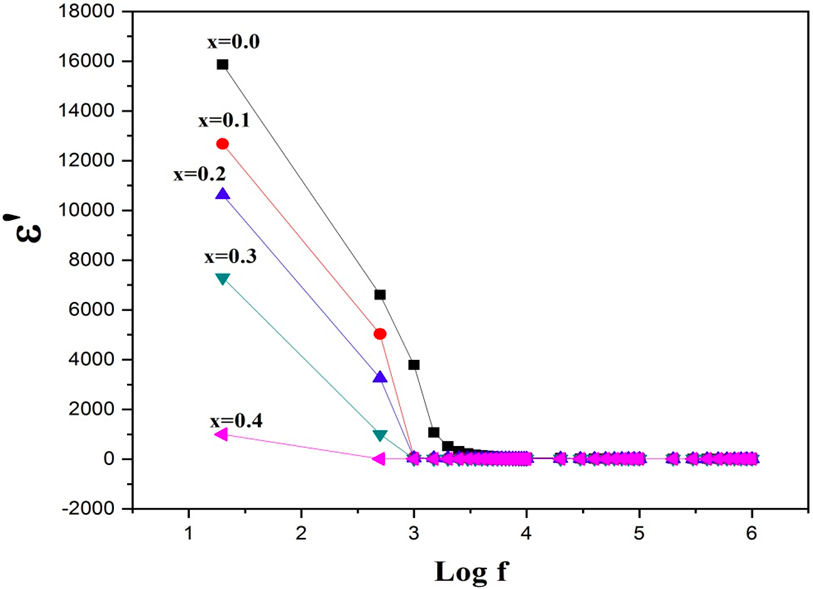
FIGURE 6 Real part of dielectric constant vs logf for (Ni 0.3 Cu 0.7 )Cr x Fe 2−x O4 (x = 0.0, 0.1, 0.2, 0.3, 0.4) ferrites.
Here ρ 0 is constant (resistivity at T = 0 K), E a represents the activation energy and k b represents the Boltzmann’s constant. The increase in room resistivity can be explained on the basis of the hopping mechanism, i.e., Fe2+ ↔ Fe3+. As the Cr3+ ions do not take part in the conduction phenomena, they hinder the amount of Fe2+ ↔ Fe3+ transfer, therefore preventing electron hopping and consequently resistivity increases [27]. The increase in resistivity with the increase in Cr3+ content is consistent with the results reported in Ref. 24. Figure 4 shows the activation energy vs chromium ions concentration. The activation energies were obtained from the slope of Arrhenius plots as shown in Fig. 5. It is observed that activation energy increases as a function of chromium content. It is also noted that resistivity increases with increasing content of chromium ions. Hence, the samples with high value of resistivity have high activation energy and vice versa [32-33].
3.4. Dielectric properties
Figure 6 shows the variation of dielectric constant vs frequency in the range 20 Hz - 1 MHz at room temperature. It can be observed that as frequency increases, dielectric constant decreases exponentially. The decreasing trend in dielectric constant is quite sharp in the region of low frequencies; with further increase in frequency, it remains constant for all compositions under consideration. Change in dielectric constant vs frequency excite dispersion because of MaxwellWagner type interfacial polarization and is in good agreement with Koop’s phenomenological theory [28]. With further increase in frequency, the polarization decreases as well as it acquires a constant value on the far side of frequency limit. The decreasing trend in dielectric constant with increasing values of frequency shows that the process of polarization in spinel ferrite is analogous to that of the conducting phenomena. By exchanging electrons, Fe2+ ↔Fe3++ e−, one can find the local displacement of electron in the orientation of applied electric field. This displacement explains the polarization phenomena for spinel ferrite. The n-type charge movement in the currently studied spinel ferrites is because of the hopping of electrons through Fe2+ ↔ Fe3+ + e−, where the p−type charge movement subsists in nickel ions accordant with Ni2+ + h ↔ Ni3+. Figure 7 shows the complex dielectric constant vs frequency, the loss is high at low frequencies and low at higher frequencies. The loss at low frequencies is attributed to defects and grain boundaries and at high frequencies the loss is referred to the conducting grains. Figure 8 shows tanδ vs frequency which is dissipation of energy due to phase difference between current and voltage.
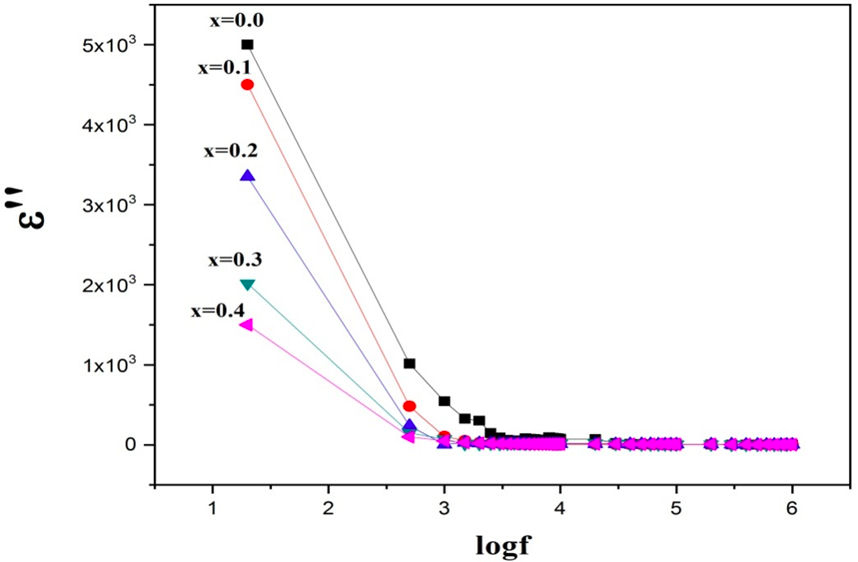
FIGURE 7 Imaginary part of dielectric constant vs logf for (Ni 0.3 Cu 0.7 )Cr x Fe 2−x O4 (x = 0.0, 0.1, 0.2, 0.3, 0.4) ferrites.
In Fig. 9 it is shown that electrical conductivity increases with increasing frequency. In region of lower frequencies, there is no change in conductivity and it is almost independent of frequency. The change in conductivity at higher values of frequencies is significant. The conduction mechanism in dielectric substances is mainly due to hopping of charge carriers. In the region of low frequencies, grains boundary show high resistivity due to which conductivity is low and σ ac ≈ σ dc . In contrast, for the region of higher frequencies, the mobility of charge carriers (i.e., electrons and holes) increases due to which grains become conductive in nature and follow Jonscher’s Power Law [36] (which explains that conductivity is directly proportional to ω s .
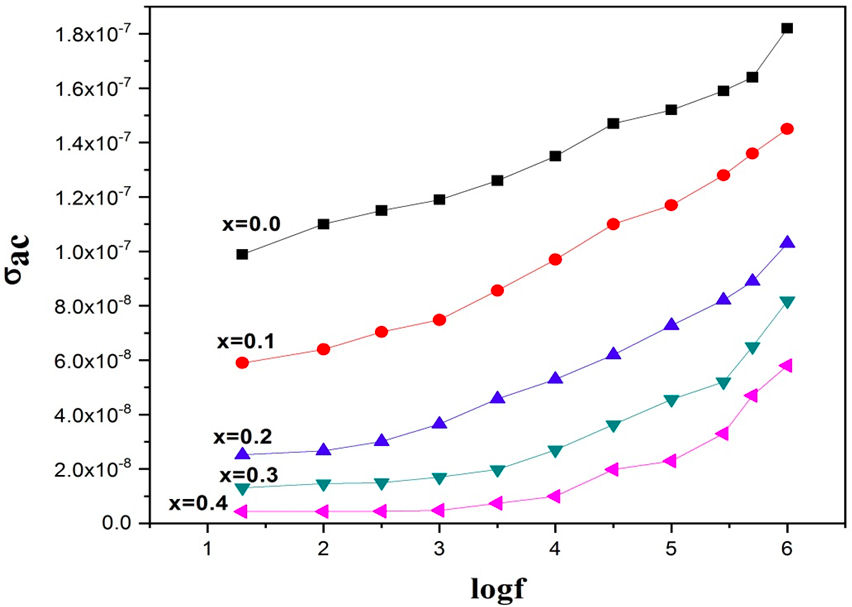
FIGURE 9 Ac conductivity vs logf for (Ni 0.3 Cu 0.7 )Cr x Fe 2−x O4 (x = 0.0, 0.1, 0.2, 0.3, 0.4) ferrites.
Here σ dc , A and S are temperature dependent quantities. The value of S is calculated from the slope of linear portion of ln σ vs ln ω from Fig. 10. It was observed that translational hopping occur for S < 1; whereas localized hopping occurs for S > 1. Because of spinel structure, exchanges of charge carriers (i.e. electrons and holes) occur only between ions in octahedral sites. There is a relationship between conduction mechanism and dielectric behavior, i.e., the region of low frequencies correspond to high resistivity and greater dielectric loss which needs more energy for hopping up to x = 0.2 of charge carriers and the region of high frequencies correspond to low resistivity and low dielectric loss [34-35]. The value of S > 1 at x > 0.2 which indicates that small polaron hopping is the likely mechanism.
4. Conclusions
Single phase Cr doped Cu base spinel ferrites were successfully prepared by sol-gel method. Lattice constant and crystallite size decreased from 8.37Å to 8.28Å and 53.09 nm to 36.35 nm, respectively. Room temperature resistivity increases from 2.3 × 10⁸ to 2.8 × 10⁹ Ω-cm and activation energy increases 0.43 to 0.74 eV. Dielectric constant, dielectric loss, dissipation factor decreased exponentially following Maxwell, Wagner model. Ac conductivity increased and followed Jonscher’s power law with exponent values that vary from 0.375 to 2.33 indicating the hopping conduction up to x = 0.2 followed by small polaron hopping at x > 20. Saturation magnetization decreased due to the smaller magnetic moment of Cr3+ compared to Fe3+ thereby weakening the AB-interactions. Due to the high value of resistivity, dielectric constant, and coercivity of these materials, they may be suitable for microwave devices applications.


 nueva página del texto (beta)


