SciELO - Scientific Electronic Library Online

 
vol.43 número2Efectos de la variabilidad interanual de la estratificación de la columna de agua sobre la producción y biomasa del fitoplancton en la zona norte frente a Baja California índice de autoresíndice de materiabúsqueda de artículos
Home Pagelista alfabética de revistas  

Servicios Personalizados

Revista

Articulo

Indicadores

Links relacionados

  • No hay artículos similaresSimilares en SciELO

Compartir


Ciencias marinas

versión impresa ISSN 0185-3880

Cienc. mar vol.43 no.2 Ensenada jun. 2017  Epub 11-Jun-2021

https://doi.org/10.7773/cm.v43i2.2752 

Articles

Response of primary producers to the hydrographic variability in the southern region of the California Current System

Respuesta de los productores primarios a la variabilidad hidrográfica en la región sur de la corriente de California

Jushiro Cepeda-Morales1 

Reginaldo Durazo2 

Eduardo Millán-Núñez3 

Martín De la Cruz-Orozco3 

Ramón Sosa-Ávalos4 

T Leticia Espinosa-Carreón5 

Luis Soto-Mardones6 

Gilberto Gaxiola-Castro3 

1 Laboratorio de Percepción Remota Satelital de Ecosistemas costeros y Oceánicos, CENIT2, Universidad Autónoma de Nayarit, Ciudad de la Cultura “Amado Nervo”, Tepic, CP 63155, Nayarit, México.

2 Facultad de Ciencias Marinas, Universidad Autónoma de Baja California, Carretera Ensenada-Tijuana, no. 3917, Zona Playitas, CP 22860, Ensenada, Baja California, México.

3 Centro de Investigación Científica y de Educación Superior de Ensenada. Carretera Ensenada-Tijuana, no. 3918, Zona Playitas, CP 22860, Ensenada, Baja California, México.

4 Centro Universitario de Investigaciones Oceanológicas, Universidad de Colima, Carretera Manzanillo-Barra de Navidad, km 20, CP 28860, Manzanillo, México.

5 Centro Interdisciplinario de Investigación para el Desarrollo Integral Regional, Instituto Politécnico Nacional, Unidad Sinaloa, Blvd. Juan de Dios Bátiz Paredes, no. 250, San Joachín, CP 81101, Guasave, Sinaloa, México.

6 Facultad de Ciencias, Universidad del Bío-Bío, Av. Collao 1202, Casilla 5-C. CP 4081112, Concepción, Chile. * Corresponding author. E-mail: jushiro.cepeda@uan.edu.mx


Abstract

The response of primary producers to seasonal and interannual variabilities in the hydrographic conditions observed between 1997 and 2012 is analyzed for the southern portion of the California Current System (CCS). The analysis uses the optimum rate of primary productivity (PP) normalized by units of chlorophyll (Chla) in the water column ( PoptB ) and Chla concentration. In situ PP estimations using the 14C method were obtained as part of the seasonal cruises conducted by the Investigaciones Mexicanas de la Corriente de California program. Supplementary data included sea surface temperature (SST) as measured by the AVHRR sensor from 1985-2009. We found the mean value of PoptB to be at 5.1 ± 3.3 mg C (mg Chla)-1 h-1, with maximum ranges of 0.5 and 17.5 mg C (mg Chla)-1 h-1. The relationship between PoptB and SST suggested a phytoplankton community change at around 19 ºC, which characterized the transitional nature of the southern portion of the CCS. SST data suggested, on the one hand, that on average the 19 ºC isotherm is located in the vicinity of Punta Eugenia and, on the other, that its spatial variability defined the alternating cool-warm conditions. At the seasonal scale, this isotherm showed a marked latitudinal displacement (from 24ºN to 32ºN), which was observed to be even out of this range during interannual events associated with El Niño/La Niña. Under both cool-warm hydrographic conditions, the phytoplanktonic community showed large PoptBrates (~6 mg C (mg Chla)-1 h-1). At the interannual scale, PoptB changes were associated to changes in the abundance and composition of nano-microphytoplankton. Additionally, data suggested that high PP rates during warm periods could be attributed to an enhanced picoplankton contribution.

Key words: primary production; chlorophyll; phytoplankton community; seasonal variability; California Current

Resumen

Se analizó la respuesta de los productores primarios a la variabilidad estacional e interanual de las condiciones hidrográficas en la región sur del Sistema de la Corriente de California (SCC) entre 1997 y 2012. El análisis se basa en la tasa óptima de productividad primaria (PP) normalizada por unidad de clorofila (Chla) en la columna de agua ( PoptB) y en la concentración de Chla. Como parte del monitoreo que realiza el programa de Investigaciones Mexicanas de la Corriente de California, se obtuvieron para cada estación del año datos de PP in situ con la técnica de 14C. La información se complementó con datos de la temperatura superficial del mar (TSM) medida por el sensor AVHRR de 1985 a 2009. El análisis de los datos de TSM demostró que, en el promedio de largo periodo, la isoterma de 19 ºC se ubicó en las inmediaciones de punta Eugenia y que su variabilidad espacial permite seguir la alternancia del cambio entre las condiciones frías y cálidas. En la escala estacional, esta isoterma presentó un marcado desplazamiento latitudinal (de 24ºN a 32ºN), y se extiendió aún más durante eventos interanuales asociados a El Niño/La Niña. El valor promedio del PoptB fue de 5.1 ± 3.3 mg C (mg Chla)-1 h-1 y varió de 0.5 a 17.5 mg C (mg Chla)-1 h-1. La relación entre el PoptB y la TSM sugiere un cambio en la comunidad del fitoplancton a los 19 ºC, lo que se consideró como una respuesta al carácter transicional del SCC. La comunidad fitoplanctónica mantuvo altas tasas promedio de PoptB (~6 mg C (mg Chla)-1 h-1) en ambas condiciones hidrográficas (frío/cálido). Las variaciones en la escala estacional e interanual del PoptB estuvieron asociados a cambios en la composición y abundancia del nano-microfitoplancton. Los datos sugieren que las altas tasas PP en periodos cálidos pueden atribuirse a la contribución del picoplancton.

Palabras clave: productividad primaria; clorofila; comunidad del fitoplancton; variaciones estacionales; corriente de California

Introduction

The California Current System (CCS) is one of the most productive ecosystems in the world (Carr 2006). The southern portion of the CCS off the coast of Baja California (Mexico) is a transition zone with a clear seasonal signal. During winter and spring it is mainly influenced by subarctic waters, and during summer and autumn it is influenced by waters from the tropical Pacific off the coast of Mexico (Durazo and Baumgartner 2002, Durazo 2015). Off Baja California, the CCS is characterized by upwelling favorable conditions (Linacre et al. 2010), the formation of mesoscale eddies (Espinosa-Carreón et al. 2012), and the influence of interannual (El Niño and La Niña) and decadal events. Altogether, these factors control primary productivity (PP) and thus productivity in the pelagic ecosystem (Espinosa-Carreón et al. 2004).

Since 1997, the Investigaciones Mexicanas de la Corriente de California program (Mexican Research Program of the California Current; IMECOCAL, for its acronym in Spanish) has conducted in situ measurements of phytoplankton PP. These measurements have allowed us to identify temporal variations in PP at seasonal and interannual scales (Gaxiola-Castro et al. 2010), as well as significant differences in variations of integrated PP between summer and autumn (Aguirre- Hernández et al. 2004). Moreover, evidence indicates that the decrease in biomass and PP in the region is a consequence of interannual variations, such as the one associated with the anomalous intrusion of subarctic water (Espinosa-Carreón et al. 2015).

The response of primary producers to changes in oceanographic conditions, in terms of biomass, which is estimated using the concentration of chlorophyll (Chla), off the coast of Baja California has been documented based on both measurement data (Gaxiola-Castro et al. 2008, 2010) and remote sensing data (Espinosa-Carreón et al. 2004). On a seasonal scale, the southern portion of the CCS typically shows high Chla concentrations during spring due to the intensification of coastal upwelling, but these concentrations decrease during summer due to the combined effect of the weakening of upwelling favorable winds and the increase in water stratification. At the interannual scale, Chla concentrations show negative anomalies during warm periods associated with the sinking of the pycnocline, and during cold periods, when the pycnocline rises, phytoplankton biomass generally shows positive anomalies (Gaxiola-Castro et al. 2010).

One way to measure oceanic productivity is by using the optimal rate of carbon fixation normalized per unit of Chla ( PoptB ). PoptB is a photosynthetic parameter that responds to light and nutrient conditions in the euphotic zone (Behrenfeld and Falkowsky 1997), and it can therefore provide information on the characteristics of the phytoplankton community under different environmental conditions. The strength of this parameter lies on the fact that each phytoplankton group reaches a PoptB value at a specific temperature due to its enzymatic response (Eppley 1972). At a global level, the ratio between the PoptB parameter and sea surface temperature (SST) is closely related to large ecosystems (Behrenfeld and Falkowsky 1997). However, at a regional level, its application as an indicator of the response of the phytoplankton community to changes in environmental conditions has not been thoroughly explored. In order to understand the response of a pelagic ecosystem to changes in oceanographic conditions, the relation between the PoptB parameter and SST was analyzed. Our objective is to study the response of primary producers to the hydrographic variations in the transition zone located off the coast of the Baja California peninsula at seasonal and interannual scales .

Materials and methods

Data analyzed in the present study were collected during 47 oceanographic campaigns. These campaigns were carried out between 1997 and 2012 in the southern region of the CCS, off the Baja California Peninsula. In each oceanographic campaign, in situ experiments were carried out in order to determine PP in the euphotic zone (Fig. 1). The 14C fixation rate was measured with the light-dark bottle method through experiments that were carried out at around noon (local time) . Water samples were taken at optical depths corresponding to 100%, 50%, 30%, 20%, 10%, and 1% of surface irradiance. Physical depths were calculated by using the Beer law: Z = ln(Eo/Ez)/K d, where Z is depth, Eo is surfce irradiance, Ez is irradiance at depth Z, and K d is the mean diffuse attenuation coefficient, which was estimated by using depth measurements from the Secchi disc (Z d) and applying the ratio for oceanic waters K d =1.7/ Z d. Water samples were collected with 5-L Niskin bottles mounted on a General Oceanics rosette. To minimize sample contamination, silicone gaskets and elastics were used for the bottles. Conductivity, temperature, and pressure were measured with a factory calibrated CTD SeaBird 911plus at each station.
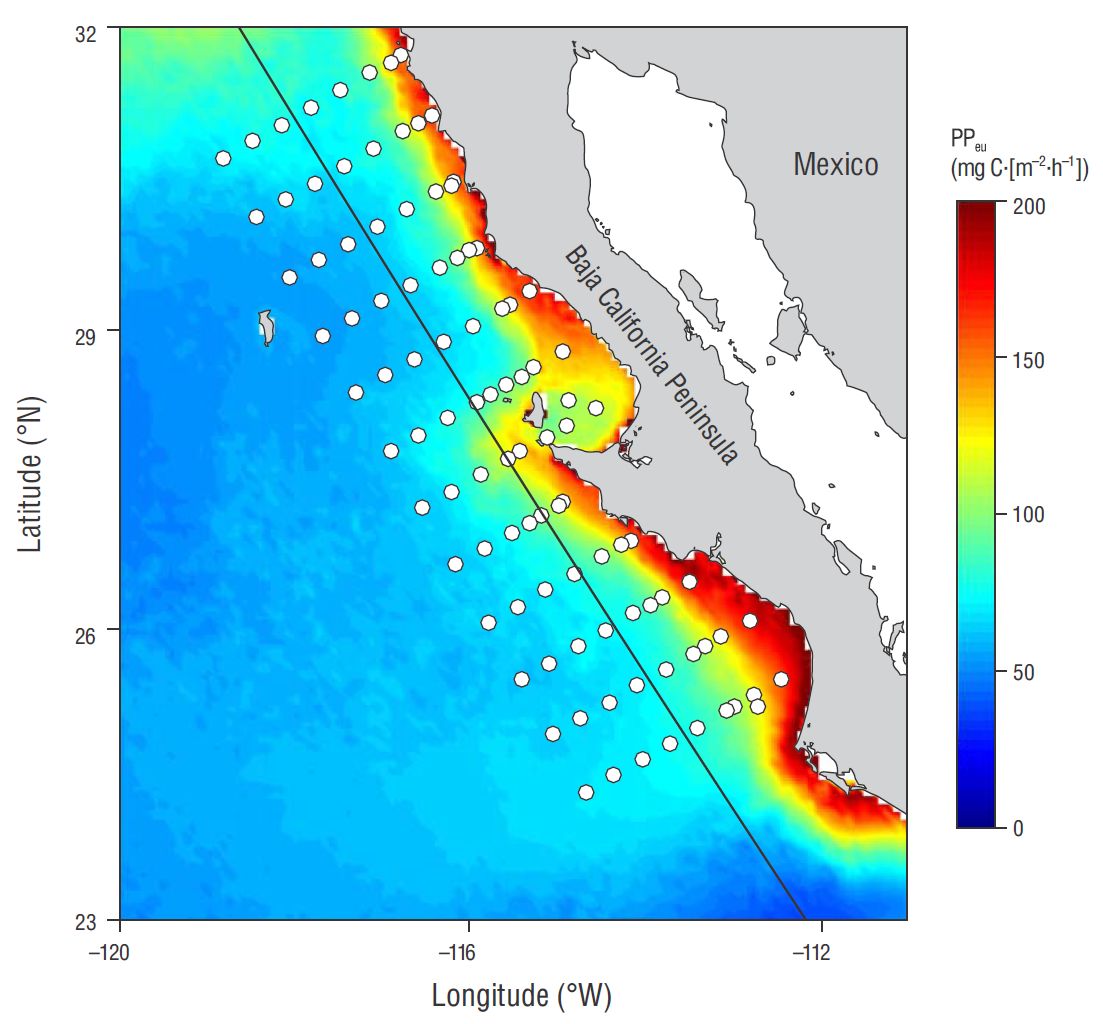
Figure 1 IMECOCAL monitoring network (white circles) . Circles indicate the stations where in situ experiments were carried out on at least one occasion to determine primary productivity (PP). The color scale shows integrated PP in the euphotic zone (PPeu) as calculated with the Vertically Generalized Production Model (Behrenfeld and Falkowski 1997); map shows the mean value calculated using the monthly data measured by MODIS-Aqua from 2002 to 2016 (https://oceancolor.gsfc.nasa.gov/). The transect located parallel to the coast (black line) was used to generate Figure 5

Water samples collected at each depth were filtered with a 150-μm mesh to remove macrozooplankton and placed in 250-mL polycarbonate bottles, which were inoculated with 5 μCi of NaH14CO3. For each optical depth, 1 dark and 2 light bottles were used. They were placed in transparent acrylic tubes. Bottle arrangements were then returned to the sam-pling depth, and they were incubated for 1.5 to 2.0 h. After incubation, samples were filtered through a 45- μm GN-6 membrane. Each filter was placed in 20-mL glass vials, and 0.5 mL of 10% HCl were added to remove NaH14CO3 excess. After 3 h, 10 mL of scintillation cocktail (Ecolite) were added to each vial. Radioactivity was determined with a Beckman LS-6500 scintillation counter. PP estimations were calculated using disintegrations per minute and corrected by the dark bottle (Parsons et al. 1984). PP profiles were normalized using the Chla concentration, and PoptB in the water column (mg C (mg Chla)-1 h-1) was defined as the maximum observed value in each PP profile normalized by Chla. All homogeneous profiles were discarded from the database. In total, 430 in situ PP experiments were carried out, covering almost 100% of the stations from the IMECOCAL monitoring network (Fig. 1). Variations in PP as a response to hydrographic conditions were analyzed based on the empirical regional relation between PoptB and SST (equation 1) described by Cepeda-Morales et al. (2010). This regional empirical adjustment estimates PoptB as a function of satellite-derived temperature (T) and allows the estimation of PP integrated to the euphotic zone (Behrenfeld and Falkowski 1997) (Fig. 1).

PoptB=4.15 ×10-4T7-0.0532 T6+2.899 T5-87.24 T4+1567.1 T3-16745 T2+98946 T-2.491 ×105 (1)

To quantify the Chla concentration (mg m-3) at each optical depth, 1 L of water was collected and filtered through GF/F Whatman glass fiber filters at a positive pressure. Filters were then placed in HistoPrep tissue capsules, properly labeled, and stored in liquid nitrogen for later analysis in the laboratory. At the laboratory, the Chla sample was placed in 10 mL of 90% acetone for 24 h at ~4 ºC in complete darkness (Venrick and Hayward 1984). Pigment concentration was quantified using the fluorometric method (Yentsch and Menzel 1963, Holm-Hansen 1965) and calibrating the fluorometer with a pattern of Chla (Sigma).

To determine phytoplankton composition, water samples were collected during the oceanographic cruises in the 2001-2008 period. Samples were collected at a depth of 10 m and stored in 250-mL dark bottles with formaldehyde at a pH of 7.5 to 8.0. Phytoplankton analysis was carried out within the first 2 months after each cruise. To perform cell counts, 50 mL of seawater were concentrated in a sedimentation chamber. Phytoplankton counting and identification were done using an inverted microscope with 16× and 40× lenses (ZEISS VERT. A1).

SST data, measured with the AVHRR-Pathfinder sensor and processed with version 5 of the algorithm, were obtained from https://podaac.jpl.nasa.gov/. The SST data for the 1985-2009 period correspond to global images of level 3 monthly composites, which correspond to monthly average measurements adjusted to a regular georeferenced grid with a spatial resolution of 4 km.

Results

The PoptB parameter (Fig. 2a) is a product of phytoplankton response to light and nutrient availability, the composition of the dominant community, and temperature. PoptB ranged from 0.5 to 17.5 mg C (mg Chla)-1 h-1, with an overall average of 5.1 ± 3.3 mg C (mg Chl a)-1 h-1. Most high values were located between 50% and 30% of irradiance, that is to say, within the first 25 m of the water column (Fig. 2b).
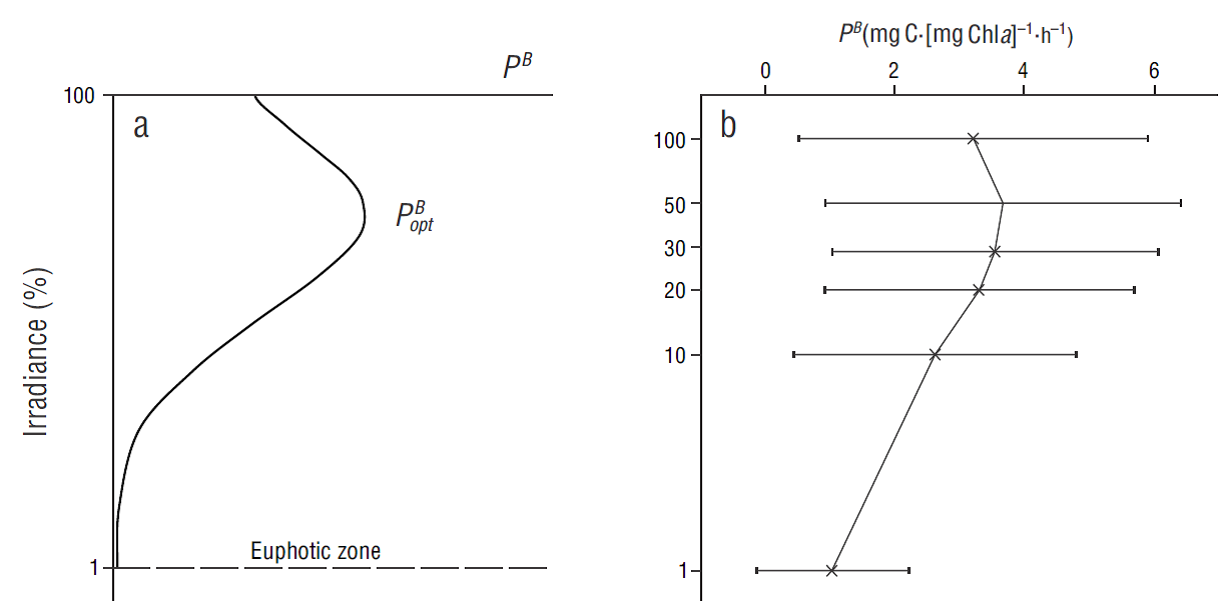
Figure 2 (a) Diagram of a vertical primary productivity profile normalized per unit of chlorophyll (P B ) in relation to light attenuation (percentage); the position of the photosynthetic parameter PoptB (mg C (mg Chla)-1 h-1) is indicated. (b ) Vertical distribution of total P B measurements taken between 1998 and 2012; the diagram shows the average (×) and standard deviation (bars) for each irradiance level at which in situ incubations were performed. 

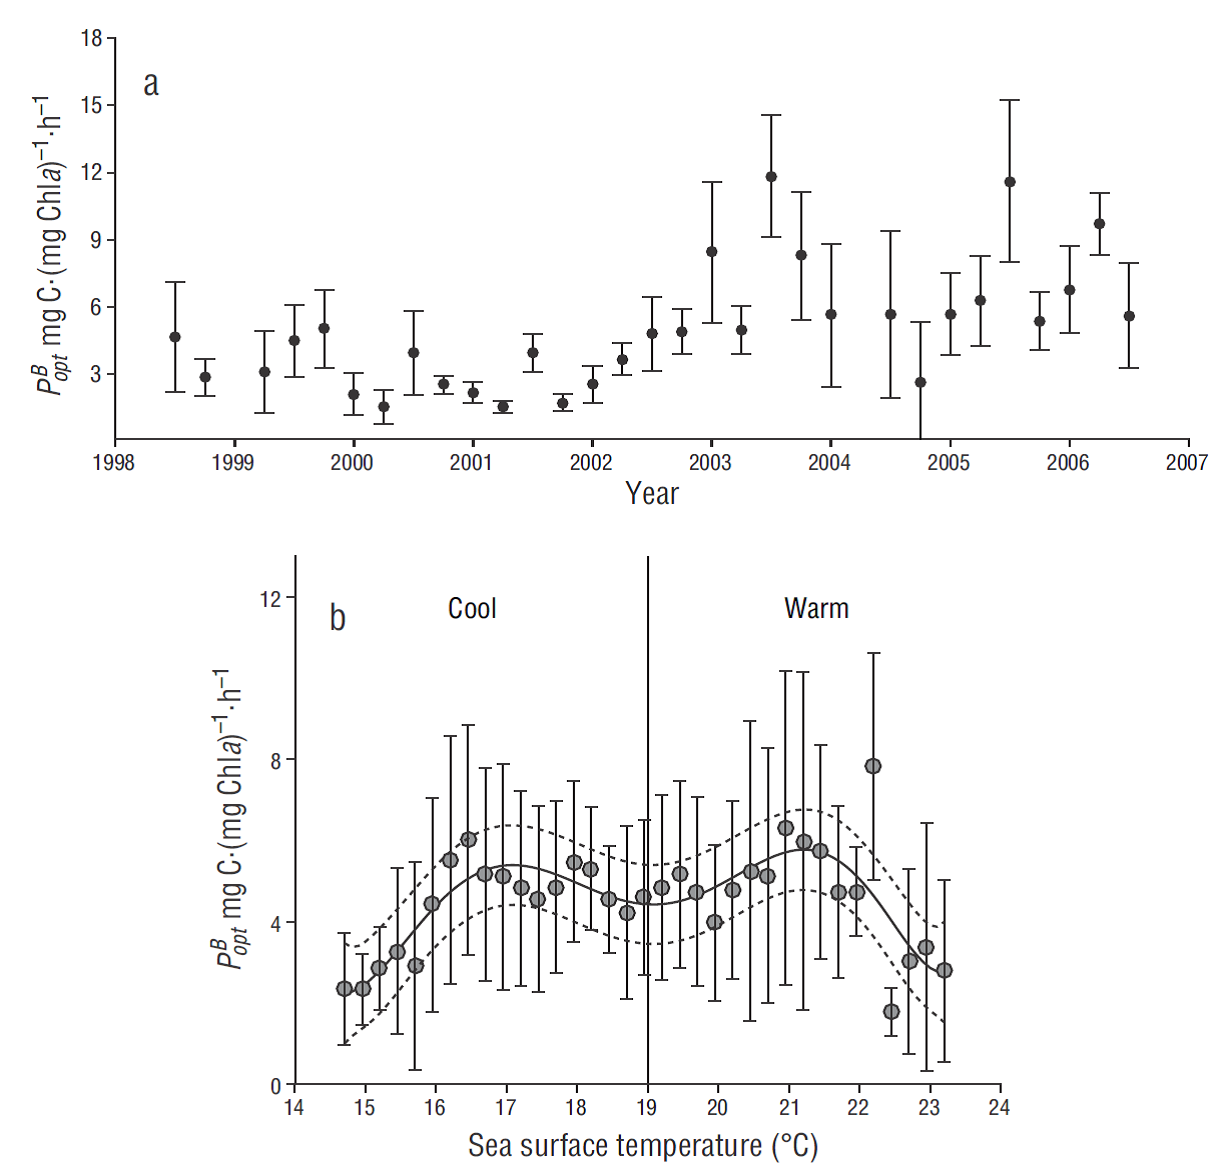
Average PoptB estimates per cruise showed wide scattering of values (Fig. 3a). The temporal variation shows that dispersion of measurements was smaller for the expeditions carried out from 1998 to 2002. In addition to the larger dispersion of the measured values, an increase in monthly PoptB was observed after 2003. These results provide initial evidence on the complexity of the response of primary producers to variations in regional hydrographic conditions. The empirical adjustment between PoptBand SST showed a curve with 2 maxima (Fig. 3b), both with a value of ~6.0 mg C (mg Chla)-1 h-1. The first maximum was located at 17 ºC and the second at 21.5 ºC, and both were separated by a relative minimum value at 19 ºC. This decrease in the PoptB curve at 19 ºC suggests that the phytoplankton community showed a physiological response to changes between warm and cold hydrographic conditions.

Figure 3 (a) Temporal variation of average optimal rates of carbon fixation ( PoptB , mg C [mg Chla]-1 h-1) per cruise during the period 1998-2007. (b) Empirical relationship between PoptB and CTD surface sea temperature measurements. 

In order to examine the importance of the 19 ºC surface isotherm as an indicator of the cold/warm regime change, the geographic position of this temperature value was determined on each monthly image (Fig. 4). In the region closest to the coast, the spatial dispersion of isotherms shows large latitudinal variability (~8º latitude) during the 25 years, which indicates alternating upwelling events. The average position (thick black contour) of the 19 ºC isotherm is located approximately 27ºN (off Punta Eugenia), and it is also asymmetrically located with respect to the spatial distribution of the isotherms.
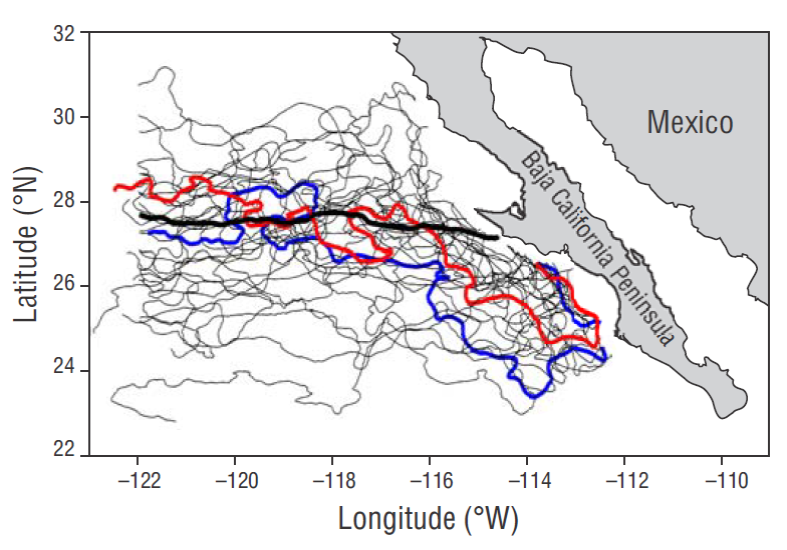
Figure 4 Monthly scatter of the 19 ºC surface isotherm from 1985 to 2009 (thin black lines). The thick black contour indicates the total average. Isotherms for January 1985 and January 2009 are shown in blue and red, respectively. The data correspond to level 3 monthly compounds calculated with AVHRR-PATHFINDER v5 . 

The SST spatiotemporal evolution shows that the geographic amplitude of the 19 ºC isotherm in the study area responds mainly to the seasonal scale, with a latitudinal displacement of up to ~32ºN during summer and ~24ºN during winter (Fig. 5). In addition to the seasonal scale, the displacement of the isotherm shows the effect of warm and cold inter-annual events during some years. The temperature decrease in 1989, when the 19 ºC isotherm moved further south, and the cold events from 1999-2001 and 2006 are noteworthy. Warm periods were observed during 1992-1993, 1996-1998, 2002-2005, and 2007.
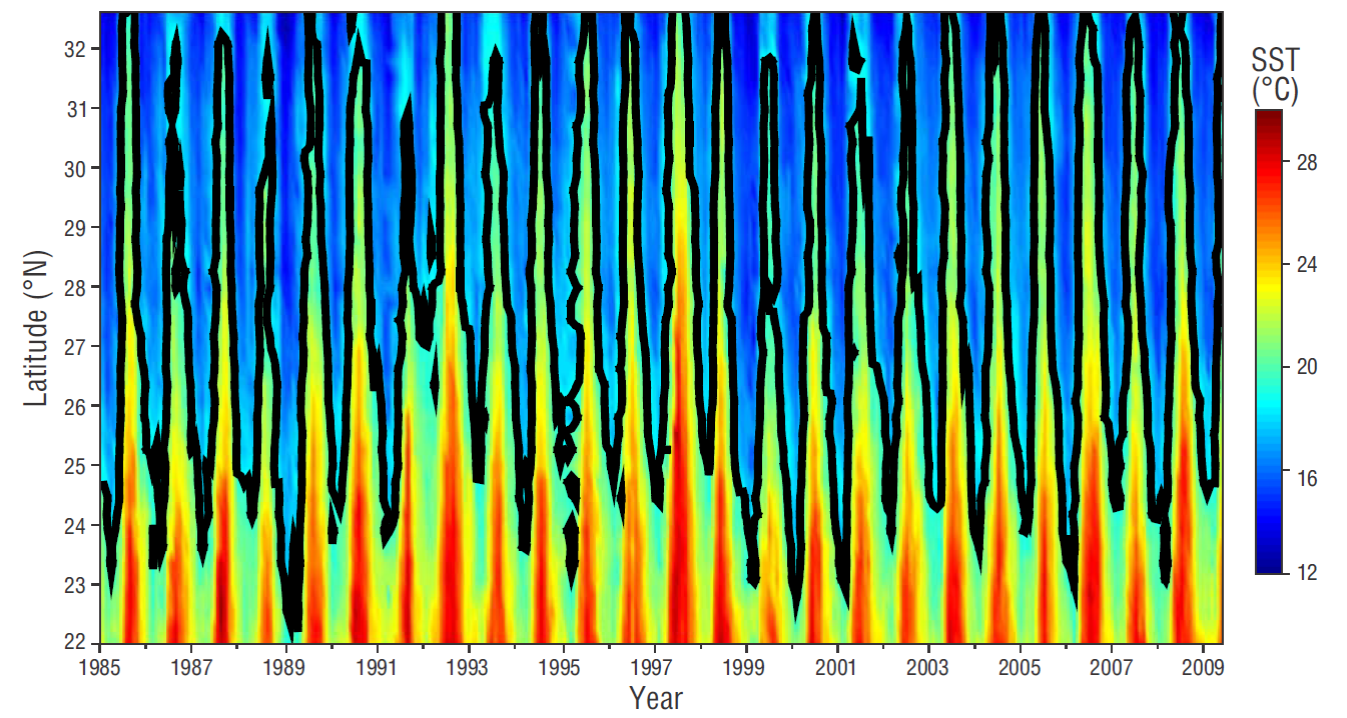
Figure 5 Spatiotemporal diagram of sea surface temperature (SST) variations for a transect located parallel to the coast (see Fig. 1). 

The interannual variability was also observed in Chla concentrations at 20 m depth. The anomalies of the Chla regional average at 20 m depth, which is approximately the depth of the average PoptB value (Fig. 2b), show the marked interannual changes in phytoplankton biomass (Fig 6a). In the first 2 years (1998 to 1999), Chla concentration showed negative anomalies. Thereafter, from 2000 to the end of 2002, positive anomalies were observed, with high values during January 2002 (1.4 mgꞏm-3). In the pelagic ecosystem, a period of negative anomalies that extended from 2003 to the end of 2007 was recorded. During 2008 and 2010-2011, Chla concentrations were again positive. This alternation of positive and negative Chla anomalies can be contrasted with the interannual changes in the hydrographic and atmospheric conditions of the equatorial region, which are represented by the El Niño Multivariate Enso Index (MEI) for the study period (Fig. 6b). The MEI indicates a salient El Niño event in 1998 (positive anomalies), followed by La Niña favorable conditions (negative anomalies) during 1999-2002. Positive anomalies were observed from late 2002 to mid-2005. Significant cold conditions were recorded in 2007-2008 and from mid-2010 to early 2012.
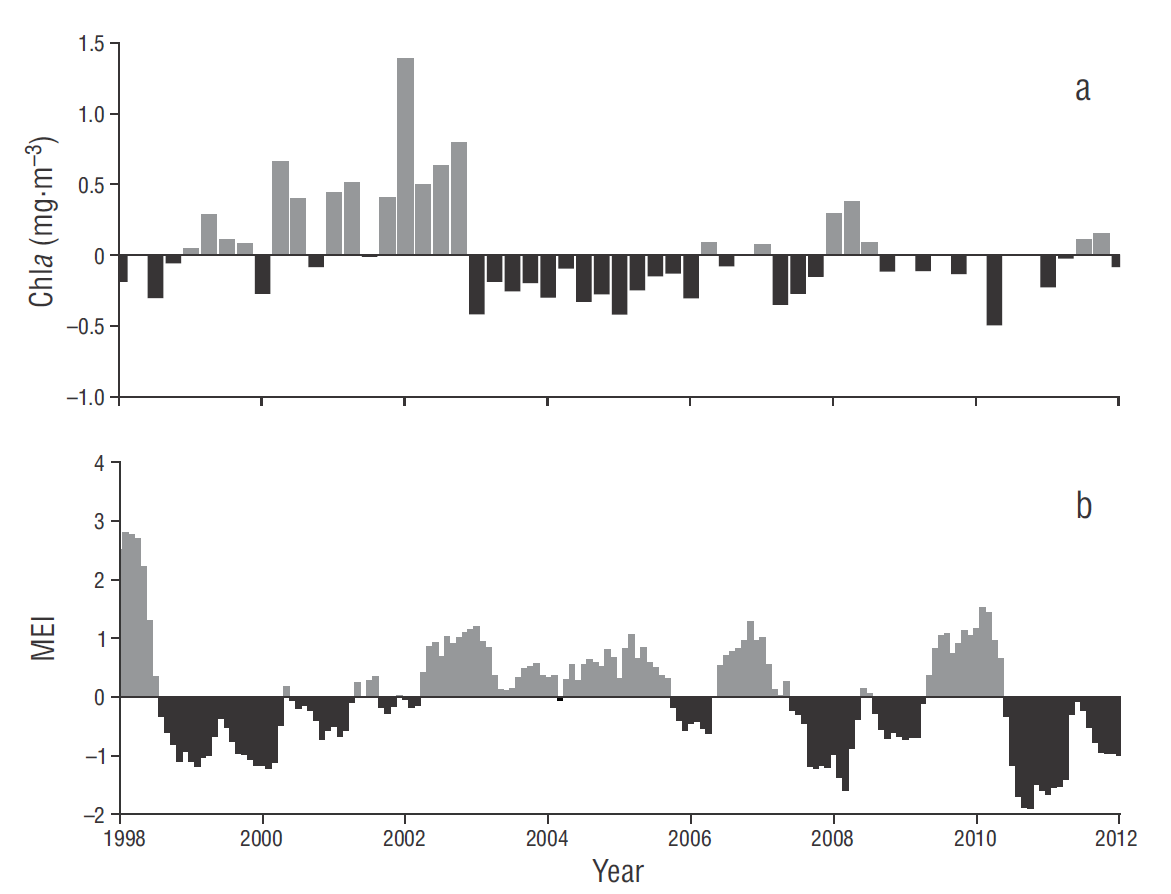
Figure 6 (a) Regional averages of chlorophyll (Chla) concentration anomalies (mgꞏm-3) measured at 20 m depth, which corresponds to the depth closest to the position of the optimal rate of carbon fixation ( PoptB) (Fig. 3B). (b) Temporal variation of El Niño Multivariate Enso Index (MEI) for the study period. 

Data concerning nano -microphytoplankton abundances were only available for the winters (January) in the 2001-2008 period (Fig. 7) . Abundances were highest (70 × 103 cells L-1) during 2001, but they abruptly dropped to low concentrations (3-10 × 103 cells L-1) during the period 2002-2006. During 2006-2007, abundances again increased (20-40 × 103 cells L-1) and then decreased to less than 10 × 103 cells L-1 in 2008.

Figure 7 Temporal variation of the abundance and community composition of nano-microphytoplankton (diatoms and dinoflagellates) measured between 2001 and 2008. La Niña y El Niño interannual events are indicated (black arrows) 

Discussion

At a global scale, carbon fixation via phytoplankton photosynthesis directly responds to climate variability (Behrenfeld et al. 2006) . In the last decades, changes in the oceanic conditions have favored a worrisome trend towards decreasing fixation rates. Primary productivity depends on light and nutrient availability, and these factors are controlled by different dynamic processes in the ocean at different scales (Behrenfeld et al. 2009) . PP trends have been difficult to assess due to the scarcity of available in situ data, and this is why a Chla-based index (Demarcq 2009) or models that use satellite-derived Chla data have been used (Behrenfeld et al. 2009); therefore, results are influenced by trends in Chla.

The photosynthetic parameter PoptB has been a key factor in PP satellite assessments on a global scale because it allows to identify the response of phytoplankton, in terms of its photosynthetic rate, to environmental conditions in different oceanic biomes (Behrenfeld and Falkowsky 1997). On a regional level, it has not been applied frequently due to the existence of a global algorithm and to the methodological difficulty in obtaining in situ data. This difficulty is evident when comparing the number of measurements of this parameter (~450 in 20 years) with those of Chla concentrations (~650 per cruise). The results show that the maximum average PoptB values (~6.0 mg Cꞏ(mg Chla)-1ꞏh-1) observed at 17.0 and 21.5 ºC (Fig. 3a) were similar to the overall mean (~6.5 mg Cꞏ(mgChla)-1ꞏh-1) at 20 ºC (Behrenfeld and Falkowski 1997). The observed PoptB values showed a wide interval ranging, from 0.5 to 17.0 mgC (mg Chla)-1 h-1, which together with light and nutrient availability may indicate a change in phytoplankton community composition (Almazán-Becerril et al. 2012). The light-nutrient relationship in the euphotic zone is controlled by the vertical displacements of the pycnocline, which responds to the dynamic processes that act at different scales in the CCS (Durazo and Baumgartner 2002, Soto-Mardones et al. 2004, Durazo 2009, Espinosa-Carreón et al. 2012). The mechanisms involved in the rising of the pycnocline increase light and nutrient availability in the euphotic zone, favoring high PP rates. However, the dominant community composition should also be considered, since picoplankton (e.g., Prochlorococcus) shows high PP rates (Casey et al. 2007) and it is the dominant group above the pycnocline (Jonhson et al. 2006).

The established empirical regional relation between SST and PoptB for the southern region of the CCS (Cepeda-Morales et al. 2010) offers the opportunity to refine PP satellite estimates at a regional level and provides additional information on the response of the phytoplankton community in the region. The maximum photosynthetic rates and their relation to SST are characteristics of each species and/or groups and reach maximum values under specific temperature conditions (Eppley 1972). At a global level, the relationship between the PoptB and SST is related to large biomes (Behrenfeld and Falkowski 1997). At a regional level, our results suggest that it is possible to associate phytoplankton variations with PoptB and SST, as indicators of hydrographic conditions.

The zone division into 2 regions (north and south), for which the boundary has been delineated at Punta Eugenia, off Baja California, has been extensively documented. Our results show that the average spatial distribution of the 19 ºC isotherm is related to the biogeographic zonation of the southern portion of the CCS (McClatchie et al. 2009), and its spatial variations clearly demonstrate the change in hydrographic conditions from cold to warm periods.

The interannual changes related to El Niño/La Niña that modify pycnocline depth generate negative Chla anomalies during warm events (deep pycnocline) and positive anomalies during cold events (shallow pycnocline) (Gaxiola et al. 2008, Espinosa-Carreón 2012). However, the changes that occurred between mid-2002 and late 2007 (El Niño) (Fig. 6b), which yielded negative Chla anomalies (Fig. 6a), caused high PoptB values (Fig. 3a). Moreover, data on the nanomicrophytoplankton composition of the main groups (diatoms and dinoflagellates) (Fig. 7) indicate a decrease in cell abundances (<10 × 103 cellsꞏL-1), which coincides with the increase in PoptB (Fig. 3a). These results suggest that there is a community change since low vertical flow of nutrients and warm conditions favor the dominance of picoplankton, which have high photosynthesis rates (Sosa-Avalos et al. 2010).

Some of the main groups in the phytoplankton community composition of the southern region of the CCS are picoplankton (Prochlorococcus, Synecococcus, and picoeukaryotes; Almazán-Becerril et al. 2012) and nanomicrophytoplankton (several species of diatoms and dinoflagellates; Millán-Núñez et al. 2004, Millán-Núñez and Millán- Núñez 2010, Linacre et al. 2012). The contribution of picoplankton to biomass is of 46% during winter (Millán-Núñez and Millán-Núñez 2010), though this group is also present in the ecosystem throughout the year (Barocio-León et al. 2006, Almazán Becerril et al. 2012). Martínez-Almeida et al. (2014) reported that the contribution to picoplankton biomass in 2008 was almost constant throughout the year and that major changes occurred due to variations in diatom and dinoflagellate abundances. In addition, despite the low biomass, cells that make up picoplankton are able to contribute about 50% of global PP due to their large abundance (Casey et al. 2007, Johnson et al. 2006).

The worldwide trend towards increasing ocean temperatures affects the stability of the water column and the variability of the mixed layer, modifying nutrient availability for phytoplankton (Boyce et al. 2010) and carrying worrying consequences for each ecosystem. Nevertheless, these consequences are still not clear, for each region responds in different ways (Belkin 2009). The pelagic ecosystem off the coast of the Baja California Peninsula seasonally changes its hydrographic conditions from cold to warm periods due to its transitional nature. These oscillations have been intensified by interannual (El Niño/La Niña) and decadal events. Under these conditions, the response of primary producers has proven to be different in terms of biomass and carbon fixation rate or PP. In the northern region of the CCS, the data for integrated PP have shown a marked seasonal pattern. However, long-period trends that give evidence of climate change effects have not yet been reported (Kahru et al. 2009). Nevertheless, the clear patterns of seasonal and interannual variabilities with the temporal variation in Chla are consistent with changes in hydrographic conditions; Chla increases during cold periods and decreases during warm periods, with a long-period tendency to decrease in the oceanic zone (Behrenfeld et al. 2009). The response of primary producers in the southern region of the CCS has shown high PoptB values that are apparently associated with community adjustments, which could be explained by the contribution of picoplankton due to its high growth rates.

Acknowledgements

This work is dedicated to Gilberto Gaxiola-Castro†, who dedicated his last 20 years to the study of primary producers in the IMECOCAL region. The IMECOCAL program was supported by the National Council for Science and Technology (CONACYT, Mexico; projects G0041T, 017Pñ-1297, G35326T, C0125343, C02-42569, 47044, 23947, 48367) and by the SEMARNAT-CONACYT fund (23804). The authors would like to thank CICESE for supporting the IMECOCAL program and the crew members of the R/V Francisco de Ulloa. Thanks are due to Francisco Ponce for editing the figures. SST satellite data were obtained from the NASA EOSDIS Physical Oceanography Distributed Active Archive Center (PO.DAAC) at the Jet Propulsion Laboratory, Pasadena, California.

References

Aguirre-Hernández E, Gaxiola-Castro G, Najera-Martinez S, Baumgartner T, Kahru M, Mitchell G. 2004. Phytoplankton absorption, photosynthetic parameters and primary production off Baja California: summer and autumn 1998. Deep-Sea Res. II 51(6-9): 799-816. http://dx.doi.org/10.1016/j.dsr2.2004.05.015 [ Links ]

Almazán-Becerril A, Rivas D, García-Mendoza E. 2012. The infuence of mesoscale physical structures in the phytoplankton taxonomic composition of the subsurface chlorophyll maximum off western Baja California. Deep-Sea Res. I 70: 91-102. http://dx.doi.org/10.1016/j.dsr.2012.10.002 [ Links ]

Barocio-León O, Millán-Núñez R, Santamaria-Del-Ángel E, González-Silvera A, Trees C. 2006. Spatial variability of phytoplankton absorption coefficients and pigments off Baja California during November 2002. J. Oceanogr. 62: 873-885. [ Links ]

Belkin Igor M. 2009. Rapid warming of large marine ecosystems. Prog. Oceanogr. 81(1-4): 207-213. http://dx.doi.org/10.1016/j.pocean.2009.04.011 [ Links ]

Behrenfeld MJ, Falkowski PG. 1997. Photosynthetic rates derived from satellite-based chlorophyll concentration. Limnol. Ocean. 42(1): 1-20. http://dx.doi.org/10.4319/lo.1997.42.1.0001 [ Links ]

Behrenfeld MJ, O’Malley RT, Siegel DA, McClain CR, Sarmiento JL, Feldman GC, Milligan AJ, Falkowski PG, Letelier RM, Boss ES. 2006. Climate-driven trends in contemporary ocean productivity. Nature. 444(7120): 752-755. http://dx.doi.org/10.1038/nature05317 [ Links ]

Behrenfeld MJ, Siegel DA, O’Malley RT, Maritorena S. 2009. Global Ocean phytoplankton. In: State of the climate in 2008, Peterson TC and Baringer MO (eds.). Bull. Amer. Meteor. Soc. 90: S568-S573. [ Links ]

Boyce DG, Lewis MR, Worm B. 2010. Global phytoplankton decline over the past century. Nature. 466(7306): 591-596. http://dx.doi.org/10.1038/nature09268 [ Links ]

Carr ME, Friedrichs MAM, Schmeltz M, Aita MN, Antoine D,Arrigo KR, Asanuma I, Aumont O, Barber R, Behrendeld M, et al. 2006. A comparison of global estimates of marine primary production from ocean color. Deep-Sea Res. II 53(5-7): 741-770. http://dx.doi.org/10.1016/j.dsr2.2006.01.028 [ Links ]

Casey J, Lomas M, Mandecki J, Walker D. 2007. Prochlorococcus contributes to new production in the Sargasso Sea deep chlorophyll maximum. Geophys. Res. Lett. 34, L106604 http://dx.doi.org/10.1029/2006GL028725 [ Links ]

Cepeda-Morales J, Gaxiola-Castro G, Durazo R, De la Cruz-Orozco ME. 2010. Productividad primaria modelada. In: Gaxiola-Castro G, Durazo R (eds.), Dinámica del Ecosistema Pelágico frente a Baja California, 1977-2007: Diez años de Investigaciones Mexicanas de la Corriente de California. 2010. Secretaría de Medio Ambiente y Recursos Naturales, Mexico, pp. 59-85. [ Links ]

Demarcq Hervé. 2009. Trends in primary production, sea surfacetemperature and wind in upwelling systems (1998-2007). Progr. Oceanogr. 83(1-4): 376-385. http://dx.doi.org/10.1016/j.pocean.2009.07.022 [ Links ]

Durazo R. 2009. Climate and upper ocean variability off Baja California, México: 1997-2008. Prog. Oceanogr, 83(1-4): 361-368. http://dx.doi.org/10.1016/j.pocean.2009.07.043 [ Links ]

Durazo R. 2015. Seasonality of the transitional region of the California Current System off Baja California. Journal of Geophysical Research 120(2): 1173-1196. http://dx.doi.org/10.1002/2014JC010405 [ Links ]

Durazo R, Baumgartner TR. 2002. Evolution of oceanographic conditions off Baja California, 1997-1999. Prog. Oceanogr. 54(1-4): 7-31. http://dx.doi.org/10.1016/S0079-6611(02)00041-1 [ Links ]

Eppley R. 1972. Temperature and phytoplankton growth in the sea. Fish. Bull. 70(4): 1063-1081. [ Links ]

Espinosa-Carreón TL, Gaxiola-Castro G, Durazo R, Cruz-Orozco ME De la, Norzagaray-Campos M, Solana-Arellano E. 2015. Influence of anomalous subarctic water intrusion on phytoplankton production off Baja California. Cont. Shelf Res. 92: 108-121. http://dx.doi.org/10.1016/j.csr.2014.10.003 [ Links ]

Espinosa-Carreón TL, Gaxiola-Castro G, Emilio Beier, Strub T, Kurczyn JA. 2012. Effects of mesoscale processes on phytoplankton chlorophyll off Baja California. J. Geophys. Res. 117 (C4).http://dx.doi.org/10.1029/2011JC007604 [ Links ]

Espinosa-Carreón TL, Strub PT, Beier E, Ocampo-Torres F, Gaxiola-Castro G. 2004. Seasonal and interannual variability of satellite-derived chlorophyll pigment, surface height, and temperature off Baja California. J. Geophys. Res. 109 (C03039). http://dx.doi.org/10.1029/2003JC002105 [ Links ]

Gaxiola-Castro G, Durazo R, Lavaniegos B, De la Cruz-Orozco, Millán-Núñez E, Soto-Mardones L, Cepeda-Morales J. 2008. Pelagic ecosystem response to interannual variability off Baja California = Respuesta del ecosistema pelágico a la variabilidad interanual del océano frente a Baja California. Cien. Mar. 34(2): 263-270. [ Links ]

Gaxiola-Castro G, Lavaniegos B, Martínez A, Castro R, Espinosa-Carreón TL. 2010. Pelagic ecosystem response to climate variability in the Pacific Ocean off Baja California. pp.163-182. In: SW Simard and ME Austin (eds.). Climate Changeand Variability. Sciyo Books, 486 pp.http://dx.doi.org/10.5772/9807 [ Links ]

Holm-Hansen O, Lorenzen CJ, Holmes RW, Strickland JDH. 1965.Fluorometric determination of chlorophyll. J. Cons. Perm. Int. Expl. Mer 30(1): 3-15 http://dx.doi.org/10.1093/icesjms/30.1.3 [ Links ]

Johnson ZI, Zinser ER, Coe A, McNulty NP, Woodward EM, Chisholm SW. 2006. Niche partitioning among Prochlorococcus ecotypes along ocean-scale environmental gradients. Science. 311 (5768): 1737-1740. http://dx.doi.org/10.1126/science.1118052 [ Links ]

Kahru M, Kudela R, Manzano-Sarabia M, Mitchell G. 2009. Trends in primary production in the California Current detected with satellite data. J. Geophys. Res. 114(C2): C02004. http://dx.doi.org/10.1029/2008JC004979 [ Links ]

Lavaniegos, BE. 2009. Influence of a multiyear event of low salinity on the zooplankton from Mexican eco-regions of the California Current. Prog. Oceanogr. 83(1-4): 369-375. http://dx.doi.org/10.1016/j.pocean.2009.07.037 [ Links ]

Linacre L, Durazo R, Hernández-Ayón JM, Delgadillo-Hinojosa F, Cervantes-Díaz G, Lara-Lara JR, Camacho-Ibar V, Siqueiros-Valencia A, Bazán-Guzmán C. 2010. Temporal variability of the physical and chemical water characteristics at a coastal monitoring observatory: Station Ensenada. Cont. Shelf Res. 30(16): 1730-1742. http://dx.doi.org/10.1016/j.csr.2010.07.011 [ Links ]

Linacre L, Landry M, Cajal-Medrano R, Lara-Lara R, Hernández-Ayón M, Mouriño-Perez R, Garcia-Mendoza E, Bazán-Guzmán. 2012. Temporal dynamics of carbon flow through the microbial plankton community in a coastal upwelling system off northern Baja California, Mexico. Mar. Ecol. Prog. Ser. 461: 31-46. http://dx.doi.org/10.3354/meps09782 [ Links ]

Martinez-Almeida V, Gaxiola-Castro G, Durazo R, Lara-Lara R . 2014. Phytoplankton size-fractionated chlorophyll-a off Baja California during winter, spring, and summer 2008. Hidrobiológica. 24(3): 191-206. [ Links ]

McClatchie S, Goericke R, Schwing FB, Bograd SJ, Peterson WT, Emmett R, Charter R, Watson W, Lo N, Hill K, et al. 2009. The state of the California Current, spring 2008-2009: cold conditions drive regional differences in coastal production. CalCOFI Rep. 50: 43-68. [ Links ]

Millán-Núñez E, Millán-Núñez R. 2010. Specific absorption coefficient and phytoplankton community structure in the southern region of the California Current during January 2002. J. Ocean. 66: 719-730. [ Links ]

Millán-Núñez E, Sieracki ME, Millán-Núñez R, Lara-Lara JR, Gaxiola-Castro G , Trees C. 2004. Specific absorption coefficient and phytoplankton biomass in the southern region of the California Current. Deep-Sea Res. II. 51: 817-826. [ Links ]

Parsons TR, Maita T, Lalli CM. 1984. A manual of chemical and biological methods for seawater analysis. Pergamon Press. Oxford, UK, 173 pp. [ Links ]

Sosa-Avalos R, Gaxiola-Castro G , Mitchell BG, Cepeda-Morales J. 2010. Parámetros fotosintéticos y producción primaria estimada a partir de sensores remotos durante 1999. In: Gaxiola-Castro G , Durazo R (eds.), Dinámica del Ecosistema Pelágico frente a Baja California, 1977-2007: Diez años de Investigaciones Mexicanas de la Corriente de California. 2010. Secretaría de Medio Ambiente y Recursos Naturales, Mexico, pp. 319-331. [ Links ]

Soto-Mardones L, Parés-Sierra A, García J, Durazo R , Hormazabal S. 2004. Analysis of the mesoscale structure in the IMECOCAL region (off Baja California) from hydrographic, ADCP and altimetry data. Deep-Sea Res. II 51: 785-798. [ Links ]

Venrick EL, Hayward TL. 1984. Determining chlorophyll on the 1984 CalCOFI surveys. CalCOFI Rep. 25: 74-79. [ Links ]

Yentsch C S, Menzel DW. 1963. A method for the determination of phytoplankton chlorophyll and phaeophytin by fluorescence. Deep-Sea Res. 10: 221-231. [ Links ]

Received: March 01, 2017; Accepted: June 01, 2017

Creative Commons License This is an open-access article distributed under the terms of the Creative Commons Attribution License