Introduction
Primary production (PP) determination based on data derived from remote sensors, requires regional and temporal estimations of phytoplankton photosynthetic parameters such as maximum light utilization coefficient (α*) and maximum photosynthetic rate (
Spatial and temporal variabilitites in phytoplankton photophysiology are an important source of uncertainty in the models used to estimate PP (Sosik 1996). However, not all parameters required by the models for PP estimation with remote sensing data are available for every pixel (Platt and Sathyendranath 1988). One of the main issues with PP estimation based on remote sensing data is the extrapolation of local determinations of spatial and temporal photosynthetic parameters and bio-optical properties to large regions and long periods of time. This constitutes one of the most important tasks in biological oceanography (Longhurst et al. 1995, Sathyendranath et al. 1995). One way to solve this issue is to divide the ocean into regions with similar oceanographic characteristics (Longhurst et al. 1995, Sathyendranath et al. 1995), where photosynthetic parameters derived from the photosynthesis-irradiance (P-E) curves remain almost constant accross a region, over a season, or in time.
Satellite ocean color sensors have increased the use of synoptic images of phytoplankton biomass to perform global estimates of oceanic carbon fixation through phytoplankton photosynthesis (Platt and Sathyendranath 1988, Behrenfeld and Falkowski 1997) . Thus, remote sensors are a useful tool for ocean monitoring at large scales, since they also allow for synoptic coverage and the possibility of obtaining nearly real-time data (Sathyendranath and Platt 1989).
If chlorophyll concentrations and surface irradiance (E
PAR
) are determined from remote sensing data, average α* and
In the present study phytoplankton photophysiology is studied by determining average photosynthetic parameter values and bio-optical properties in the southern region of the California Current, off Baja California (Mexico). This region is considered a transition zone due to the influence of cooler, less -saline subarctic waters and warmer, saltier water of tropical and subtropical origin (Durazo and Baumgartner 2002, Durazo 2009). The seasonal variability of parameters is studied and the possibility for these parameter to be extrapolated to a regional scale is evaluated. Together with remote sensing data, PP is estimated to represent the oceanographic conditions of this transitional region.
Materials and methods
Oceanographic cruises were conducted in the southern region of the California Current, off Baja California, during each season in 1999 (Fig. 1) . Water samples were collected by the cruises at the depths corresponding to 100%, 50%, 30%, 20%, 10%, and 1% E PAR in hydrographic stations occupied near local midday. Also, vertical profiles of spectral irradiance (E d [ λ], μW cm-2 nm-1) and PAR (400-700 nm, mol photons m-2 s-1) were measured using a PRR-600 radiometer (Biospherical Instruments) which was lowered into the water over the stern of the ship.
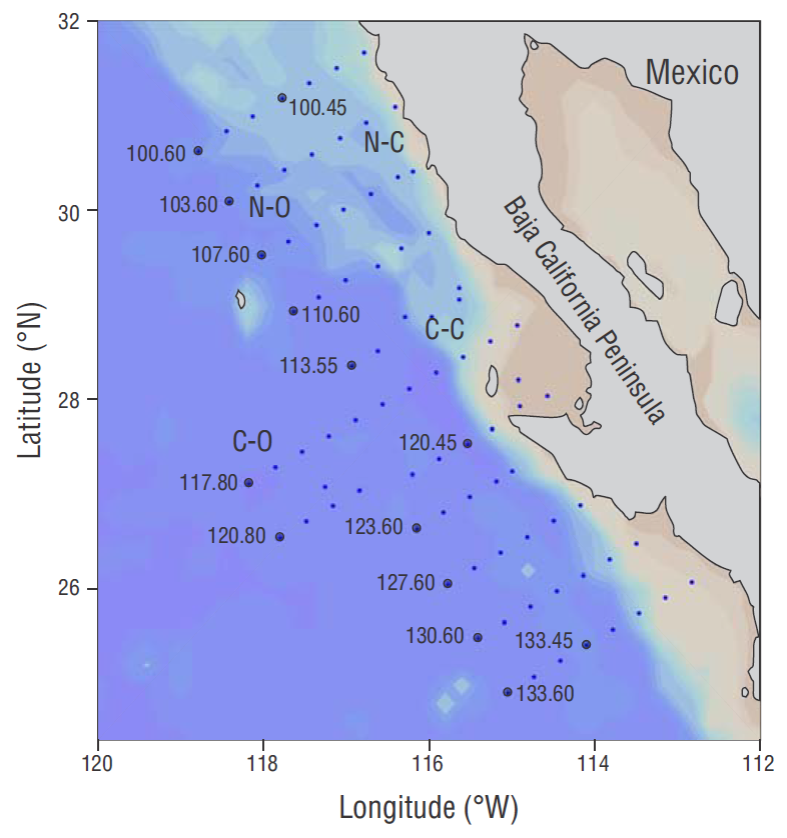
Figure 1 Location of the IMECOCAL (Spanish acronym for the Mexican Research of the California Current program) hydrographic lines and stations (filled circles). The northern region (lines 100-110) is subdivided into coastal (N-C, from shore to stations 000.45) and oceanic (N-O, starting at stations 000.50) zones, and the central region (líneas 113-133) is also subdivided into coastal and oceanic zones (C-C and C-O, respectively).
For chlorophyll (Chla) determination 2 L of seawater were collected at each depth; water was then passed through Whatman GF/F filters, which were frozen in liquid nitrogen. In the laboratory, phytoplankton Chla was extracted with 90% acetone at 4 ºC and in complete darkness for 24 h according to the recommendations by Venrick and Hayward (1984). Chlorophyll concentration (mg m-3) was determined by the fluorometric method (Yentsch and Menzel 1963, Holm-Hansen et al. 1965) using a Turner Designs A10 fluorometer calibrated with pure Chla (Sigma).
In addition, 2 L of water were collected at each depth to determine the light absorption coefficient of particles (a p [λ]). Water was filtered through GF/F filter, which were immediately frozen in liquid nitrogen. Light absorption by the total amount of particles retained in the filters was measured using a Varian Cary 1E UV-Vis spectrophotometer, according to the method described by Kishino et al. (1985), Mitchell (1990), and Mitchell et al. (2003). The same procedure was followed to determine the light absorption coefficient of detritus (a d [λ]). The light absorption coefficient of phytoplankton (a ɸ [λ]) was calculated as the difference between ɑ p (λ) and a d (λ).
Water samples were also used for identifying and quantifying phytoplankton by fixation with 2 mL of Lugol solution neutralized with acetic acid. A 50-mL aliquot was placed in settling chambers for 24 h and subsequently analyzed under an inverted microscope following the technique described by Utermöhl (1958).
In total 35 experiments were conducted to estimate in situ PP: 9 in spring, 11 in summer, and 15 in autumn. Water was collected at each depth to fill three 250-mL polycarbonate bottles, and these samples were inoculated with 100 μL (5 μCi) of NaH14CO3 according to the method described by Steemann-Nielsen (1952). Two clear bottles and one dark bottle were placed in transparent acrylic tubes and incubated for 2 h at the original sampling depths, at about midday local time. Primary production (mg Cꞏm-3ꞏh -1) was calculated ccording to Parsons et al. (1984) by subtracting the amount of assimilated carbon in the dark bottle.
During the 4 cruises, 54 experiments were conducted to estimate P-E curves. Water for the experiments was collected at depths corresponding to 50% E PAR , and it was used to fill 27 plain transparent polystyrene bottles for phytoplankton cultures with 250 mL capacity (Nunclon). Bottles were each
spiked with 5 μCi of NaH14CO3 (Steemann-Nielsen 1952) and placed in a Morel type incubator for 2 h under a light gradient supplied by a 500-W tungsten-halogen lamp (Babin et al. 1994). Light intensity at each position of the sample was determined with a QSL-100 irradiometer (Biospherical Instruments). The emission spectrum of the lamp is not spectrally neutral, as it is directly dependent on wave length, with a minimum emission in the blue and maximum in the red (Bouman et al. 2000). Carbon fixation rates (P, mg C m-3 h-1) were calculated from radioactive counts by subtracting the zero-time values .
The α* (mg C [mg Chla]-1 h-1/ mol photons m-2 s-1) and
The α* values derived from the P-E curves and the average light-specific absorption coefficient of phytoplankton (
To determine the
The study area was divided into northern (31º1.2 - 28º57.2 N, 116º46.6 -117º38.7 W; lines 100-110) and central (29º22.9 -24º55.1 N, 112º49.1 -118º10.9 W; lines 113-133) regions acording to the physical and biological properties (Lavaniegos et al. 2002). Each region was subdivided into 2 zones taking the coastal (36 to 145 km off the coast) and oceanic (180 to 290 km off the coast) stations into account (Fig. 1). Average (
The vertical distribution of chla (Chl[z]) was obtained using the surface values estimated with remote sensing data and the Chla profile parameters from the model by Platt et al. (1988), which were calculated for the area off Baja California by Millán-Nuñez et al. (1997) for each region and each season of the year. The vertical profiles for irradiance (E z [PAR]) measured throughout the water column with the PRR-600 were fitted to a regression model. The regression coefficients, together with the E PAR values measured by remote sensors, were used to estimate average irradiance vertical profiles for each region per season.
Results
Phytoplankton Biomass
In general, Chla concentrations near the surface (10 m) were higher at the coastal than at the oceanic stations (Fig. 2). In winter, Chla concentration in the coastal zone of line 110 (northern region) was 2.8 mg m-3, while in other coastal zones of the northern and central regions concentrations were >1.0 mg m-3 (Fig. 2a). In spring Chla was >2.0 mg m-3 at the coastal stations in both regions, with values up to 8.0 mg m-3 in lines 103-110 and 113-120 (Fig. 2b). Chlorophyll concentration in the central region was high in the summer, with values greater than 2.0 mg m-3 at the coastal stations of lines 113 (up to 3.5 mg m-3) and 127 (Fig. 2c). In autumn, the highest value was 7.5 mg m-3 and was recorded at the coastal stations of line 130 (Fig. 2d). The lowest Chla value in summer and autumn was recorded in the oceanic zone of both regions.
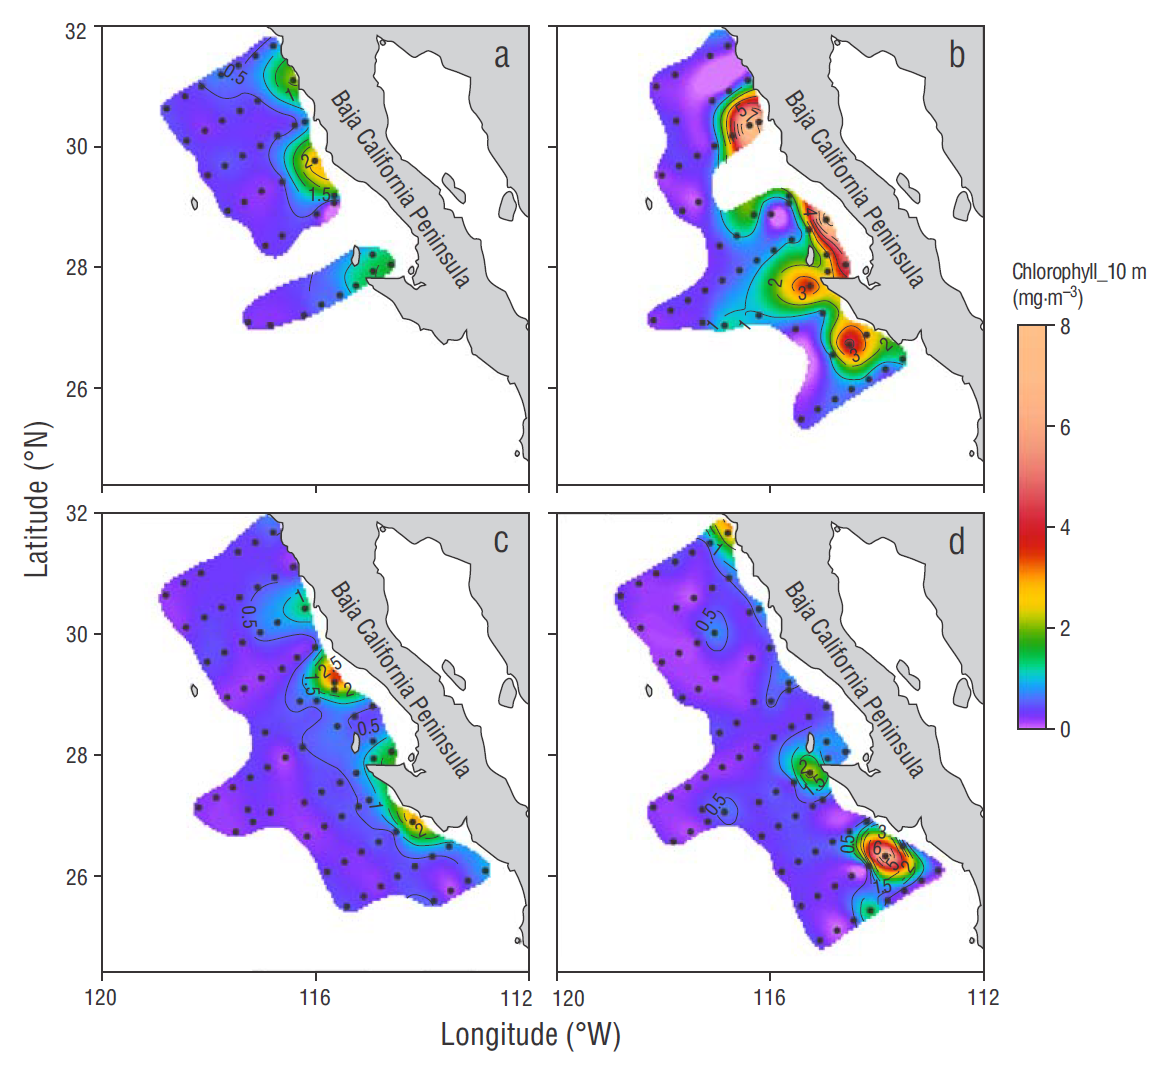
Figure 2 Spatial variability of chlorophyll concentration at 10 m depth measured at the sampling stations during each cruise in winter (a), spring (b), summer (c), and autumn (d).
During winter, integrated Chla (Cint) showed a maximum of 141 mg m-2 at station 110.35 and high values at the coastal stations of lines 113 and 120. A value greater than 100 mg m-2 was also observed for the oceanic region (Fig. 3a). In spring, the highest Cint values were recorded at the coastal stations of lines 107 and 120, and the lowest in the oceanic zone (Fig. 3b). In summer high values were observed (>100 mg m-2) at the oceanic stations in the central and southern portions of the central region (Fig. 3c). On the other hand, in autumn, Cint values were up to 419 mg m-2 at station 130.55, and lower in the rest of the area (Fig. 3d). The average Cint value for the whole study period was higher in the coastal zone of the northern and central regions (40 and 49 mg m-2, respectively), with the highest averages observed in spring and autumn. In the oceanic zone Cint the average was 20 and 29 mg m-2 in both regions, respectively (Table 1).
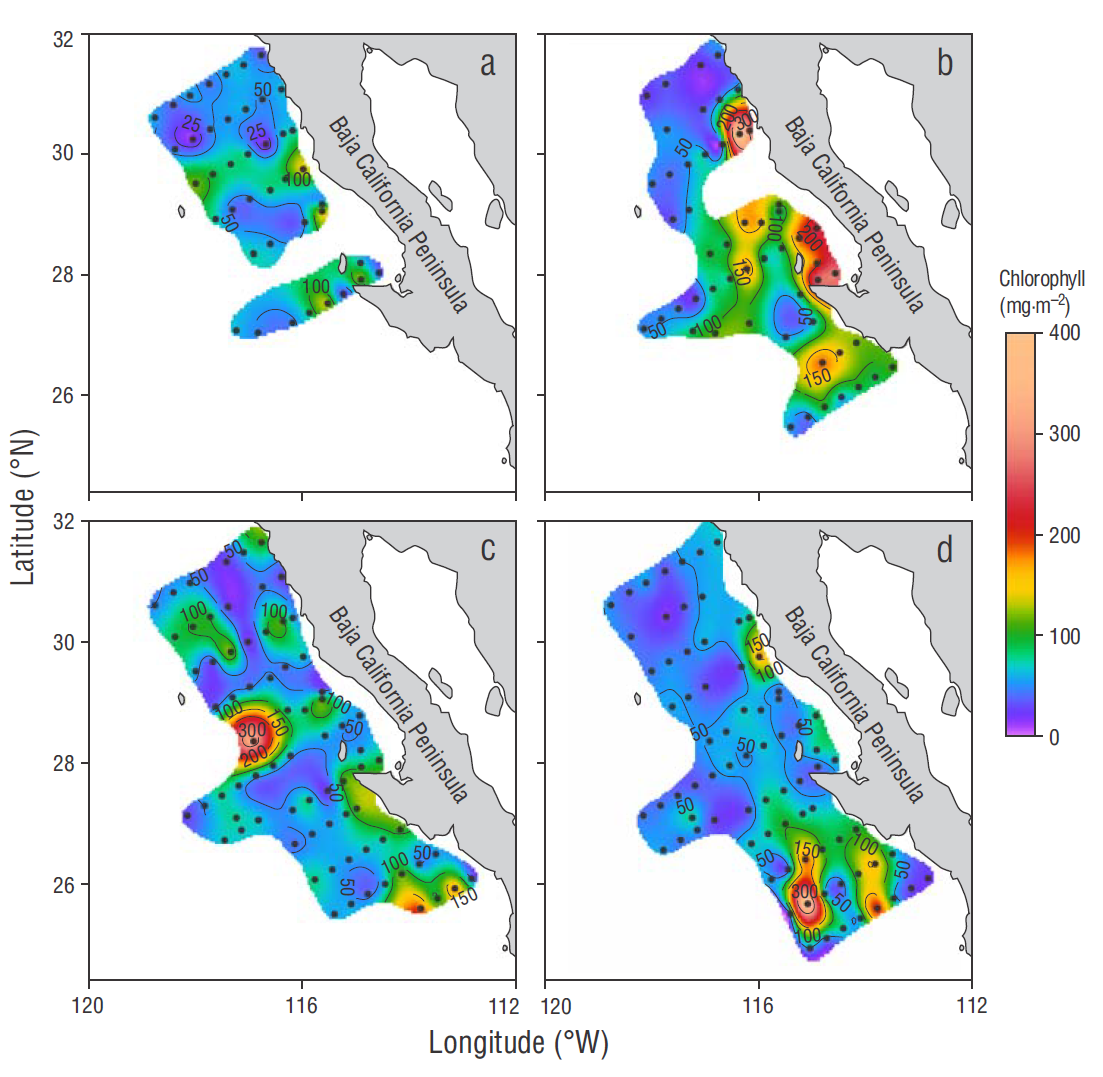
Figure 3 Spatial variability of chlorophyll integrated for the water column from cruise measurements taken in winter (a), spring (b), summer (c), and autumn (d).
Table 1 Average seasonal variability by region and zone for euphotic zone depth (Zeu, m), mixed layer depth (MLD, m), integrated chlorophyll for Zeu (Cint, mg m-2), maximum light utilization coefficient ( *, [mg C (mg Chla)-1 h-1]/[ mol fotones m-2 s-1]), maximum photosynthetic rate (
| Cruise | Zeu | MLD | Cint | α* |
|
E k | ɸ max | PP | PPm |
| North region/Coastal zone | |||||||||
| Winter | 48 (7.96) | 58 (6.79) | 13 (1.97) | 0.012 (0.001) | 1.77 (0.19) | 154 (13.62) | 0.023 (0.002) | NA | 48 (8.11) |
| Spring | 46 (4.04) | 41 (9.71) | 49 (14.10) | 0.030 (0.009) | 3.97 (2.10) | 116 (30.23) | 0.070 (0.023) | 103 (45.08) | 156 (64.70) |
| Summer | 78 (9.50) | 26 (3.40) | 39 (12.42) | 0.004 (0.002) | 3.33 (1.03) | 1011 (139.47) | 0.011 (0.003) | 57 (7.00) | 69 (12.17) |
| Autumn | 65 | 5 | 58 | 0.009 | 3.73 | 414 | 0.028 | 90 | 71 (15.10) |
| North region/Oceanic zone | |||||||||
| Winter | 33 (2.50) | 66 (7.50) | 10 (1.88) | 0.011 (0.002) | 2.23 (0.06) | 216 (25.56) | 0.022 (0.002) | NA | 17 (1.73) |
| Spring | 62 | 84 | 24 | 0.015 | 1.83 | 122 | 0.031 | 29 | 26 (3.27) |
| Summer | 67 (1.50) | 39 (1.50) | 17 (2.94) | 0.003 (0.000) | 2.84 (0.03) | 945 (8.40) | 0.007 (0.000) | 41 (0.00) | 32 (4.53) |
| Autumn | 94 (8.77) | 40 (3.46) | 29 (1.11) | 0.009 (0.003) | 3.26 (0.53) | 386 (63.68) | 0.029 (0.001) | 63 (7.65) | 46 (4.35) |
| Central region/Coastal zone | |||||||||
| Winter | 43 (3.64) | 44 (11.91) | 34 (6.44) | 0.024 (0.010) | 3.96 (0.99) | 196 (28.51) | 0.042 (0.014) | NA | 135 (16.20) |
| Spring | 33 (4.84) | 43 (12.24) | 59 (14.43) | 0.031 (0.006) | 4.33 (0.89) | 144 (9.88) | 0.068 (0.009) | 105 (46.00) | 158 (30.08) |
| Summer | 74 (10.82) | 22 (5.79) | 45 (10.20) | 0.008 (0.001) | 6.46 (0.84) | 819 (96.12) | 0.021 (0.002) | 140 (60.48) | 174 (19.88) |
| Autumn | 74 (6.33) | 17 (3.10) | 57 (7.75) | 0.021 (0.007) | 8.18 (2.30) | 434 (38.06) | 0.067 (0.022) | 139 (26.81) | 153 (12.59) |
| Central region/Oceanic zone | |||||||||
| Winter | 82 (6.33) | 80 (3.00) | 23 (2.06) | 0.009 (0.001) | 1.70 (0.10) | 192 (16.85) | 0.016 (0.002) | NA | 30 (2.06) |
| Spring | 65 (8.81) | 71 (8.73) | 26 (1.57) | 0.015 (0.003) | 2.07 (0.39) | 143 (12.01) | 0.049 (0.008) | 44 (7.88) | 64 (9.42) |
| Summer | 82 (3.14) | 38 (0.91) | 24 (3.69) | 0.003 (0.000) | 3.05 (0.44) | 910 (68.79) | 0.007 (0.001) | 50 (1.50) | 50 (3.36) |
| Autumn | 91 (5.61) | 20 (5.74) | 44 (9.51) | 0.018 (0.005) | 7.85 (2.10) | 466 (55.62) | 0.055 (0.025) | 141 (34.42) | 116 (12.90) |
Photosynthetic Parameters
The average α* values varied from 0.005 to 0.024 mg C (mg Chla)-1 h-1 ( mol photons m-2 s-1)-1 in summer and spring, respectively. Values in spring were 4.6 times higher than in summer and 1.6 times higher than in winter and autumn. In addition, average values were 1.7 times higher at the coastal stations than at the oceanic stations, and the highest values were reported for the coastal zone of the central region. The abundance of large cells such as diatoms (Chaetoceros spp. and Nitzschia spp., 3.2 × 10⁵ cel L-1) and dinoflagellates (Scrippsiella trochoidea and Protoperidinium spp., 1.36 × 10⁵ cel L-1) were associated with higher α* values in the coastal zones of the northern and central regions.
Contrary to the spatial distribution of α*,
The highest E k estimates were recorded for the summer cruise, with an average of 921 mol photons m-2 s-1. This value was 7 times higher than the average estimate for spring. Moreover, high E k values were recorded for the coastal and oceanic stations of both regions in summer and autumn (Table 1). The results for E k suggest that phytoplankton cells were photoaclimated to low irradiances during the winter and spring cruises, whereas in summer phytoplankton cells were acclimated to high irradiances.
The ɸ max averages ranged from 0.012 to 0.055 mol C/mol photons in summer and spring, respectively. The distribution of this parameter was similar to that of α*, with the highest values in the coastal zones of both the northern and central regions during the spring cruise (Table 1). The ɸ max values were directly correlated with the high α* estimates for this cruise and with the increased abundance of large phytoplankton cells such as diatoms and dinoflagellates.
Primary production
During the study period the average values of integrated PP (PPm) for the euphotic zone varied between 56 and 114 mg C m-2 h-1 in winter and spring, respectively. Compared with the estimates for the autumn cruise, PPm in the coastal zone of the northern region was 2.2 times higher in spring. In contrast, the PPm values for the oceanic zone were 1.4 times higher during autumn. Average PPm for the coastal zone of the central region was similar among the different cruises. However, estimated PPm for the oceanic zone was 1.8 times higher in autumn compared to the rest of the year (Table 1). In general, observed PPm values were higher than 100 mg C m-2 h-1 at the coastal stations of the central region in winter (Fig. 4a). In spring, 2 highly productive zones (>150 mg C m-2 h-1) were detected at the coastal stations for both the northern and central regions (Fig. 4b). During the summer and autumn cruises, PPm estimates were higher than 150 mg C m-2 h-1 and showed a larger spatial extension in both regions, although PPm estimates were highest in the coastal zone of the central region and to the south of this region (Fig. 4 c, d).
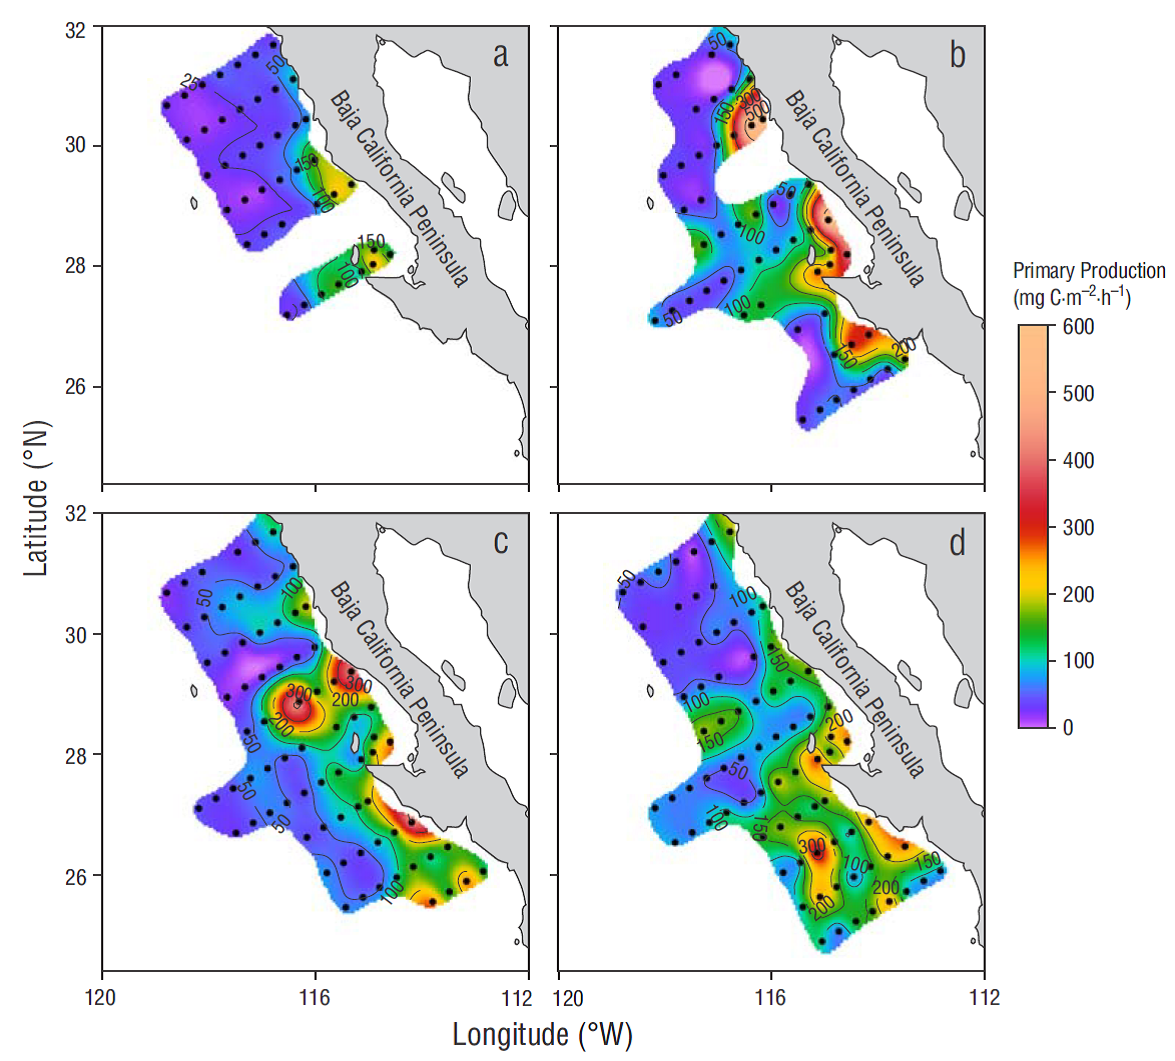
Figure 4 Primary production, estimated with the model proposed by Platt and Sathyendranath (1988), for winter (a), spring (b), summer (c), and autumn (d). Estimates are based on average vertical profiles of the maximum light utilization coefficient and maximum photosynthetic rate by zone and region, and on remote-sensing data.
The overall average for PPm was the same as the in situ PP average (94 mg C m-2 h-1). There was a high correlation (r = 0.85) between PPm and the PP estimate based on in situ 14C experiments (Fig. 5a). When the photosynthetic parameters, PAR, and in situ Chla corresponding to the 50% E PAR depth were introduced to the semi-analytical model proposed by Platt and Sathyendranath (1988), the linear regression model showed high correlation (r = 0.95) between PPm and in situ data for that depth (Fig. 5b). The PPm values estimated with the model for coastal waters of the northern and central regions was around 1.2 to 1.5 times higher than in situ PP estimates for spring and summer, whereas similar PPm and in situ PP estimates were recorded for autumn (Table 1). Furthermore, PPm was 1.2 times higher than in situ PP during spring but it was 0.9 and 0.8 times lower than in situ PP in oceanic waters of the central region during summer and autumn.
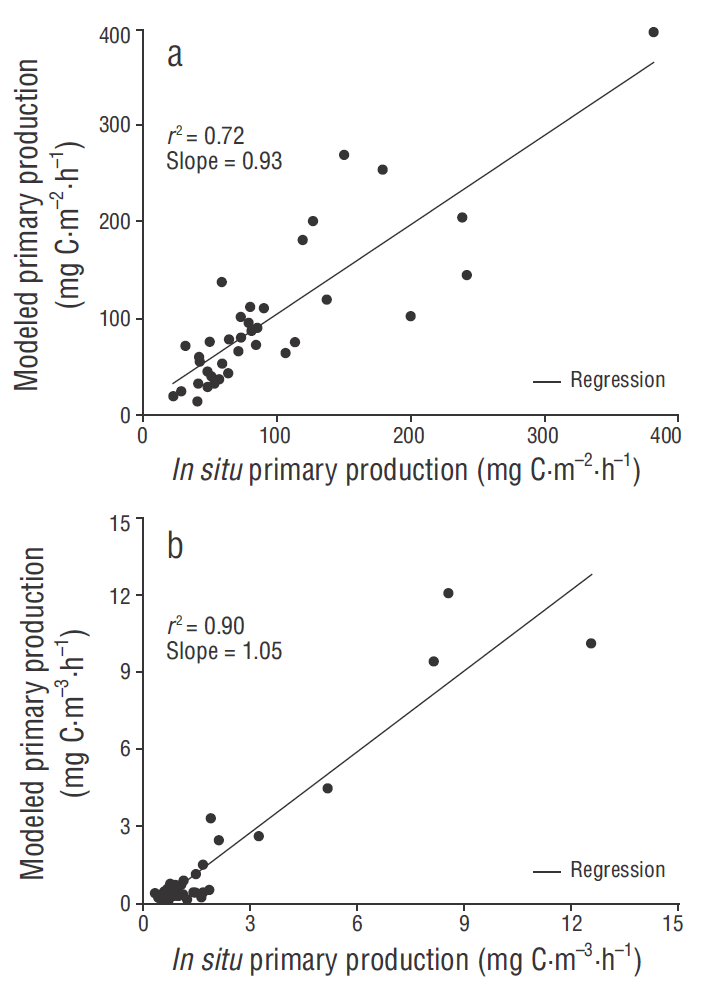
Figure 5 (a) Relationship between integrated primary production for the euphotic zone estimated with the model and that estimated with in situ measurements using the 14C experiments. (b) Relationship between in situ and modeled primary production at the depth corresponding to 50% of surface irradiance (E PAR ). The photosynthetic parameters of the photosynthesis-irradiance curves at 50% E PAR were used in the model.
Discussion
The Cint estimates for the coastal zone were higher during spring and autumn than during winter and summer but lower than the estimates for the 2000-2002 period reported by Gaxiola-Castro et al. (2010). Even though oceanographic conditions in 1999 were characteristic of a La Niña event, the effects on the ecosystem were apparently less intense then than during the La Niña event in 2002. In accordance with Gaxiola-Castro et al. (2010), the study area was divided into 3 zones depending on Chla concentrations: oligotrophic ( 0.25 mg m-3), mesotrophic (>0.25 and 1.0 mg m-3), and eutrophic (>1.0 mg m-3). The spatial distribution of Chla depends on coastal upwelling processes, which occur with greater intensity during spring (Durazo et al. 2010); the prevailing southward flow of the California Current; and the anomalously cold conditions due to the La Niña event. These processes increase nutrient supply to the euphotic zone near the coast and enhance phytoplankton growth (Gaxiola-Castro et al. 2010).
The variability in α* was apparently a response to the spatial and temporal changes in phytoplankton populations, which are primarily dominated by diatoms and dinoflagellates during spring. Furthermore, the changes seem to be related to phytoplankton photoacclimation and variations in a ɸ (λ). In spring, phytoplankton was photoacclimated to low irradiances, with high a ɸ (λ) values, which resulted in higher α* values in the coastal zone of the northern and central regions (Table 1). These differences in magnitude due to phytoplankton size have been previously reported for the same study area by Gonzalez-Morales et al. (1993).
In general, average α* values were slightly higher than and
The low
The average ɸ max values estimated for the present study were similar to those reported by Schofield et al. (1993) for the area off southern California. These authors found that the observed high spatiotemporal variability was due to changes in phytoplankton photophysiology and community composition. Moreover, variability in ɸ max has been linked to changes in nutrient availability (Babin et al. 1996, Sathyendranath et al. 1996, Sosik 1996), spectral irradiance, photoperiods and light field (Dubinsky et al. 1984), temperature (Chamberlin and Marra 1992), increasing cellular concentration of photo-protective carotenoids at high irradiances (Bidigare et al. 1989), and the ratio of the absorption coefficient between blue and red light (Sathyendranath et al. 1996).
The high ɸ max estimates for the spring cruise were associated with the presence of larger phytoplankton cells, such as diatoms and dinoflagellates, and with high a ɸ (λ) values. In contrast, low f max estimates for summer and autumn were associated with the abundance of small phytoplankton cells. Dubinsky et al. (1986) observed a slight decrease in this parameter with high growth irradiance (>500 mol photons m-2 s-1). Geider (1993) concluded that ɸ max is mainly independent of the irradiance in cells growing under high nutrient concentrations.
In spring 1999 coastal upwelling was more intense than usual off Baja California (Durazo and Baumgartner 2002). High PP values associated with high Chla concentrations and higher diatom and dinoflagellate abundances were estimated for this season. In summer PP was high in both the northern and central regions, whereas in autumn values were higher than 150 mg C m-2 h-1 for both the coastal and the oceanic zones of the central region (Fig. 4, Table 1). Durazo et al. (2010) detected coastal upwelling in the northern region throughout the year, with higher intensity during spring, while coastal upwelling in the south occurred primarily during spring and summer. Sosa-Ávalos et al. (2005) reported strong northeasterly Santa Ana winds, which can fertilize coastal surface waters by coastal upwelling and vertical mixing (Castro et al. 2003, Trasviña et al. 2003). This eolic contribution can increase PP off Baja California (Fig. 4d, Table 1).
Average PP values were similar to those reported by Smith and Eppley (1982) for the coastal zone off southern California, which were associated with coastal upwelling events. Aguirre-Hernández et al. (2004) and Espinosa-Carreón et al. (2015) reported lower integrated PP values for the region off Baja California in comparison to the values reported in this study, in which PP showed substantial seasonal variability.
The difference between PPm and in situ PP estimates for coastal waters in the northern and central regions during spring was due to the increased abundance in larger phytoplankton cells, which can contribute to variability in photosynthetic parameters. Additionally, the high a
ɸ
(λ) values, observed mainly in the coastal zones, affected the calculations of
The increase in Chla concentration in the coastal zone during spring was associated with coastal upwelling intensity. This zone was considered eutrophic due to the high Chla values, whereas the oceanic zone was considered oligotrophic. Photosynthetic parameters showed seasonal variability in the region off Baja California, with higher α* and ɸ
max
estimates for coastal waters in spring and high
The results show that the average profiles for the photosynthetic parameters off Baja California change seasonally. This variability has important implications in PP estimations if constant values for these parameters are considered during an annual cycle. Therefore, the estimated PP values might not properly represent conditions in the ecosystem. A better option to estimate PP for the region off Baja California is to use remote sensing data and regional averages of the photosynthetic parameters for each season of the year. In general, the values for water-column integrated PP estimated with average (


 nueva página del texto (beta)


