1. Introduction
The accurate determination of surface energy balance components in different terrestrial ecosystems is an essential prerequisite to understanding and modeling the interaction between ecosystems and ambient environments, which are linked with the hydrological cycle, climate change, plant productivity, and carbon budgets (Wilson et al., 2002; Castellvi et al., 2008; Bormann, 2011). Eddy covariance (EC) has been deemed as a preferred method for measuring surface energy flux and balance (Mauder et al., 2007). However, the lack of energy closure is unresolved, and a full guidance on experimental set up and raw data processing for the EC system is still unavailable. Typically, independent measurements of fluxes accounted for 70-90% of measured net radiation, as reported by studies in the last decade (Wilson et al., 2002; Jacobs et al., 2008; Leuning et al., 2012). Generally, the failure in the energy balance closure was attributed to the discrepancy of the source among various flux components; inhomogeneous surface cover and soil characteristics; flux divergence arising from transport that is multi-dimensional; the missed very low and/or high-frequency fluctuations of fluxes; turbulent dispersive fluxes; measurement errors related to the sensor separation; frequency response; alignment problems, and interference from tower or instrument-mounting structures (Cleugh and Roberts, 1994; Foken and Oncley, 1995; Laubach and Teichmann, 1999; Twine et al., 2000; Wilson et al., 2002; Masseroni et al., 2012).
The accurate estimations of surface soil heat flux and phase correction are both important aspects in improving surface energy closure for the results of the EC system. Soil heat flux (G) measured at the soil surface was different than the underlying soil at a specific depth, and surface soil heat flux performed better in energy balance closure (Kustas et al., 2000; Heusinkveld et al., 2004; Russo, 2008; Yao et al., 2008; Masseroni et al., 2014, 2015). Thus, several methods were developed to estimate the surface soil heat flux (G 0) based on soil heat flux measured by heat flux plates (Gs ). The first method is based on the phase delay in soil heat flux and temperature with the change in soil depth, or based on the principle that the amplitude of soil heat flux and temperature decay exponentially with the change in soil depth (van Wijk and de Vries, 1963; Heitman et al., 2010). The second method consists in analyzing ground temperature via the harmonic method with the insertion of heat flux plates at the surface, and calculating the soil thermal conductivity via the approximation method (Heusinkveld et al., 2004). In the third method, soil heat storage (Q), calculated on the basis of soil temperature and moisture data, is integrated with the Gs measured at a specific depth (Gao, 2005; Masseroni et al., 2015). This latter method is the one we have chosen.
Energy balance components and net radiation might vary out of synchronization with the 24-h daily cycle, which led to the systematic energy imbalance. Hence, phase correction was another important practice in improving the surface energy balance closure (Foken et al., 2006; Guo et al., 2008; Leuning et al., 2012; Sun et al., 2013; Wohlfahrt and Widmoser, 2013). Gao et al. (2010) presented a theoretical analysis of the phase difference in diurnal variation of soil surface temperature, soil temperature, soil surface heat flux, soil flux measured by heat flux plates, and soil heat storage, to examine the impact of the phase difference between soil surface heat flux and temperature on the surface energy closure; they concluded that the phase difference in soil surface heat flux vs. net radiation, sensible heat, and latent heat fluxes was an inherent source of soil surface energy imbalance. Guo et al. (2008) concluded that turbulent energy flux with forward phase displacement of about half an hour contributes to the energy balance closure about 1.4%-2.5% in a maize field. Li et al. (2008) reported that latent heat, sensible heat, and soil heat flux were half an hour lagging behind the net radiation in an alpine meadow. The slope of ordinary least squares (OLS) regression increased with a great improvement of 49.1%, from 0.53 to 0.79 after phase shift correction. Leuning et al. (2012) concluded that the sum of eddy fluxes with half-hourly averages of sensible and latent heat was less than the available energy, and a substantial part of this underestimate could be explained by phase lags caused by incorrect estimates of the energy storage in soil, air, and biomass below the measurement height when the multisite data were analyzed.
Several indexes were used for evaluating energy balance closure, including energy balance ratio (EBR), linear regression coefficients (slope and intercept) from the OLS analysis, and energy balance residual (D). The most popular is EBR, which has the advantage of giving an overall evaluation of energy balance closure at longer time scales by averaging over random errors in the half-hourly measurements. A disadvantage of EBR is its potential to overlook biases in the half-hourly data, such as the tendency to overestimate positive fluxes during the day and underestimate negative fluxes at night (Wilson et al., 2002; Hiyama et al., 2007). The linear regression coefficients (slope and intercept) are determined from the OLS relationship between half-hourly estimates of the dependent turbulent flux variables against the independently derived available energy, which is technically valid only if there are no random errors in the independent variable (Li et al., 2005). D is another method for evaluating the degree of energy balance closure. Its advantage is that it could show the degree of energy imbalance at different time points (Cava et al., 2008). However, the value of D cannot reflect the differences in long-term data in energy balance after phase revision.
Paddy fields are one of the typical terrestrial ecosystems in the Asian monsoon region (Alberto et al., 2011), and the surface energy balance components measured in rice ecosystem are different from other crops because they are affected by the presence of water on the ground or the variation of soil moisture content (Tsai et al., 2007; Masseroni et al., 2015). However, most of the large amount of research on energy balance measurement and energy closure calculation has been conducted in ecosystems such as forests, grasslands, wetlands, and upland crop fields (Meyers and Hollinger, 2004; Castellvi et al., 2008; Cava et al., 2008; Oncley et al., 2007; Mauder et al., 2013; Masseroni et al., 2014), and few studies have been conducted in flooded rice paddy ecosystems (Oue, 2005; Castellvi et al., 2006; Tsai et al. 2007). With the increasing water scarcity, water saving irrigation (WSI) techniques were applied to rice paddies (Belder et al., 2004; Kato et al., 2011; Rothenberg et al., 2011; Uphoff et al., 2010), which exposed rice fields to drying-wetting cycles and greatly reduced seepage and evaporation losses (Bouman et al., 2007). In WSI conditions, energy balance in rice fields might be changed, but no results are available on energy balance measurement and energy closure calculation with the EC system in WSI paddy fields (Masseroni et al., 2014).
Thus, energy balance components in WSI paddy fields were measured with an EC system in South China. Three evaluation methods (EBR, D, and OLS regression coefficients) for the post-elaboration of energy balance closure were applied. The characteristics of energy balance fluxes were analyzed and discussed. The effects of soil heat storage and the displacement phase on the energy balance closure were moreover assessed with three evaluation indexes, and the performances of these indexes were discussed simultaneously in different temporal scales.
2. Materials and methods
2.1 Site description
The measurements were conducted using an EC system from July to October 2013, during the rice growth season, in paddy fields at the Kunshan irrigation and drainage experiment station (31º 15' 15" N, 120º 57' 43" E), in the Taihu Lake region of China. The study area has a subtropical monsoon climate, with an average annual temperature of 15.5 ºC, annual precipitation of 1097.1 mm, and annual evaporation of 1365.9 mm. The mean annual relative humidity is 83%, and the annual sunshine time is 2085.9 h. The prevailing winds during the rice cultivation season are south-east trade winds. The experimental site is flat and fetched above 200 m in all directions. The soil is hydragric anthrosol, and the underlying paddy fields were irrigated with a local WSI practice named “controlled irrigation”. In rice fields with controlled irrigation, the shallow flooding water is maintained in the re-greening stage or within 3-5 days after the application of pesticide and fertilizer; irrigation was applied only to saturate the soil without flooding in the rice growth period except the re-greening stage. The lower soil moisture thresholds for control irrigation were 70, 65, 60, 70, 75, 80, and 70% of the saturated soil moisture during the early tillering, middle tillering, later tillering, jointing, booting, earing to sprouting, and milk maturity stages, respectively, consistent with those given by Xu et al. (2012).
2.2 Instruments and measurements
The EC tower (Open Path Eddy Covariance, OPEC) was composed of a Campbell CSAT3A sonic anemometer and an EC150 open-path infrared gas analyzer to measure the sensible heat flux (Hs ) and latent heat flux (LE) with a 10 Hz observation rate. The sensors in the middle of the downwind portion of the field were aligned perpendicularly to the prevailing wind direction (south-east) to reduce flow interference. Net radiation (Rn ) was measured using a CNR4 radiometer (Kipp & Zonen, Holland) at 1.5 m above ground. Soil heat flux (Gs ) was measured using HFP01SC heat flux plates (Campbell Scientific, USA) buried 8 cm beneath the ground. The volumetric water content of the surface soil layer (0.1, 0.2, and 0.3 m) was monitored using three CS616 soil moisture reflectometers (Campbell Scientific), and soil temperature was measured at depths of 0.1, 0.2, and 0.3 m below the soil surface by using three 109 TCAV-averaging soil thermocouple probes (Campbell Scientific). Table I shows the details of specific sensors on the EC system. At the same time, the half-hourly temperature, relative humidity, and precipitation data were recorded by an automatic meteorological station (WS-STD1, DELTA-T, UK) in the experiment station.
2.3 Data processing
EdiRe software was used to process raw EC (10 Hz) data as the covariance between turbulent fluctuations of the vertical wind speed and scalar mixing ratios. These were calculated by averaging the 30-min blocks for quality assurance and quality control of the EC data (Oncley et al., 1993; Finnigan et al., 2003; Foken et al., 2012; Richardson et al., 2012; Mauder et al., 2013; Anderson and Wang, 2014), which included the coordinate rotation via the 2D rotation method (Anthoni et al., 2004), spectral loss correction (Moore, 1986; Masseroni et al., 2013), sonic virtual temperature conversion for sensible heat flux (Mauder et al., 2006), density fluctuations correction for latent heat flux (Ueyama et al., 2012), and spike detection (Vickers and Mahrt, 1997). In the spike detection algorithm, any value that exceeded the mean value ± 3 times the standard deviations was labeled as a spike (Falge et al., 2001a), just as the values measured during the rain period or one hour before and after rain periods (Anderson and Wang, 2014). Moreover, flux data with friction velocity lower than the threshold friction velocity u* (which is equal to 0.1m s−1, according to literature) was filtered out in data analysis to reduce data uncertainty (Massman and Lee, 2002; Li et al., 2005; Anthoni et al., 2004). Data gaps were then filled using linear interpolation for gaps shorter than 3 h and the mean diurnal average method in a window of 10 days for gaps longer than 3 h (Falge et al., 2001b).
2.4 Energy balance equation and soil heat storage calculation
Assuming that the energy converted into chemical energy by green plants and the horizontal flow of energy, caused by advection between the soil surface and the level of the eddy covariance instrumentation, were negligible; then the energy balance equation of a terrestrial surface is simplified as
where net radiation (Rn ), which is the external drive energy of the soil-plant-atmosphere continuum, is balanced by the sum of the latent (LE) and sensible (Hs) heat fluxes to the air, soil heat flux (G), and canopy heat storage in biomass and water content (S). In the current research, S was determined following the suggested procedure, in which S was deduced from a concentration profile method inside the canopy (Papale et al., 2006; Leuning et al., 2012) or based only on concentrations at the tower top (Meyers and Hollinger, 2004). In fact, S was mostly neglected, specifically when the vegetation height was less than 8 m (Wilson et al., 2002). The present study found that S was low and mostly fell in the range of -10 to 10 W m−2, with the concentration profile method that accounted for less than 2% of the available energy during the rice cultivation season (Leuning et al., 2012).
Surface soil heat flux (G 0) was calculated as the sum of soil heat flux at a depth of 8 cm (Gs ), change in energy storage (Q) in the 8 cm soil layer, and change in energy storage in the flooding water (Gw ) in rice fields (Heusinkveld et al., 2004), which can be expressed as:
where G 0 is the heat flux at soil surface (W m−2), Q is the change in soil heat storage in the 8 cm soil layer (W m−2), Gs is the soil heat flux measured at 8 cm depth (W m−2), and Gw is the change in energy storage in the flooding water (W m−2). Assuming that the soil was mostly non-flooded in water-saving irrigation paddy field,Gw is neglected. Q can be determined based on the change in soil temperature (Meyers and Hollinger, 2004; Heitman et al., 2010):
where ∆T is the change in soil temperature (ºC), Csis the heat capacity of the moist soil (J g−1 K−1), d is the soil thickness (cm), and ∆t is the time step, which is equal to 30 min. The air heat capacity is small compared with that of soil and water, and the volume fraction of soil organic matter is negligible; Cs for moist mineral soils was written as (Masseroni et al., 2014; Kustas and Daughtry, 1990)
where ρb is the bulk density (1.35 g cm−3), ρw is the density of water (1.0 g cm−3), Cw is the heat capacity of water (4.190 J kg−1 K−1), and θv is the volumetric soil water content. Cd is the heat capacity of a dry mineral soil, which is 840 J kg−1 K−1 (Hanks and Ashcroft, 1980).
2.5 Energy balance closure analysis
Energy balance closure was evaluated using three different methods. The first method was to derive linear regression coefficients (slope and intercept) from the OLS relationship between the half-hourly estimates of the dependent flux variables (LE + Hs) against the independently derived available energy (Rn - G) (Wohlfahrt and Widmoser, 2013), which can be expressed as:
where a is the slope of linear repression, and b is the intercept of linear repression. The ideal closure is represented by an intercept of zero and the slope of 1.
The second alternative method to evaluate energy closure is the EBR, which was calculated based on the cumulative sum of (Rn - G) and (LE+ Hs) over sepcific time periods (Gu et al., 1999; Wilson et al., 2002).
D is as another method of evaluating the degree of energy balance closure. The energy balance residuals presented in this study are defined as (Wohlfahrt and Widmoser, 2013; Cava et al., 2008):
If the value of D is more than zero, then the surface energy supply is greater than the outlay; otherwise, the result is opposite.
3. Results and discussions
3.1 Energy balance components and energy balance closure
The diurnal variations of monthly averaged energy balance components varied in a unimodal shape (Fig. 1). Usually, the values of Rn , Gs , LE and Hs gradually decreased with decreasing solar radiation from July to October. Compared with Hs and Gs , the diurnal variation amplitude of LE was much greater. The LE flux was the main component of net radiation, and the function of Gs and Hs was relatively low, with a similar amount in the energy balance. Hence, the estimation of evapotranspiration is the most important process in determining the exchanges of energy and mass in a paddy field.
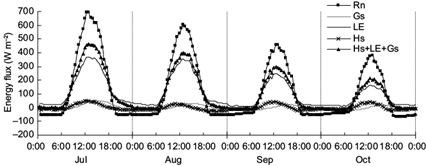
Fig. 1 Monthly averaged diurnal variations of energy balance components during the rice cultivation season.
Ideal energy balance closure can be achieved only when the available energy is equal to the turbulent fluxes. However, the energy balance at the earth’s surface could not be achieved with experimental data since the late 1980s (Mauder et al., 2007; Ochsner et al., 2007; Foken, 2008). In the current research, a gap existed between Rn and the sum of LE, Hs, and Gs . The OLS regression between the half-hourly estimates of the dependent flux variables (LE+ Hs) and the independently derived available energy (Rn - Gs ) is plotted in Figure 2 by using 5616 half-hourly samples. The regression was significant at a 0.1% confidence level, with a slope of 0.57, an intercept of 37.93 W m−2, and a coefficient of determination (R 2) of 0.92. The mean daily EBR (Eq. 6) was calculated as 0.87, ranging from 0.61 to 1.37. Figure 3 shows that most of the daily EBR slightly fluctuated at the stage of earlier growth. During the later stage, daily EBR varied significantly and sometimes it was higher than 1. The half-hourly D data (Eq. 7) ranged from -129 to 260 W m−2 (14.1 W m−2 in average). Figure 1 shows that monthly averaged LE, Hs, and Gs varied diurnally in the same pattern as Rn but with several phase differences. The turbulent fluxes lagged behind Rn about half an hour, and the hysteresis of Gs was more obvious, at about 1.5-2 h, whether the time of peak or the time of curve mutation appeared.
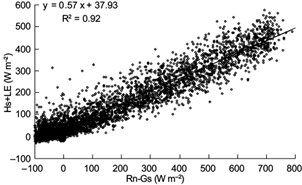
Fig. 2 Linear regression analysis of energy balance characteristics without considering changes in soil heat storage during the rice cultivation season.
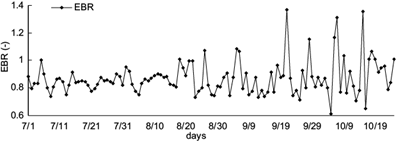
Fig. 3 Variations of the energy balance radio without considering changes in soil heat storage during the rice cultivation season.
The heat stored in the soil between the heat flux plates buried at 8 cm and the soil surface might account for the poor energy closure, as well as the phase shift between the irradiation and the other fluxes. Energy balance components should be measured at the same balance layer when calculating the energy balance. In fact, those energy balance components were measured with different balance layers via diverse methods. Rn was measured at 1.5 m above ground; the turbulent fluxes (Hs + LE) were measured approximately 2.5 m above ground; Gs was measured 8 cm below the soil surface. Moreover, energy transmission from the surface to the heat flux plate through the thickness of the soil takes some time and the heat flux plate measurement of the change also requires a particular response time (Poblete-Echeverría et al., 2014). Hence, it can be concluded that the different balance layers of measurement and the difference in the rate of heat transference have a significant impact on the energy balance closure (Berliner et al., 2004; Oncley et al., 2007).
3.2 Influence of soil heat storage on the energy balance closure
The surface soil heat flux G 0 was calculated by incoporating the soil heat storage on the Gs measured at a depth of 8cm with Eq. (2). G 0 varied from -39.6 to 118.8 W m−2 during the rice growth season (Fig. 4), which was larger than the Gs measured at a depth of 8 cm (-18.8 to 52.6 W m−2). The maximum and average differences were about 66.2 and 46.9 W m−2, respectively. Figure 4 also indicates that a phase shift difference existed between G 0 and Gs . Gs frequently varied at a 0.5-1.5 hours lag behind G 0. This is in good agreement with the results of Masseroni et al. (2015), who found that soil heat flux at the soil surface (G 0) reached daily maximum and minimum values of about 200 and -100 W m−2, respectively, which presented a wider amplitude than soil heat flux without considering soil heat storage (Q) (from -30 to 90 W m−2 in the case of the intermittent irrigation treatment of rice field). In addition, the peak of Gs was phase-lagged 1.5-3 h compared with the peak of Rn . Thus, the change in soil heat storage between the soil surface and the soil heat flux plates buried at 8 cm was not negligible in the energy balance calculation. Qualifying the impact of correction in the value and phase of soil storage flux on the energy balance closure in paddy fields is therefore significant.
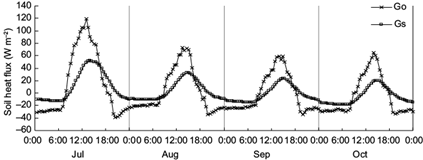
Fig. 4 Monthly averaged diurnal variations of measured soil heat flux at 8 cm depth (Gs ) compared with calculated value at the surface (G 0).
Energy balance closure was evaluated via three different methods, by incorporating the change in soil heat storage. Considering the change in heat storage, the slope and intercept of the OLS regression were 0.62 and 31.28 W m−2, respectively (Fig. 5), which increased by 8.8% in slope and decreased by 17.5% compared with the results in Figure 2. The daily EBR with soil heat storage correction (Fig. 6) varied almost in the same way as described in Figure 3. The daily EBR varied between 0.70 and 1.32, with an average of 0.91, and increased by 5.0%. The half-hourly D ranged from -102 to 194 W m−2, with an average of 12.7 W m−2. Therefore, the change in heat storage between the heat flux plates buried at 8 cm and the surface has a significant impact on the energy balance closure, which should not be neglected in relevant studies (Mauder et al., 2007; Wohlfahrt and Widmoser, 2013).
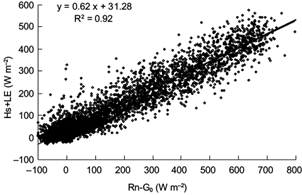
Fig. 5 Linear regression analysis of energy balance characteristics considering changes in soil heat storage during the rice cultivation season.
3.3 The effects of phase displacement on energy balance closure
The impact of phase shift of the observed Hs, LE, and G 0 on the surface energy balance closure was analyzed with three indexes. For the period with net radiation higher than 1, Hs, LE, and G 0 were adjusted by phase correction to allow the daily accumulated maximum value to appear at the same time as the maximum accumulated Rn . The OLS regression between Hs + LE against the available energy (Rn - G 0) with phase shift correction was calculated and plotted in Figure 7. The slope of regression was 0.69, with a significant improvement at a 0.1% confidence level, intercept of 23.14, and R 2 of 0.89l. Compared with the raw data without any correction, the slope of the OLS regression increased by 21.1%. The mean daily EBR was also calculated as 0.91 and varied in the same pattern as Figure 6. The value of half-hourly D ranged from −61 to 176 W m−2. Compared with the results of the soil heat storage correction but without phase shift correction, the slope of regression increased by 11.3%, however, the daily EBR (0.91) and daily D (12.7 W m−2) were the same. Therefore, these statistical indexes had different results in the evaluation of the performance of phase shift correction in the daily energy balance closure.
3.4 Comparison and analysis of energy balance closure in different temporal scales
The daily EBR and daily averaged D calculated at a daily scale were not suitable for evaluating the performance improvement of the phase correction. Diurnal variations of half-hourly EBR and half-hourly D were calculated and plotted in Figures 8 and 9 to analyze the effect of phase displacement on the energy balance closure in a half-hourly temporal scale.
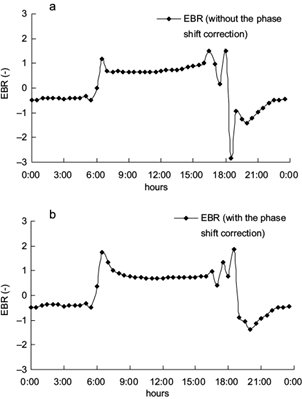
Fig. 8 Diurnal variation of EBR during the rice cultivation season, 2013. (a) Without phase shift correction. (b) With phase shift correction.
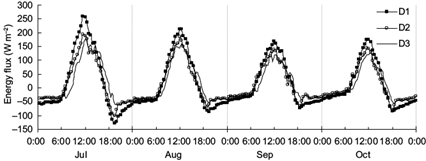
Fig. 9 Monthly averaged diurnal variations of D1 , D2 and D3 during the rice cultivation season in 2013. D1 is the energy balance residual without any correction, D2 is the energy balance residual without the forward phase shift but considering the change in soil heat storage, and D3 is the energy balance residual considering the change in soil heat storage as well as the forward phase shift.
Figure 8 indicates that the half-hourly EBR was negative during nighttime and positive during daytime. Comparing the two figures, there was a general increase in the half-hourly EBR from sunrise to noon after phase shift correction but it appeared almost identical in the afternoon with a value of about 1 around 16:00. This phenomenon might be explained by the continuous increase in air and soil temperature with the increase in net radiation during the morning; hence, energy transmission from net radiation to other energy fluxes was expended at some time. Temperature was relatively stable in the afternoon; therefore, the energy balance ratio was high (close to 1) with good atmospheric stability. The EBR drastically changed during the morning and evening transition periods, both before and after the phase shift correction, mainly because the temperature changed quickly and the atmospheric turbulent exchange was not stable neither above nor beneath the canopy during these two periods. The high velocity of vertical exchange in the stratosphere exceeded the normal range of variation. Thus, capturing the variable data at a frequency of 10 Hz with high accuracy was difficult for EC systems. Furthermore, the value of EBR was negative in the night regardless of whether the phase shift correction was performed or not, which meant that the turbulent energy fluxes were positive and much higher than the available energy. The methods of half-hourly EBR were unavailable for the evaluation of the energy balance closure during nighttime. The degree of energy balance closure was calculated, but the nighttime data was excluded. The EBR that involved the use of daytime data sets was smaller than daily EBR with the whole-day observation data, regardless of whether phase shift correction was performed, and the result was consistent with those of Leuning et al. (2012). The energy entering the soil, air, and biomass during the daytime was returned partly during nighttime, hence, the energy distribution and conversion of the paddy field presented a specific compensation effect during the day and night. Whole-day observations were numerous and comprehensive, which meant that energy transmission was a continuous process, and that research regarding energy components needs also to be spatially and temporally continuous.
The monthly averaged value of half-hourly D varied in the unimodel curve (Fig. 9). During transition periods at morning or evening, Rn was as low as zero, and D was almost zero. Besides those two transition periods, D was always positive in daytime and negative during nighttime. The half-hourly energy balance residual was calculated (i) without any correction (D1 ), (ii) only considering the change in soil heat storage (D2 ), and (iii) considering both change in soil heat storage and phase correction (D3 ). Figure 9 indicates that the absolute value of D3 was significantly less than D2 and D2 during the period from 7:00 to 12:30 as well as during nighttime, but more or less than D2 and D1 from 12:30 to 17:00. The absolute value of D2 was smaller than D1 throughout the whole period, which meant that the correction of soil heat storage improved the energy balance closure in whole day periods, and the correction of phase shift improved the energy balance closure during the heating period from sunset to noon, which is the same as the results from half-hourly EBR. The two half-hourly indexes indicated that the hysteresis of energy conversion occurred mainly during the morning, and the synchronization of energy components improved with increasing net radiation. The results of this study show that with the use of net radiation peak time we could infer the delaying time periods of energy components and correct the phase shift according to different periods.
This analysis showed that the effect of phase shift correction was reflected in the whole-day process. Thus, correction was also a significant method to improve the surface energy balance closure at half-hourly scale with the indexes of OLS regression, diurnal variations of half-hourly EBR, and half-hourly D, even though the daily accumulation values of half-hourly data were the same with and without phase shift correction. The correction methods of soil heat storage and phase displacement are different in principle and action, which means both are useful to improve the surface energy balance closure in different temporal scales with a proper evaluation index.
Aside from the two temporal scales, further analysis of EBR in this paddy field found that the value of daily EBR (0.91) was greater than the growth-stage EBR (0.88) with the two corrections, and no significant effect existed for the degree of growth-stage energy balance closure with and without the two corrections. Thus, it is reasonable to conclude that the greater imbalance in growth-stage scale was caused by the following reasons:
1. he sampling problems, i.e., the footprint area of EC measurements may not match with the source area of net radiometer and soil heat flux measurements. With the rice development over the whole growing stage, the height difference between the canopy and the sensors height greatly varied, which may cause the footprint area to be beyond the boundary of the EC field; consequently, lack of energy balance closure may occur.
2. Neglecting other energy sinks, such as canopy heat storage, biochemical energy storage transformed by photosynthesis, energy transforming in the meteorological process, and energy exchange arising from advection may also lead to the more obvious lack of energy balance closure in the growth-stage scale. Thus, more attention should be given to further observations and research on these aspects.
4. Conclusions
The EC technique was used to measure energy fluxes over a water-saving irrigation paddy field in the South China Plain for the rice growth stage in 2013. The diurnal variations of monthly averaged energy balance components varied in a unimodel shape, however the value and phase gaps ranged between Rn and the sum of LE, Hs, and Gs . The accuracy of the soil heat storage term estimation has a crucial role on the improvement of energy balance closure. Considering the heat storage between the heat flux plates buried at 8 cm and the surface, the OLS slope for the half-hourly data set increased by an average of 8.8%, and the daily EBR increased by 5.0%. The range of half-hourly D over the whole growth stage decreased from -129-260 W m−2 to -102-194 W m−2, and the absolute value decreased by 9.9%. The phase shift correction was also a significant method to improve the surface energy balance closure at a half-hourly scale. Compared to the results with change of soil heat storage but without phase shift correction, the OLS regression slope increased by 11.3%, and the half-hourly D diminished, ranging from -61 to 176 W m−2, even though the daily EBR and D were the same. Moreover, both half-hourly EBR and D indicated that the hysteresis of energy conversion occurred mainly during the morning. Thus, the indexes of OLS, EBR, and D, with different principle and action, had different applications and variation degrees of response to the correction of energy balance closure in different temporal scales.
The results of this paper have general application in the correction of energy balance deficits. WSI is a promising water-saving technology being developed to lower water requirements of rice fields, in order to address issues of water scarcity; it has been popularized and applied in large areas, especially in Southeast Asia (e.g., China, South Korea and the Philippines). Thus, the soil heat storage and phase shift correction proposed in this research are necessary for the accurate estimation of evapotranspiration in WSI rice fields. In addition, our results are useful for understanding the applicability of evaluation indexes and the process of water and energy flux exchange at different temporal scales under a WSI practice, which provides an essential support for further development of the WSI theory and technology. More attention should be given to future research on additional causes of the energy balance deficit (e.g. sampling problems and neglecting other energy sinks, and long-term continuous measurement using the EC system is needed to establish a coupled model of water and energy flux in future studies.


 nueva página del texto (beta)


