Introduction
Steam injection as an enhanced oil recovery (EOR) method for heavy and extra heavy oil involves several challenges. One of them is handling the H2S produced by the rupture of C-S bonds at high temperatures and pressures (greater than 200 ºC and 1000 psig) prevailing at the bottom of the well. This process, known as aqua-thermolysis (Husein et al., 2010), generates H2S and other pollutants such as CO2, which poses risks to the health of workers, the environment, the facilities, and the surface equipment that transports the crude from the well to the separation and treatment units. The H2S concentration can exceed 3,000 ppm, depending on the reservoir and the characteristics of the crude (Zhu et al., 2010). In the specific case of developments in the Orinoco Oil Belt, Venezuela, this has prompted the development of previous H2S production and management studies (Mi et al., 2017).
The removal of H2S has been extensively studied and there are mature technologies for treatment and conversion to elemental sulphur downstream of oil production. Reversible processes based on liquid sorbents use mainly mono-, di- and tri-ethanolamines (MEA, DEA, TEA), while non-reversible technologies based on solid sorbents employ metal oxides. The first developments in H2S scavenging with metallic oxides were based on copper compounds added to water-based drilling muds, which caused the precipitation of H2S as insoluble copper sulphide; however, their use is seriously limited by corrosion problems that they cause in ferrous materials. As an alternative, the use of zinc oxide and zinc carbonate also showed good performance over a wide pH range, but high zinc ion concentrations are required to achieve high removal efficiency, and this affects the rheological properties of the drilling mud, so its use is limited. Iron compounds such as magnetite and ferrous gluconate could offer better performance at low pH values (Amosa et al., 2010).
Using iron oxide nanoparticles for in situ H2S removal offers an alternative to mitigate H2S production. The reaction process does not generate by-products, and, because of the large specific surface area of the nanoparticles, they can be used at low concentrations and there is no need to recover them (Martínez and Bastidas, 2017). Although zinc oxide in drilling fluids reacts faster than iron oxide, the latter yields higher amount of H2S removed per unit mass, especially at lower pH values (Evers and Olson, 1983). However, since the rate of diffusion of H2S in heavy oil is very low, a poor distribution of the iron oxide in the crude oil would decrease the probability of collisions between H2S molecules and nanoparticles during oil production. For this reason, it is important to achieve good dispersion of the nanoparticles, to avoid possible limitations on the process efficiency because of the diffusion velocity of H2S in the oil (Nassar et al., 2010).
The present work involves assess the removal of H2S in heavy crude oils by using iron oxide nanoparticles injected downhole. The H2S reacts with nanoparticles in such a way that they form stable compounds, which safely, during the entire process of transporting crude oil to the processing plants can handled.
Preparation of nanoparticles
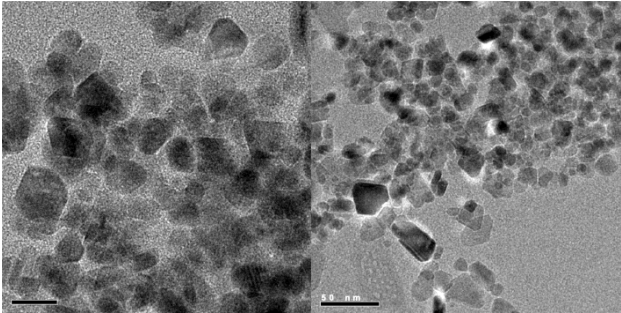
Nanoparticles were synthesised using a procedure described by Capek (2004) and Martínez & Bastidas (2017). A microemulsion was prepared in a batch reactor using a mixture of aromatic solvents, a metal precursor salt was added to it, and the reaction temperature was adjusted between 200 and 280 ºC for 24 h. The nanoparticles obtained by this process had sizes less than 100 nm and were characterized by high-resolution transmission electron microscopy (HRTEM). Figure 1 shows an HRTEM image of the nanoparticle solution. Variable sizes below 20 nm were observed.
Source: Author’s elaboration.
Figure 1 Transmission electron microscopy (MET AR) high resolution of nanoparticles.
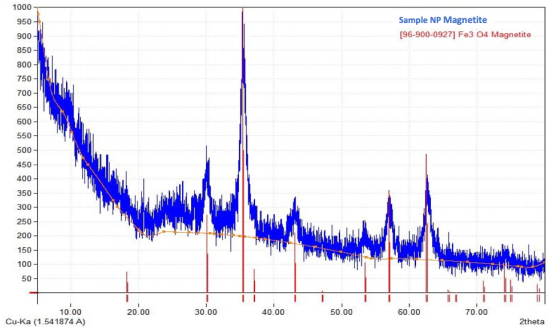
An X-ray diffraction analysis (XRD) was carried out to determine the crystallographic structure of the nanoparticles. The diffraction pattern obtained was compared with the database associated with the Match application in its free version (International Centre for Diffraction Data, 2023), which uses the ICDD database for XRD of powders, so that it was possible to corroborate the coincidence of the lines of highest intensity with the pattern reported with #96-900-0927 corresponding to a cubic Magnetite (Fe3O4), the coincidence of lines was 100%, thus indicating that there is a pure phase of the solid (Figure 2). The signal’s low intensity and bandwidth indicate the presence of highly dispersed nanometric particles in the reaction medium. These results are consistent with the shown by HRTEM analysis where particle sizes between 20-50 nm were achieved (Figure 1).
Source: https://www.crystalimpact.com/news/20231010a.htm.
Figure 2 Diffractogram DRX of nanoparticles sample.
Diffusion tests
A stainless steel PVT cell was manufactured with a height of 10 cm and an internal diameter of 4.5 cm. Pure H2S and 8.5ºAPI heavy oil were used. The cell was placed in vertical position and tests were carried out at four different temperatures (40, 50, 60, and 70 ºC). The temperature remained constant throughout the test.
The diffusion coefficient of the dissolved H2S was inferred by an indirect method proposed by Riazi (1996). This involved monitoring the pressure decrease of the gas, which depends on the rate of mass transfer across the gas-liquid interface. Assuming the validity of the penetration model for unsteady-state one-dimensional diffusion in a liquid region of finite constant depth, Fick’s second law is written as:
With initial and boundary conditions:
Where 0 ≤ z ≤ z0 is the liquid height, cA is the molar concentration of the dissolved gas, cA,sat is its composition at saturation (solubility), and DAm is its effective diffusivity in the liquid at the cell temperature T and pressure P.
In principle, the height z0 of the liquid phase could increase as the gas dissolves, because its total mass goes up and its density goes down (swelling effect). However, the solubility of H2S in heavy crude oil is low, therefore this effect was considered negligible in the present case. The solution of Eq (1) subject to Eq (2) is well known, e.g. Crank (1975). Of particular interest is the composition gradient at the interface, given by
The pressure change in the gas phase follows from a molar balance (Zhang et al., 2000) as
where h is the height of the gas space above the liquid, Z is the gas compressibility factor, and A is the cell cross-sectional area, all of which are taken to be constant. At sufficiently long times, the series in Eq (3) can be approximated by its leading term, and integration of Eq (4) from such large values of t up to infinity yields
Which has the form: f(t) = A + Bt.
Given the liquid height z0 in the cell, the diffusion coefficient can thus be determined from the end slope of the line obtained by plotting the experimental pressure data against time according to Eq (5). No detailed knowledge of the parameters that make up the intercept A is necessary. The saturation pressure Psat must be known, however, but this is the limiting pressure observed at equilibrium after appropriately long run times (4 days in the present work.) The slope of the curve is sensitive to small changes in the saturation pressure (Zhang et al., 2000), so measurements should be replicated whenever possible.
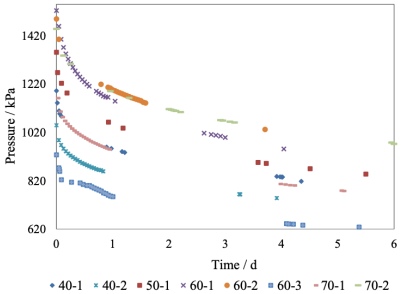
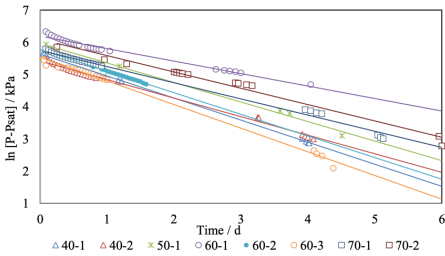
Shown in Figure 3 is the pressure behaviour versus time. Eight tests were carried out at 40, 50, 60, and 70 ºC. Initially, when the gas and the oil come into contact, the pressure drops rapidly, about a quarter or a third of the overall change. This is known as the “incubation period”, and was observed during the first 30 to 60 min, time necessary for H2S to dissolve at the gas/liquid interface, establish the boundary condition, and diffuse down to create the composition profile over the entire liquid depth. The slope of the curve described in Eq (5) should remain linear until H2S reaches the opposite end of the PVT cell. The truncated form of Eq (3) cannot described the high curvature in these early stages, and is as well visible in the linearized coordinates of Eq (5), as shown in Figure 4. Points in the incubation period were therefore omitted from the statistical analysis of the data. Pomeroy et al. (1933) showed that this assumption is reasonable and introduces negligible uncertainties in the interpretation of the data.
Source: Author’s elaboration.
Figure 3 Gas pressure as a function of time. Diffusion tests at 40, 50, 60 and 70 °C.
Source: Author’s elaboration.
Figure 4 Linear fit of pressure data as a function of time (for 40, 50, 60 and 70 °C).
The data in the incubation period could possibly be analysed by an alternative “penetration” model, that treats the liquid phase as an infinitely deep pool, but this was unnecessary because the diffusivity of H2S in the crude oil could be obtained directly from the linear regression, as described in the literature cited and confirmed in our work. Least squares regression using the MATLAB® tool yielded linear fits with regression coefficients better than 0.980. The initial and final pressures, and the computed diffusion coefficients are listed in Table 1. The pressure change was 426 kPa on average. Mean diffusivities vary between 8.3 × 10⁻⁹ and 8.9 × 10⁻⁹ m2s-1 from 40 to 70 ºC, with a low outlier from a single run at 50 ºC. These values are consistent with those reported for the diffusivity of other gases in heavy oil fractions, e.g. CO2 (Upreti and Mehrotra, 2000) and CO, CH4, C2H6, N2 (Upreti and Mehrotra, 2002).
Table 1 H2S-oil diffusion coefficient as a function of temperature
| Test run | T / °C | P(t = 0) / kPa | Psat / Pka | 109 DAm / m2 s-1 | 109 DAm,ave / m2 s-1 |
|---|---|---|---|---|---|
| 40-1 40-2 |
40 | 1192 1048 |
818 745 |
7.90 8.71 |
8.31 |
| 50-1 | 50 | 1351 | 848 | 7.35 | 7.35 |
| 60-1 60-2 60-3 |
60 | 1524 1489 927.3 |
952 1032 628.5 |
8.17 8.89 8.51 |
8.52 |
| 70-1 70-2 |
70 | 1162 1448 |
778 972 |
8.78 8.94 |
8.86 |
Source: Author’s elaboration.
H2S removal tests
Three stages make up the H2S mitigation test: 1) conditions for maximum H2S production; 2) optimal concentration of nanoparticles, and, 3) quantification of H2S removal.
Maximum H2 S production
The main source of H2S production in EOR of oil fields is thermochemical sulphate reduction (TSR) at the high temperatures reached. The amount of H2S generated depends on the oil contents of sulphur compounds, injection temperature, and rock composition and physicochemical properties (Mi et al., 2017). Tests were carried out in four autoclaves of 600 mL internal volume, each charged with 90 g of heavy oil, 10 g of water and 150 psig (1136 kPa) of 99.9 vol% methane. They heated up to 250, 280, 300, and 320 ºC, respectively, and kept isothermal during a reaction time of 15 h, after which gas samples were drawn and analysed for H2S concentration. A considerable increase in H2S evolution was detected, from less than 100 ppm at 280 ºC to 1200 ppm at 300 ºC, and slightly above 10,000 ppm at 320 ºC (Figure 5). These values are consistent with previous reports by Mi et al. (2017) for the same crude, and may serve as a guideline for setting the steam injection temperature in an EOR process if excessive downhole H2S production avoided.
Optimal nanoparticle concentration
In order to determine the optimal concentration of nanoparticles, four autoclaves of 600 mL internal volume were each charged with 90 g heavy oil, 10 g water, 150 psig (1136 kPa) of 99.9 vol% methane, and zero (control blank), 250, 500 and 1000 ppm of nanoparticles, respectively. All tests carried out in duplicate, and, once completed, gas samples for total sulphur analysis using the ASTM D2622 standard were drawn. The gas chromatographic analysis followed the UOP 539-12 standard, and H2S concentration was measured using sulphide colorimetric detector tubes. The reacted nanoparticles were extracted by washing with toluene and subjected to centrifugation to be analysed by electron microscopy.
Figure 6 shows the production of H2S for the four samples and the percentages of gas removed, which were 77.2, 92.6 and 88.2 % for the respective samples containing 250, 500 and 1000 ppm of iron oxide nanoparticles. Although this last result is not conclusive, due to the few tests carried out, an agglomeration of the nanoparticles may have occurred at the higher concentration, thereby decreasing the contact area and, consequently, the removal of H2S. On the basis of these results, it was decided to use only 500 ppm of nanoparticles in the subsequent removal tests, to be performed at 300 ºC with reaction times up to 160 h.
H2S removal
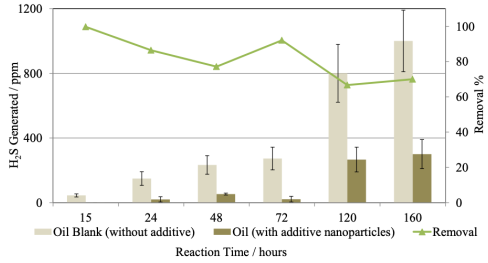
Figure 7 exhibits the H2S generated with nanoparticles (“additive”) and without them. The H2S generated without additive increased from 40 to 1000 ppm for reaction times from 15 to 160 h. In the same way, the removal rate with additive, the decrease from 99.8 % to about 70 %, with some dispersion, but in any case, exceeding 65 %.
Source: Author’s elaboration.
Figure 7 Generation and percent removal of H2S as a function of reaction time.
When chromatographic analysis of the reaction gases was made -tests at 15, 48 and 72 h-, the iron oxide additive works not only as an agent for removing H2S molecules, but also promotes the production of light compounds. Composites such as propane, propylene, butane, pentane and hydrogen, which indicates that there was cracking of the oil samples and, possibly, an improvement in their viscosity (Table 2).
Table 2 Chromatographic composition of reaction gas.
| GAS | 15 hours | 48 hours | 72 hours | |||
|---|---|---|---|---|---|---|
| Without nanoparticles | With nanoparticles | Without nanoparticles | With nanoparticles | Without nanoparticles | Without nanoparticless | |
| C6+ | 0.0 | 0.024 | 0.0 | 0.0004 | 0.0 | 0.059 |
| Methane | 92.27 | 93.80 | 95.21 | 96.56 | 94.25 | 76.27 |
| Ethane | 0.0 | 0.0 | 0.0 | 0.0 | 0.0 | 7.65 |
| Ethylene | 0.0 | 0.045 | 0.0 | 0.00 | 0.0 | 0.0 |
| Propane | 0.0 | 0.294 | 0.0 | 0.009 | 0.0 | 3.71 |
| Propylene | 0.0 | 0.079 | 0.0 | 0.0 | 0.0 | 0.02 |
| I-Butane | 0.0 | 0.041 | 0.0 | 0.0 | 0.0 | 0.52 |
| N-Butane | 0.0 | 0.0 | 0.0 | 0.005 | 0.0 | 0.77 |
| Propadiene | 0.0 | 0.0 | 0.0 | 0.0 | 0.0 | 0.0 |
| Acetylene | 0.0 | 0.0 | 0.0 | 0.0 | 0.0 | 0.0 |
| TR2-Butene | 0.0 | 0.012 | 0.0 | 0.0 | 0.0 | 0.005 |
| 1-Butene | 0.0 | 0.022 | 0.0 | 0.0 | 0.0 | 0.0 |
| I-Butene | 0.0 | 0.046 | 0.0 | 0.0 | 0.0 | 0.0 |
| CS-2-Butene | 0.0 | 0.008 | 0.0 | 0.0 | 0.0 | 0.0 |
| I-Pentane | 0.0 | 0.033 | 0.0 | 0.0 | 0.0 | 0.18 |
| N-Pentane | 0.0 | 0.042 | 0.0 | 0.0 | 0.0 | 0.15 |
| 13-Butadiene | 0.0 | 0.000 | 0.0 | 0.0 | 0.0 | 0.0 |
| 3-ME-1-Butene | 0.0 | 0.000 | 0.0 | 0.0 | 0.0 | 0.0 |
| TR-2-Pentene | 0.0 | 0.000 | 0.0 | 0.0 | 0.0 | 0.0 |
| 2-ME-2-Butene | 0.0 | 0.000 | 0.0 | 0.0 | 0.0 | 0.0 |
| 1-Pentene | 0.0 | 0.008 | 0.0 | 0.0 | 0.0 | 0.0 |
| 2-ME-1-Butene | 0.0 | 0.009 | 0.0 | 0.0 | 0.0 | 0.0 |
| CS-Pentene | 0.0 | 0.000 | 0.0 | 0.0 | 0.0 | 0.0 |
| CO2 | 0.0 | 0.018 | 0.0 | 0.0 | 0.0 | 0.37 |
| Oxygen/ar | 2.63 | 2.053 | 0.39 | 2.08 | 0.34 | 1.93 |
| Nitrogen | 5.09 | 2.87 | 3.86 | 1.26 | 4.99 | 4.47 |
| Hydrogen | 0.00 | 0.60 | 0.54 | 0.09 | 0.42 | 3.91 |
| Total | 100.0 | 100.0 | 100.0 | 100.0 | 100.0 | 100.0 |
Source: Author’s elaboration.
Samples taken from the reacted oil and analysed for total sulphur contents, confirmed a reduction in sulphur percentage by comparison with the unreacted crude. As shown in Figure 8, this decrease was greater for the blank samples than for those with additive, but this is just because the H2S generated during the aqua-thermolysis process diffuses into the oil, where it reacts with the iron oxide present to form stable iron sulphide species that are subsequently quantified in the total sulphur analysis.
Finally, the nanoparticles sampled and analysed by scanning electron microscopy (SEM), which showed particle sizes between 0.1 and 1 µm. Their elemental composition was determined by microanalysis using energy dispersion X-ray (EDX) spectroscopy. As expected, the unreacted nanoparticles were mostly composed of oxygen and iron, while the amount of sulphur in the reacted solid increased with time from 7.35 to 13.08 %, which confirms that H2S diffuses into the oil and reacts with the iron oxide nanoparticles (Table 3)
Table 3 Microanalysis of nanoparticles by X-ray dispersion spectroscopy of energy (EDX).
| Element | Nanoparticles without reaction | Reacted nanoparticles | ||||||
|---|---|---|---|---|---|---|---|---|
| 48 hours | 72 hours | 120 hours | ||||||
| weight% | atomic% | weight% | atomic% | weight% | atomic% | weight% | atomic% | |
| O | 50.81 | 78.42 | 33.3 | 58.77 | 43.34 | 66.65 | 27.17 | 11.77 |
| Na | 0 | 0 | 3.91 | 4.81 | 6.76 | 7.24 | 9.3 | 11.84 |
| Si | 0 | 0 | 0.92 | 0.93 | 0 | 0 | 0 | 0 |
| S | 0 | 0 | 7.35 | 6.47 | 7.94 | 6.09 | 13.08 | 11.84 |
| CL | 0 | 0 | 4.00 | 3.18 | 2.79 | 1.93 | 3.03 | 2.49 |
| K | 0 | 0 | 0.51 | 0.37 | 0.59 | 0.37 | 0 | 0 |
| Ca | 0 | 0 | 1.63 | 1.15 | 0 | 4.55 | 3.31 | |
| Cr | 0 | 0 | 1.52 | 0.82 | 0.96 | 0.46 | 0 | 0 |
| Fe | 46.34 | 20.49 | 42.59 | 21.53 | 27.46 | 12.1 | 24.99 | 13.03 |
| Ni | 0 | 0 | 2.55 | 1.23 | 5.99 | 2.51 | 1.67 | 0.83 |
| Zn | 1.42 | 0.54 | 1.71 | 0.74 | 2.45 | 0.92 | 3.32 | 1.52 |
| Cu | 1.43 | 0.55 | 0 | 0 | 0 | 0 | 12.94 | 5.76 |
| Mg | 0 | 0 | 0 | 0 | 1.71 | 1.73 | 0 | 0 |
Source: Author’s elaboration
Conclusions
The use of iron oxide nanoparticles proved to be effective for in situ scavenging of H2S produced by aqua-thermolysis at simulated downhole conditions. At a concentration of 500 ppm, the nanoparticles yielded over 65% reduction of the H2S generated, with bonus formation of lighter compounds by cracking long hydrocarbon chains, as evidenced by the presence of alkenes and hydrogen, which may promote a reduction in oil viscosity. Higher concentrations were not used because they appeared to be less effective, possibly due to particle agglomeration, but might be practicable if good dispersion of the nanoparticles in the crude oil can be achieved in industrial practice. This may be desirable since the percent recovery tended to be lower at high rates of H2S production, which might indicate a limited capacity for reaction yield at the amount of nanoparticles used in this work. Steam injection temperatures in enhanced oil recovery (EOR) processes must not exceed 280 ºC to avoid a high production of H2S.
As part of this study, the diffusion coefficient of H2S in crude oil was found to range from 8.3 ×10⁻⁹ to 8.9 ×10⁻⁹ m2s-1 between 40 and 70 ºC. To the best of our knowledge, these are the first reported values for the diffusivity of this gas in a heavy oil. Finally, as irrefutable proof, the analysis of electron microscopy confirms that H2S diffuses into the oil and reacts with the iron oxide nanoparticles, demonstrating their enormous potential to be used downhole during enhanced oil recovery (EOR).
List of symbols
A |
cell cross sectional area, m2 |
cA |
dissolved gas concentration, mol/m3 |
cA,sat |
gas solubility, mol/m3 |
DAm |
diffusion coefficient, m2/s |
h |
height of gas space, m |
P |
pressure, kPa |
Psat |
saturation pressure, kPa |
R |
universal gas constant, (kPa.m3)/(mol.K) |
t |
time, s, h or d |
T |
temperature, K |
z |
vertical coordinate, m |
Z |
gas compressibility factor, - |
z0 |
height of liquid space, m |


 nueva página del texto (beta)


