Introduction
1. Importance of the Tambora 1815 Eruption in the History of Volcanology
Many volcanic calderas of different sizes and ages can be identified on Earth. However, their origins and structures may be different. It is thus important to determine the “caldera type” to define models that explains their formations, particularly for those resulting from major explosive eruptions. Calderas formed in the historical timescale are particularly important to understand and explain their complex structures, especially of those with large diameters. There are three explosive eruption calderas formed in historical times: Tambora in 1815; Krakatau in 1883; Novarupta in 1912. Their features have been discussed by Yokoyama (2016). From those, Tambora is the largest in diameter and ejecta volume. The caldera width could have been even larger than the present 6.7 km, but the power of the eruption was probably not sufficient to remove most of the original volcanic edifice overlaying the basement, a very large shield volcano. Moreover, no known calderas elsewhere formed by a single explosion exceed the dimensions of Tambora. Two important features of the Tambora Caldera formation eruption are discussed in the next.
2. The Tambora Caldera was Formed in a Single Eruption in 1815 and no Further Explosive Eruptions have Occurred.
It was reported that about 3 years before 1815, a dense cloud was observed near the summit of Tambora Volcano on Sumbawa Island (Fig. 1). Later, on 5 April 1815, thundering explosions were heard as far as Batavia (1250 km away). On 10 and 11 April, the eruption reached its paroxysm, and strong earthquakes were felt through the island of Java. On the night of 10 April, a small tsunami was observed at Sangar (Fig. 1). The activity after the caldera formation has remained at a low level within the summit caldera as described below. The distribution of the fallout deposits from the paroxysm is shown in Fig. 1. However, a large volume of marine deposits resulted from massive pyroclastic flows. The volume estimations from marine deposits are imprecise and should be carefully reprised.
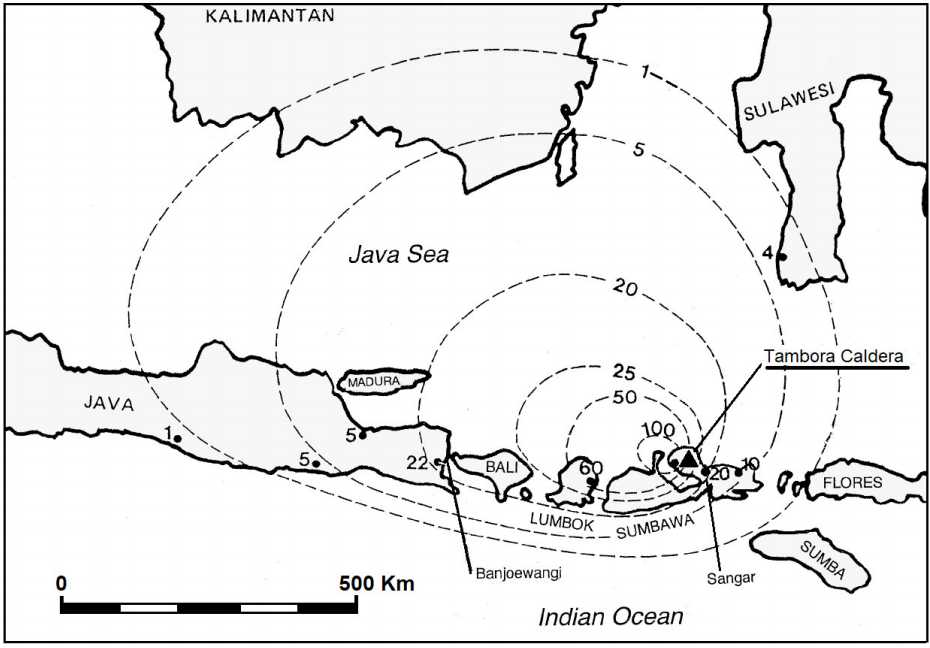
Figure 1 Location of Sumbawa Island and Tambora Volcano. Isopachs of tephra fallout in cm (after Self et al. 1984, and Sigurdsson and Carey, 1989)
There are no reports of volcano-related topographic deformations around the 1815 eruptions of Tambora despite its short distance to the sea, which is a suitable reference for leveling. This probably resulted from the lack of adequate measuring devices in the region and the confusion in the area at that time, otherwise, the depth of the magma reservoir could have been estimated. According to Petroeschevsky (1949) and Sigurdsson and Carey (1989), in addition to the heard explosions, earthquakes related to the eruption were felt at distances between 400 and 600 km from the volcano. According to Gutenberg and Richter (1956), the maximum distance of seismic perceptibility R (km) is related to the local magnitude ML as:
Then, we get a possible M L magnitude for the largest Tambora earthquake in the range of 6.8 to 7 (Yokoyama, 2001). Such large earthquakes may have not been caused only by volcanic eruptions but may have been also related to tectonic movements in some areas around Tambora Volcano. During the 1883 eruption of Krakatau in the Sunda Straits, the second largest eruption in historic time after the Tambora eruption, there are no reports of such large earthquakes. This fact also points to the large magnitude of the Tambora eruption.
After the 1815 eruption of Tambora Volcano, several pioneering geologists such as Zollinger (1855) studied this eruption. Afterward, Tambora Volcano has produced only minor activity within the caldera, such as an outflow of lavas (0.002 km3 in volume) from Doro Api Toi (DAT in Fig. 2), reported by Kusumandinata (1979). In 1947, Petroeschevsky (1949) carried out field studies within the caldera and reported that the lava flows were about 60 m high and 350 m long and were issued from a small parasitic scoria cone about 100 m high, formed within the caldera around 1880.
1.3 The Large Volume Ejected by the 1815 Tambora Eruption
For 19th century volcanologists, volume estimation of the Tambora eruption ejecta was an important issue, and fieldwork was possible after the eruptions. Zollinger (1855) estimated the bulk volume of ejecta as 1050 km3 and later Petroeschevsky (1949) at 100 km3. Afterward, Self et al. (1984) estimated the bulk volume at 150 km3 and reappraised that value in Self et al. (2004) at 100 km3. Those modern studies involve a “dense rock equivalent” (DRE) volume in the range of 30 to 50 km3. More recently Kandlbauer and Sparks (2014) reported the most likely volume of ash falls and pyroclastic flows as 41 ± 4 km3 DRE. One of the reasons for the wide range of the ejected volume estimations is the location of the volcano in a narrow peninsula surrounded by the sea. Here, we adopt the most recent estimate of Kandlbauer and Sparks, this is, 41 km3 DRE. A sphere of that volume has a diameter of about 4.3 km. This value may be roughly the diameter of an assumptive spherical magma reservoir. In contrast, for the 1883 Krakatau eruption, Williams (1941) reported 18 km3 DRE of pyroclastic material ejected, including 5 % of old lava fragments.
Lately, Yokoyama (2014) revisited the Krakatau caldera deposits and discussed the negative gravity anomalies in the caldera previously observed by Yokoyama and Hadikusumo (1969) and later surveyed extensively by Deplus et al. (1995). Yokoyama (2014) graphically obtained the mass anomaly (deficiency) at the Krakatau caldera as 2 ± 0.5 × 10¹² Kg from the observed gravity anomaly using a density contrast between the basement and the marine deposits of 150 kg/m3, after considering various possible conditions of dry and underwater volcanic deposits and applying the Gauss's theorem. The bulk volume was calculated as the ratio of the mass anomaly to the density contrast: 2 ± 0.5 × 10¹² Kg/150 kg/m3 = 13 ± 3 km3 (DRE).
As mentioned above, the deposit volume of Tambora Caldera has been estimated at 41 ± 4 km3 DRE which is about 3 times as large as the volume ejected by the 1883 Krakatau eruption. However, it is important to remark that both Tambora and Krakatau volcanoes are located near or surrounded by the sea, and estimations of the ejected volumes are technically difficult and subject to future reappraisals.
Dynamics of the Formation of Cone-Sheets and Caldron Subsidence
Volcanic edifices are usually composed of lavas and pyroclastic deposits. Such rocks, commonly have a low shear to compressive strengths ratio, thus breaking more easily under shear stress than under compressive or tensile stresses. This may explain the shape of some volcanic structures. Among the first to address this problem was Anderson (1936, 1937) who discussed "the dynamics of the formation of cone-sheets, ring-dykes, and caldron-subsidence". Some results of his discussion on the stress field caused by a point dilatation in an elastic medium with a free surface are reproduced in Fig. 3 (Fig. 8 in Anderson, 1936). He showed that opening fractures causing cone-sheet intrusions would follow the fine solid lines in the diagram, stressing the importance of shear fracturing. Afterward, and based on the theory of maximum shearing stress, it was found that the maximum shear stress in such configuration is equal to half the horizontal differential stress and that the shear stress has extreme values at r = ± 0.82 D, where r denotes the horizontal radial distance from the pressure source center and D its depth (De la Cruz-Reyna and Yokoyama 2011; Yokoyama 2013, 2014). In other words, the maximum horizontal differential stress concentrates along a line from the pressure source to the site of potential fracturing at the surface with a dip angle of 51° (red lines in Fig. 3, superimposed to the stress field calculated by Anderson, 1936). In three dimensions, lines S 1 and S 2 generate an inverted cone or “funnel” with a basal diameter of 1.64 times the depth of the pressure source center at the cone apex.
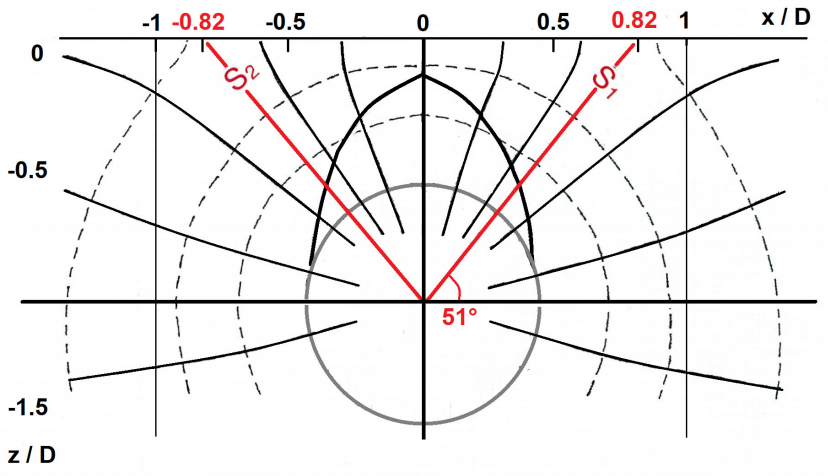
Figure 3 Stress field produced by point dilatation beneath a free surface adapted from Anderson (1936). The red lines S₁ and S₂ were added here to represent the lines of maximum differential horizontal stress (De la Cruz-Reyna and Yokoyama, 2011).
The Subsurface Structure of Tambora Caldera
1. Assumptive Subsurface Structure of Tambora Caldera Inferred from its Morphology and Dimensions
Since its formation, scores of geological data on Tambora Caldera have been published. Recent contributions have provided valuable additional information on the caldera structure (e.g. Self et al., 1984; Foden 1986; Barberi et al., 1987, and Takada et al. 2000). In the present paper, a likely subsurface structure of this volcano is discussed, but first, it is important to summarize the basic history of this volcano activity. Barberi et al. (1987) showed that the oldest lavas in the 1815 caldera walls are about 55,000 years old and that the previous main event occurred nearly 5000 years before 1815. According to Petroeschevsky (1949), the volcano unrest began in 1812. A dense cloud near the summit and rumblings from the shield volcano were reported about 3 years before the 1815 eruption. However, after the 1815 outburst, Tambora Volcano has not produced any significant eruptions, probably because the 1815 eruption volcano exhausted most of its magmatic internal energy. In contrast, Krakatau volcano, which Yokoyama (1957) estimated released about one order of magnitude less energy in its 1883 eruption, has produced repeated smaller eruptions afterward. While Tambora's structure is rather simple, the parasitic activity of Krakatau has been important. This may be caused by their different internal structures.
Fig. 4 illustrates an assumptive E-W vertical cross-section of the Tambora Caldera. There, the profile S-R1-C-R1 ’ represents the upper part of the pre-caldera shield volcano observed before 1815, with its summit S at 4000 m a.s.l., which was demolished by the explosive eruption to an altitude of 2850 m a.s.l. The line from the eastern caldera rim R 1 at that altitude to the point P1 represents the inner caldera slope at a dip angle of 51°, as calculated from the above-mentioned shear fracture model (De la Cruz-Reyna and Yokoyama, 2011). Therefore, one may estimate the depth of the explosion-causing pressure source (P 1) at 1.6 km below sea level, which could have been the upper end of a magma conduit connected to deeper magma reservoirs, probably near 5 km b.s.l.
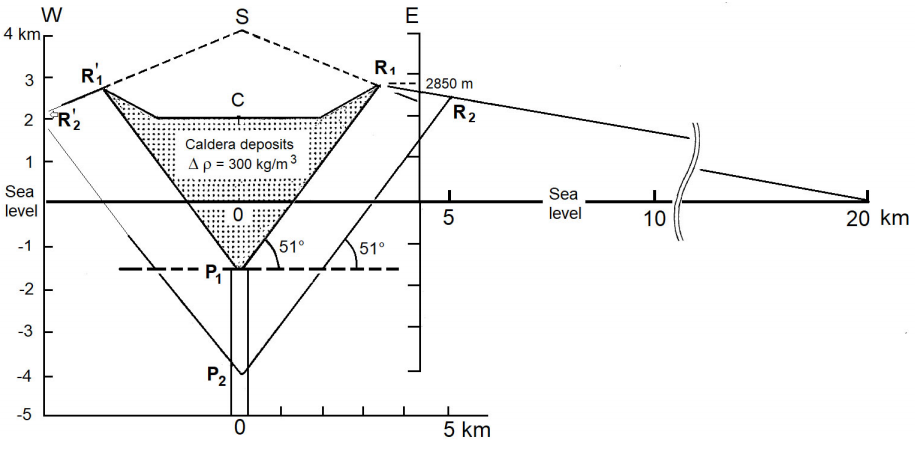
Figure 4 An assumptive E-W section of the 6.7 km diameter Tambora Caldera. Point S marks the summit of Tambora Volcano before the 1815 eruption at 4000 m a.s.l. The line from R 1 the eastern rim of the caldera to P1 represents the caldera slope assumed by the shear fracture model and corresponds to line S 1 in Fig. 3. Using the same model, a deeper pressure source P 2 would produce a wider conic caldera with R 2 as its eastern limit.
One may have expected that the largest explosive eruption in recorded human history produced a crater bigger than 6.7 km in diameter, as other older calderas around the world are larger. Explaining this is one of the main objectives of this paper and at this stage, it may be argued that this was caused by the relatively shallow depth of the explosion center. Had the explosion source center been deeper and more energetic, say at P2 in Fig. 4, at 4 km b.s.l., the expected explosion caldera would have been 10 km wide, with a lower rim altitude. The volume of the deposits within the 6.7 km wide funnel-shaped caldera illustrated in Fig. 4 is estimated at 47 km3, while the assumed 10 km diameter caldera (with its eastern limit located at R2) would have 157 km3 deposited within the funnel.
2. Gravity Anomalies Related to the Deposits in the Tambora Caldera
In 1815, Tambora Volcano blew out about 63 km3 of volcanic material, including part of the pre-eruption shield volcano. From this, the caldera deposits amount to about 47 km3 in bulk as discussed in the previous section. The caldera deposits are composed of breccias from the volcanic structure and ejecta fallbacks of relatively low density, around 1.5×10³ Kg/m3. Then, assuming a density contrast of 3×10² Kg/m3, a gravity low around -13 mGal should be expected at the center of the caldera floor (C in Fig. 4). Thus, Tambora Caldera may be classified as a low-gravity-anomaly-type (LGA-type) which is characterized by thick deposits of fallbacks of ejecta derived from andesitic and dacitic magmas. Another caldera type is the high-gravity-anomaly-type (HGA-type) shall be referred to in the following sections.
“Tambora-Type” Calderas
How large a caldera could be? Can a single eruption like the 1815 Tambora event produce calderas of any size? The diameter of calderas may provide important clues on their origins, but there should be many other conditions needed to answer the question. The historical activity suggests that the 6.7 km width of the Tambora Caldera may be close to such a limit. Here, a diameter of 10 km is assumed to be the maximum theoretical diameter of a single eruption caldera, and such structure is labeled as a “Tambora-type caldera”. Based on explosive energy considerations, Steinberg (1974) estimates the same limiting diameter for a crater formed by the single largest possible volcanic explosion. However, it is well known that many calderas exceed a 10 km diameter. In the following sections, the further enlargement of calderas by subsequent eruptions and by other factors like erosion is discussed, but before it is important to point out the differences between two different types of calderas.
As stated above, calderas are classified into two types according to their origins, namely the collapse-type or HGA-type, and the explosion-type or LGA-type. On the Earth, the latter is much more abundant than the former. The collapse-type calderas such as Izu-Ooshima (Japan), Kilauea (Hawaii), Fernandina (Galapagos), Batur (Bali), and others are generally formed by the drainage of shallow basaltic magma reservoirs causing stepwise subsidence or collapse of the overlying ground or volcanic structure to fill the voids. This causes local high gravity anomalies as only high-density material is left under that type of caldera floor.
The explosion-type calderas, as is the case of the 1815 eruption of Tambora Volcano are globally more numerous than the collapse type. Pyroclastic ejecta derived from siliceous magmas and debris of the overlying structures are deposited on and around the volcano, sometimes forming welded tuffs. Lower-density deposits of such ejecta originate local low-gravity anomalies, this is the LGA-type.
Hitherto, caldera formations were frequently generalized and believed to be “collapse type” assuming or inferring shallow magma reservoirs, and little attention has been given to the explosion-type calderas. Yokoyama (2016) presented a critical discussion on this hypothesis and pointed out that when a relatively deep magma reservoir (at depths around 5~10 km) --which may be formed by complex arrays of dykes and sills-- discharges any amount of magma, those elements should be accordingly compressed by lithostatic pressure, dissipating the stress and leaving little or no space to accept collapsing edifices. Such a process would not form an LGA-type caldera.
Differences between craters and calderas. Craters are usually formed by explosions that keep a conic or funnel shape around a central emission center. Calderas are usually much larger in diameter and are filled with thick layers of fallback pyroclastic and lithic debris deposits, and sometimes cinder cones formed by post-caldera activity. As a result, craters do not show particular gravity anomalies, while calderas exhibit local low or high gravity anomalies depending on the magma type, silicious or basic, and the dynamics of the eruption, explosive or effusive. As mentioned above, the three examples of historical calderas, Tambora, Krakatau, and Novarupta discussed by Yokoyama (2016) were formed by large-magnitude and strongly explosive eruptions, in which the eruptive energy is released by most of the magma body, and are thus not followed by any major further eruptive activity. The Tambora 1815 eruption is a particularly clear example of an explosion caldera formation and can be used as a reference or standard to describe other calderas in the world.
Composite Calderas Formed by Multiple Tambora-Type Adjacent Eruptions
In the previous sections, the Tambora-type calderas have been presented as a typical example of newly-born volcanic structures formed by single eruptions and having a limiting diameter of about 10 km. Here, that answer to the question posed and discussed in section 4: how large an LGA caldera may be? leads to a new question: how explosion-type calderas larger than such limiting diameter are formed? An answer is that the known large LGA-type calderas on the earth are composite calderas formed by subsequent Tambora-type adjacent eruptions. To discuss such combined calderas, Aso and Aira calderas in Kyushu, Japan (Fig. 5) are used as examples in the following.
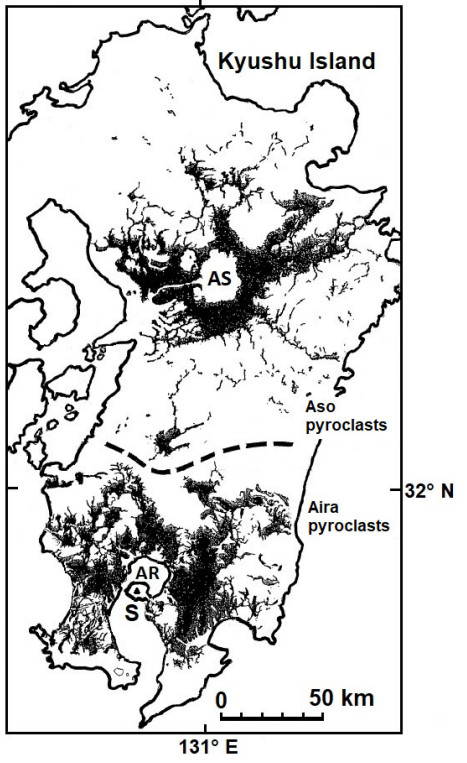
Figure 5 Distribution of pyroclastic ejecta from both the calderas after Matumoto (1943). AS Aso Caldera; AR Aira Caldera; S Sakurajima Volcano. This figure is adapted from the original paper of T. Matumoto (1943), who made important contributions to the geology of the area. In the original figure “Aso lava” and “Aira lava” were corrected as Aso pyroclasts and Aira pyroclasts respectively.
1. Aso Caldera
Aso Caldera measures 25 × 17 km2, second in size only to the Kuccharo Caldera in Hokkaido, measuring 26 × 20 km2. The highest altitude at Aso Caldera is the Takadake Cone at 1592 m a.s.l. (T in Figure 6) and the caldera rim is on average about 800 m a.s.l. Around the caldera, voluminous deposits of pyroclastic ejecta are distributed as shown in Fig. 5. Geological studies have established that the caldera-forming eruptions at the Aso area continued through 270 ~ 90 ×103 YBP and during that period occurred four large pyroclastic flows, named "Aso-1 ~ 4 Flows". Of those flows, the Aso-4 Flow was the largest, amounting to 400 km3 in bulk.
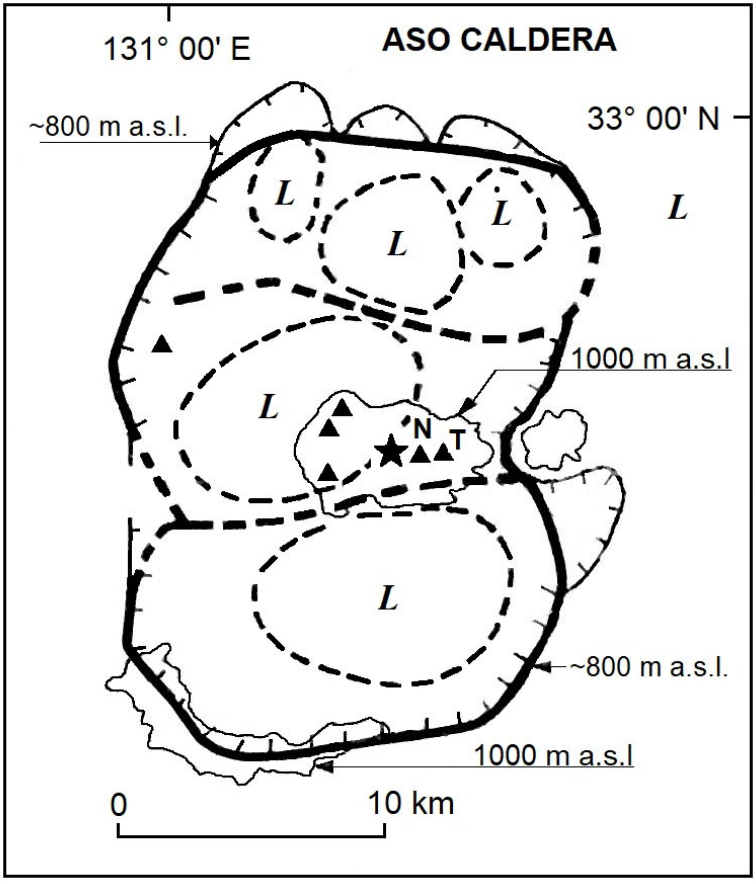
Figure 6 Aso Caldera is composed of three adjacent Tambora-type calderas. Gravimetric data from Komazawa (1995) identify local negative residual gravity anomalies denoted " L ". Black triangles in the central part denote post-caldera cones: "T" is the highest one, Takadake Hill (1592 m a.s.l.). The star symbol denotes a group of vents, from which Nakadake Hill (N) is currently active.
The large dimensions of Aso caldera are thus explained here as the result of three Tambora-type eruptions developing with a north to south trend. The limits between such calderas, each with dimensions in the order of 10 km, are marked by the thick broken lines in Figure 6. The adjacent Tambora-type eruptions and the erosion on their borders caused the large dimensions of the actual caldera. Geophysical data support this interpretation, Komazawa (1995) carried out detailed gravity surveys and performed 2- and 3-dimensional analyses of the results. He obtained negative residual gravity anomalies for the caldera structure caused by deposits shallower than 5 km. These LGA areas, denoted by “L” in Fig. 6 are somewhat irregular, with the northern part containing 3 components of Tambora-type calderas distinguished by local gravity anomalies. In this area, the 3 components may have separately expanded toward the north as suggested by the topography. The middle part of the caldera may be the last formation and produced 5 post-caldera cones, one of which, Nakadake Hill (N in Fig. 6) near the center of the group holds active vents (star mark), recently erupting in October 2016, January-June 2020 and October 2021. Both the north and south parts are characterized by topographical lows, partially covered with lake sedimentary deposits.
Therefore, according to the Tambora-type nesting of adjacent major eruptions model, it is assumed here that the three Tambora-type calderas forming the composite Aso caldera resulted from three separated magma reservoirs that according to the Komazawa gravity model are located at depths near 5 km. Another major caldera, Aira, with a similar origin is described in the next section.
2. Aira Caldera
Aira Caldera, located at the northernmost part of Kagoshima Bay, measures more than 10 × 20 km2 (Fig. 7a). Its morphology is characterized by two depressions that were originally formed on land around 22,000 YBP according to Aramaki (1984). In the following, the actual structure of the caldera is discussed first and from there the original state of the caldera is revised, and its origin reconsidered.
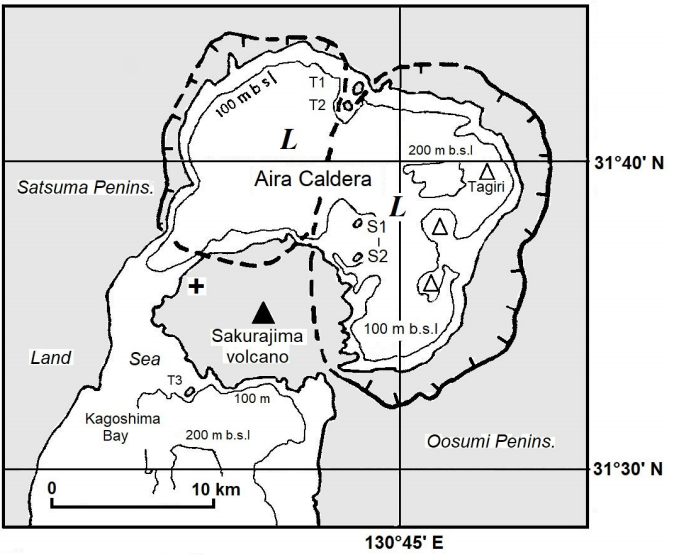
Figure 7a Aira caldera at present. Only 100 m bathymetric contours are shown. L denotes low-gravity anomalies. T1, T2 and T3 are on the Tertiary basement.
Aira Caldera at present: Currently, the caldera shows two depressions, east, and west. The west depression has a rather flat bottom at around -140 ~ -150 m at the deepest, without active vents or their remains. Apart from the Sakurajima volcano persistent activity, no seismic activity of volcanic origin has been reported in the caldera area (Iguchi, 2007).
The east depression is wider than the west one and it may be a composite structure formed by two 10 km wide Tambora-type calderas aligned in the north-south direction. There are three vents (marked by blank triangles in Fig. 7a), and the northernmost one, “Tagiri” (boiling in Japanese) is still active while the other two are probably extinct.
Within Aira Caldera, there are various Tertiary cones and islands, marked T1, T2, and T3 in Figs. 7a and 7b. In the east caldera, there are two islets, (S1 and S2 in Fig.7a). According to Kuwashiro (1964), these islands appeared in 1780, when Sakurajima Volcano erupted, but they were not derived from the volcano. They were issued from the boundary wall of the east caldera.
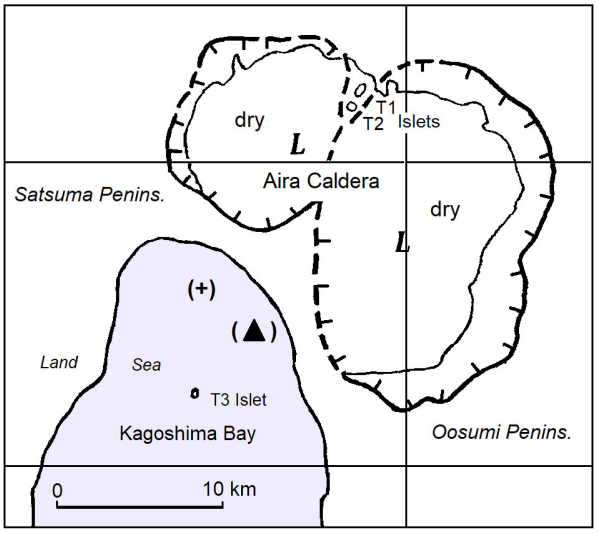
Figure 7b An assumptive early stage of Aira Caldera at around 22,000 YBP. The caldera boundaries are assumed to be similar to the present ones. The (+) mark denotes the present site of an 800 m deep exploration borehole and (▲) marks the actual summit of Sakurajima Volcano.
Thereafter, but before Sakurajima Volcano was formed at the south of the depressions, around 13,000 YBP, they were flooded by the sea from the south at both west and east sides, forming the Kagoshima Bay. After many centuries, in 1914, the strait between Sakurajima Island and the Oosumi Peninsula was dammed up by lava flows from the erupting Sakurajima Volcano as shown by the present topography.
The sea surrounding Sakurajima Volcano is for the most part shallow, but there are two deeper areas at -200 m isobaths: one in the eastern caldera and another at the south of Sakurajima Island extending to the Kagoshima Bay. In 1975, Chujo and Murakami (1976) carried out a multi-parametric preliminary geophysical survey on the Kagoshima Bay including the coastal areas. Later, in 2008, Miyamachi et al. (2013) carried out seismological surveys to study the seismic wave velocity structure to depths up to 4 km beneath this area, including the active Sakurajima Volcano. Yokoyama and Ohkawa (1986) discussed the subsurface structure around Sakurajima Volcano mostly from the gravity anomaly data. They reported that such anomalies at the center of the caldera are - 25 mGal and estimated the depth of the Tertiary basement under Sakurajima Volcano at about 2.5 km b.s.l.
Aira Caldera initial stage: Fig. 7b envisions the initial conditions of Aira Caldera around 22,000 YBP, as composed of two depressions, E, and W, with a boundary that could be a line from the two islets (T1 and T2) on Tertiary basements at the northernmost part, to the south similar islet (T3). The present heights of T1 and T3 isles are 125 m and 38 m above sea level, respectively. At that time, the northernmost part of the Kagoshima Bay was above sea level and the caldera boundaries are hypothetically assumed to be the same as the present ones. The calderas were then formed on land, and Aira Caldera was later flooded by the sea at Kagoshima Bay from S to both W and E. The E depression has kept some post-caldera activity under the sea.
Formation of Sakurajima Volcano: A post-caldera volcano, Sakurajima Island was formed around 13,000 YBP from adjacent lava flows from parasitic vents on its slopes. The island became connected to the Oosumi Peninsula during the 1914 eruption by lava flows. At present, the southern summit-crater is active producing repeated explosive eruptions. At the NW foot of Sakurajima Volcano, the mark (+) in Fig.7b, denotes the position of a borehole about 800 m deep, penetrating under recent Sakurajima deposits and not disturbed by the active volcano (▲ marks its summit). All of the cores from the borehole are of marine origin suggesting that it is located outside the Aira Caldera.
Conclusions
The formation of cauldron-subsidence calderas has been explained and discussed in the literature using different models. In particular, calderas resulting from major explosive eruptions in silicic volcanoes need interpretations that explain some geophysical features observed in field studies, among which, the local low gravity anomaly and the geometry of the fallback deposits inferred from seismic studies are most important and contrastingly different from the geophysical characteristics of collapse calderas associated to basaltic volcanism. To explain the geophysical characteristics of the low-gravity anomaly calderas, the dynamics of cauldron-subsidence caused by major explosive eruptions is reviewed here in terms of the stress field caused by a center of dilatation in a homogeneous isotropic semi-infinite solid. For relatively shallow magma bodies such stress field vantages the formation of large funnel-shaped craters that can reach up to 10 km in diameter provided the magma body stores sufficient internal energy. The slope of the funnel conical surface is determined by the maximum shear stress induced by the expanding magma body, as illustrated in Fig. 3. The caldera formed by the 1815 Tambora eruption is consistent with this model, and similar structures are thus called Tambora-type calderas.
Some geophysical features, mostly the gravity anomaly distribution on large explosion calderas, like Aso and Aira, exceeding the theoretical 10 km diameter limit, indicate that they were probably formed by recurrent and adjacent Tambora-type eruptions. For Aso, three roughly aligned in the N-S direction, the central one being the youngest as suggested by the active cones in its interior, and two for Aira, roughly aligned in the E-W direction, although the eastern depression may be formed by two other Tambora-type calderas. Data from the borehole and the three tertiary cones depicted in Fig. 7b suggest that the Aira nested calderas probably formed over 20,000 YBP on dry land, and were eventually flooded, extending the Kagoshima Bay to the north.


 nueva página del texto (beta)


