Introduction
Several versions of the historical background and the place of birth of the biblical Queen Sheba documented in the Old Testament (1King 10: 1 - 13) as a black queen of the south with great wealth and influence who journeyed from the uttermost part of the earth to hear about the wisdom of King Solomon exist and are well documented. Some records account that she was originally from today’s known country of Yemen (Seligsoha et al., 1906) while the Ethiopians held Makeda (Queen of Sheba) in high esteem as the mother of Melenik 1, a son she had with King Solomon, the progenitor of the Emperor Haile Selassie dynasty that ruled Ethopia until 1974 (Belcher, 2010). The Ijebus, a stock of the Yoruba ethnic tribe in southwestern part of Nigeria has also laid claim that a powerful Yoruba queen (Bilikisu Sungbo, (Bilqis) the Islamic version), reported to have great power and wealth, is the biblical Queen Sheba (Darling, 1997, 1999, 2001). Tradition claims that she returned from her voyage to visit King Solomon and settled in the Yoruba kingdom afterwards building a great fortified city with a trench (up to 20 m deep in some places), constructed by her servants in a mysterious way, along the perimeter of the Ijebu Kingdom (Darling, 1997). The trench popularly known as ‘Eredo’ (ditch in Ijebu dialect) and currently on Nigeria's tentative list of potential UNESCO World heritage sites, has been compared to other UNESCO Heritage Sites such as The Pyramid of Giza and The Great Wall of China (Darling, 1997, 2001). The trenches, which were usually mounted by guards at certain points, to protect against invasion, surround the kingdom and extend over 160 km in length. Remains of the trench still exist today (Figure 1). The burial site of this controversial woman of great influence has been greatly revered by some Christian, Islamic and Traditional religion worshipers, some for tourism, while others pay visit to draw some sort of spiritual powers including answers to prayers. Several myths surround the burial site, many of which have been documented by other researchers (e.g. Aremu, 2002; Ogundele and Babalola, 2007; Aremu et al., 2013).
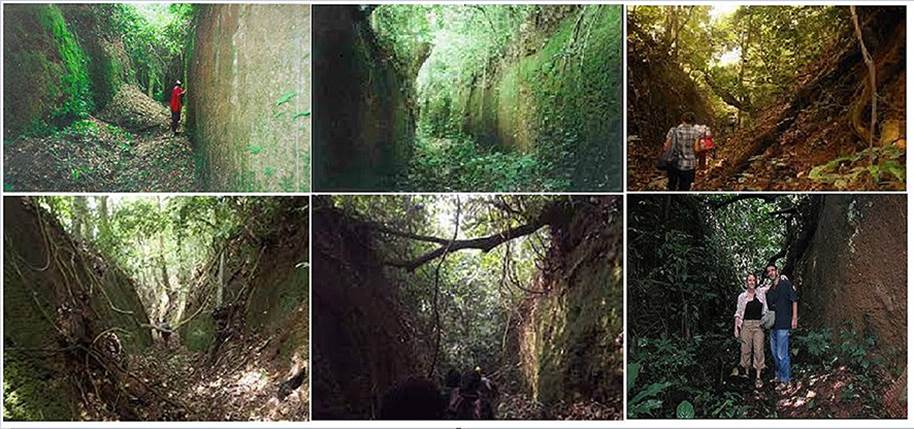
Figure 1 Pictures of the Bilikisu Sungbo trench excavated at different parts of Ijebu land (Darling, 1997, 2001; Wikipedia, 2021).
Several archaeological and anthropological studies have been carried to establish or refute some of the mythical claims (Ogundele and Babalola, 2007; Aremu et al., 2013). However, geophysical investigation techniques though limited in confirming if the somuch revered Bilikisu Sungbo is indeed the biblical Queen Sheba’s tomb, but it is apt, through its subsurface imaging ability, to establish the occurrence of a tomb. Ground penetrating radar is a non-invasive geophysical technique that employs reflections of electromagnetic energy generated by a transmitter, to image the subsurface on the account of variation in subsurface dielectric properties. The technique has recently gained relevance in archaeological investigation, particularly to locate buried archaeological features, artifacts, and important cultural strata (Perez-Gracia et al., 2009; Masini et al., 2010; Conyers, 2006; Conyers, 2012). This study therefore employs the subsurface imaging ability of ground penetrating radar geophysical techniques to evaluate the burial site and thus establish if a grave exists within the assumed region where the burial site of this woman is situated.
Geology of the study area
The study area lies within the transition zone between the crystalline basement rocks and sedimentary rocks situated between latitude 7ºN and 10ºN and longitudes 3ºE and 6ºE outskirt of Ijebu-Ode town. The geology of Ijebu-Ode and environs has been described by Osinowo and Olayinka (2012, 2013) to belong to the transition geological environment between the Precambrian Basement Complex rocks of southwestern Nigeria and the Cretaceous sedimentary units of the Abeokuta Formation in the eastern part of the Dahomey Basin (Figure 2). The northern (northeast, northwest and north central) is underlain by basement rocks of Migmatite Gneiss Complex which comprises of biotite granite gneiss, biotite-hornblende gneiss that intrude schistose host rocks such as biotite schist, quartzite schist, talc-tremolite schist, and Muscovite schists (Oyawoye 1972; Rahaman 1988; Osinowo and Olayinka, 2012, 2013). The southern portion is overlain by Ise Member of the Abeokuta Group that unconformably overlies the basement rocks. The sedimentary unit comprise mainly of grits, arkosic sandstones, siltstones and clay with occasional conglomerate of predominantly arenaceous materials (Omatsola and Adegoke, 1981).
Local Geology
The studied burial site is situated in Oke-eri, a village settlement located in the northern part of Ijebu-Ode. It is underlain by Migmatite Gneiss Complex rocks with faults which generally trend NW-SE (Osinowo et al., 2011). Prominent rocks include migmatite gneiss, biotite granite gneiss and quartz schist. The gneiss which is the oldest rock is intruded by other rock types. It is fine to medium grained, weakly foliated and variably migmatized. It strikes generally NW-SE with measured dip values that range from 37 - 49ºW. Outcrops observed around Oke-eri displayed medium to high degree of migmatization with quartz-feldspartic pegmatite veins having sodic feldspars and quartz as the prominent leucocratic mineral intrusions. The soil profile around Oke-eri, presented in the form of a geological section (Figure 3) generated from interpreted Vertical Electrical Sounding (VES) data (Obtained by Osinowo and Olayinka (2012), indicate a well-developed soil profile. The lateritic top soil unit which is about 1.6 m thick comprise of lateritic sands or sandy unit which may be capped with clayey top. This unit directly overlie the weathered/partially weathered basement rock unit (about 6.7 m) and itself underly by fresh basement rock unit of southwestern Nigeria around the study area. Osinowo and Olayinka (2012) reported the capping lateritic unit to be indurated and often inhibit adequate groundwater recharge around Ijebu-Ode, and has been identified to be responsible for poorly developed groundwater system around Ijebu-Ode and environs.
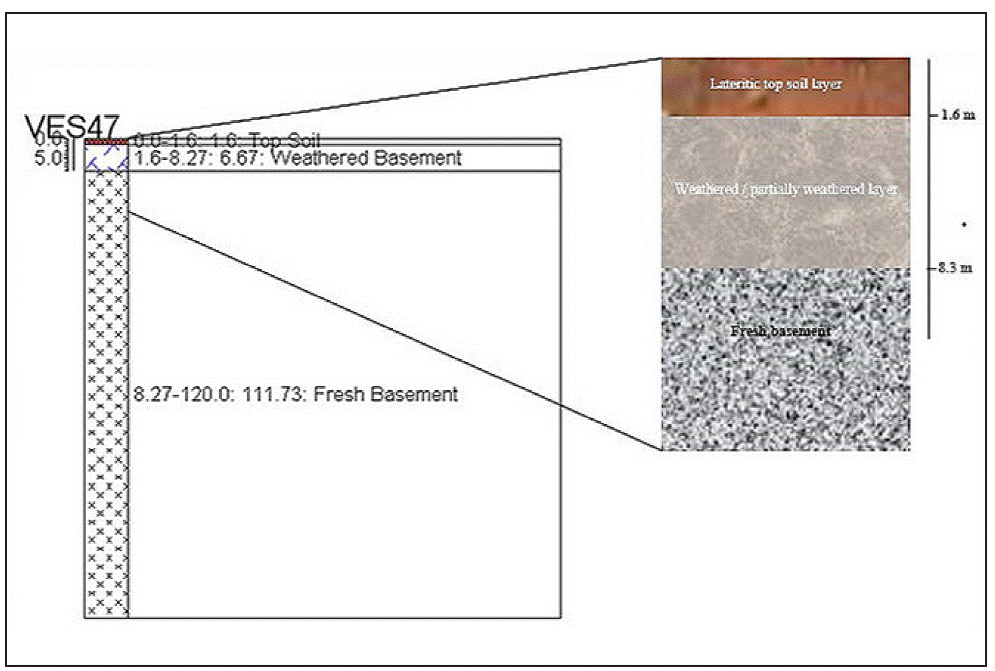
Figure 3 Geological section generated from outcrop assisted interpreted Vertical Electrical Sounding (VES) investigation carried out around the study area (Osinowo and Olayinka, 2012).
Materials and Methods
Data acquisition for imaging the upper subsurface around the Queen Sheba’s (Bilikisu Sungbo) burial site was carried out using GSSI (SIR-3000) GPR equipment. The equipment which consists of a transmitter and a receiver unit was used to measure the two-way reflection time of electromagnetic pulses reflected at interfaces of differing dielectric properties and recorded as radagrams (Leckebusch, 2003; Conyers, 2004, 2009; Annan, 2003). A 400 MHz antenna capable of probing up to 4 m was used in this study (Figure 4a). Relatively deep profiling was achieved with 400MHz antenna by using longer range (100 ns) for the energy to penetrate deeper, with dielectric value of 9, for slightly damp sand / dry silt. The sample rate per scan of 1024, pulse rate of 2.5 ns, bits per sample of 16 and 64 scan per second were specified to achieve a relatively deeper measurement of the target subsurface depth (GSSI, 2011; 2017). Ground measurements were taken using both the geology-can and structure-scan modes for the GPR system. These measurement modes can image the geological and structural subsurface features on the account of variation in dielectric properties of the scanned geological and structural features. Twenty-three profiles were established at 2 m separation along E - W and S -N directions, across the entire burial site (Figure 4b). 14 profiles (P1 - P14) were set along east - west direction, seven (7) profiles (P15 - P21) were oriented to the South - North direction while two (2) short survey profiles (P22 - P23) were executed along North - South direction. The last two profiles were established within a rectangular frame constructed to restrict people’s access (Figure 4a) to a region believed to directly overly the grave (Figure 5). The E - W trending profiles are approximately 11m in length while the N - S profiles are 36.6m long, except for profile 18 which is about 33.5 m long. The profile (P18) is shorter than the other S - N profiles because it is limited by the fence constructed to cordon off the burial site. Profiles 22 and 23 which were occupied within the cordoned off section are the shortest in length (8.5 m long). Two-way travel time of individual reflections generated at different dielectric interfaces were automatically digitized into traces by the equipment to generate radargrams, which represent the total waveform of a series of reflections obtained along the profiles (Conyers, 2004, 2009).
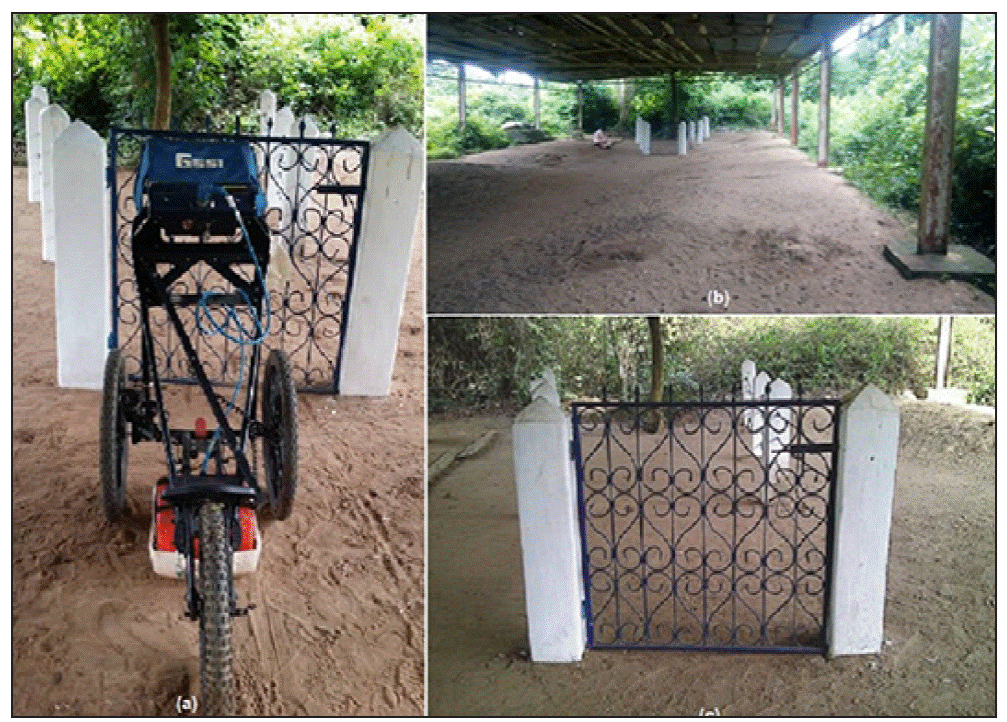
Figure 4 Photographs of the (a) GSSI (SIR-3000) GPR equipment with a 400 MHz antenna, (b) the entire burial site and the (c) Tomb area cordoned by the fence.
Data Processing
Static correction to compensate for the time delay of the first arrival was the first processing operation applied to the raw GPR data after the initial quality checking (QC) and preprocessing operations such as data editing and reorganization, filemerging, adding header and background information as well as correct positioning (Annan, 2003). The static correction adjusts individual traces for the lag between the time when the transmitter was switched on, at time zero (to) and the first break (tfb) when the first wave was recorded (Davis and Annan, 1989). This operation accounts for the air space between the transmitter/receiver units and the ground surface and thus converts tfb to to using the relation below.
Where d is the distance between the transmitter and the receiver, and Va is the velocity of GPR signal in air, which is the media below the transmitter/receiver units and the ground surface.
The resultant data were filtered to remove non-linear/low frequency GPR signal components (cultural noise) which results due to proximity of the transmitter and the receiver to near surface/buried electrical and other cultural/house-hold utilities (Moorman, 1990). The low frequency noise which does not propagate but diffuses into the ground and induces slowly decaying wow (wave) on the high frequency components of the trace, were filtered out to increase signal to noise ratio (S/N). Thus, improving the quality of the data by the application of low cut or high pass Gaussian filter in a process commonly referred to as Dewowing (Fisher et al., 1996; Cassidy, 2009). Amplitude gain was further applied to the GPR data to compensate for the signal attenuation that affected the transmitted signal as it travels to the reflector and back to the receiver. Gains were applied to boost signal strength, which generally decreases with depth, and thereby increasing the visibility of the late arrivals that are often presented as weak signals. Spatial filters were also applied to remove high frequency random noise types, such as ringing (horizontal noise, which may be associated with electromagnetic interference, system noise and surface reflections) in the data set. Background average subtraction filter that runs the average background subtraction to the data, filters out unwanted signals by subtracting themean/ average trace of the entire GPR line from every trace in the line (Benedetto et al., 2017). The filter known to enhance dipping events and mute horizontal events is also effective for removing direct air waves and ground waves at the top of the GPR profiles. Conversion of the 2-way travel time to depth was also carried out using a simple mathematical relation expressed in equation 2. The expression relates the depth of investigation (d) with the 2-way travel-time (t) of the GPR reflection pulses, the dielectric permittivity of subsurface materials (ε) and the speed of light in a vacuum (c = is 3 × 10⁸ m/s). The approach generates an initial velocity relation using initial dielectric (assumed) value of 9, which though an approximation has been reported to be reliable, especially where the electrical conductivity is low and the magnetic permeability is 1.
The initial velocity relation is usually optimized using velocity information obtained from detailed propagation velocity analysis such as could be derived from velocity migration, Common Mid Point (CMP), hyperbolic velocity analysis. For this study a semblance of the CMP velocity analysis technique was employed to generate a quick velocity estimate used to improve the velocity information for time - depth conversion. The technique simply sorts out data acquired at common-source and multi-receiver data and further rearranges them into centimeter to extract velocity information. Finally, the resultant processed, filtered and gain recovered GPR data (2D radargram) were sorted based on the order of acquisition in the field and combined using Ekko Project software algorithm developed by Sensors and Software Inc. Canada, to generate 2D sections and time slices at different imaged depths.
Results and Discussions
A combination of the geophysical concepts of GPR techniques, observed cultural features during measurement as well as the knowledge of the terrain geology guided the interpretation of the various anomalies observed from the filtered and enhanced GPR data and they are presented as 2D radargrams and 2D sections / time slice maps. The radargram sections generated from the GPR survey present the subsur-face image on the account of GPR reflection up to 4.88 m. The section can be roughly divided into two parts based on the reflection signals. The upper near surface (0 - 0.76 m) part of the section with characteristic poor reflection images which imaged the soil horizons and the averagely well imaged deeper (0.91 - 4.88 m) horizon (Figure 5a). The upper part of the sections presents poorly resolved low amplitude GPR reflections which can be attributed to relatively high humidity of the soils (damp) and the possible occurrence of lateritic capping unit which has ability to attenuate reflection energies (Leucci, 2008). The surveyed area is situated under a shed constructed with planks and iron roofing sheets with the topmost soil comprising of relatively dry loose sands. However, beneath the few inches of dry loose sands is possible occurrence of lateritic unit (Figure 3). The deeper part on the other hand presents relatively high amplitude reflections which reflect the actual subsurface signals. The relatively high resolution at depth, as evident by distinct reflection signatures which remain visible with depth, suggest that the deeper unit is resistive and by extension relatively high electrical permittivity. The low conductivity of the deeper units may be associated with less clayey materials and low in water saturation as reported by Osinowo and Olayinka (2012) . The deeper reflections have relatively high amplitude, they are continuous and appeared truncated at points of variation in dielectric properties of the subsurface. This can be related to the changes in earth materials beneath the imaged section or occurrence of materials which differ significantly in the dielectric properties, especially when compared to that of the surrounding earth material. The variation in the reflection characteristics or continuation has been a very reliable means of mapping occurrence of subsurface voids or cavities which have different reflection patterns from that of the surrounding rocks (Reppert et al., 2000). Changes in reflection impedance as a result of variation in dielectric properties encountered between the surrounding earth materials and the walls of the burial tomb is known to generate classic hyperbolic diffraction curves/reflection events (Davis and Annan, 1989), such as the prominent classic hyperbolic diffraction curves observed around 0.91 to 1.22m (marked with red arrows) (Figure 6). The generated diffractions and other associated perturbation beneath the hyperbolic curves appeared continuous with depth, from around 1.22 m, thus suggesting occurrence of prominent material of differing reflection amplitude, such as could be attributed to grave/ tomb walls, voids or occurrence of burial materials existing between the walls of the grave. The occurrence of classic hyperbolic diffraction curves in profiles established around the cordoned off burial place, specifically to the right (Figure 6b) and the left (Figure 6c) of the reference profile (Figure 6a) further established the possible existence of materials which differ in dielectric properties from the host geologic materials, especially such variation which may be consistent with burial activities. Visible high amplitude and extensive reflection anomalies also characterize the different depth sections and different parts of profiles 22 and 23 that were established directly over the cordoned off, possible burial site (Figures 6e & 6d). The anomalies possibly indicate occurrence of subsur-face voids created by excavation which may be poorly filled with foreign or disturbed earth materials. Other noticeable reflection events generally observed on the GPR profilesmay be attributed to airwave events commonly associated with reflection energies that travel through the air and returned to the receiver by overhead metallic roofing sheets that covered the burial site (Sun and Young, 1995).
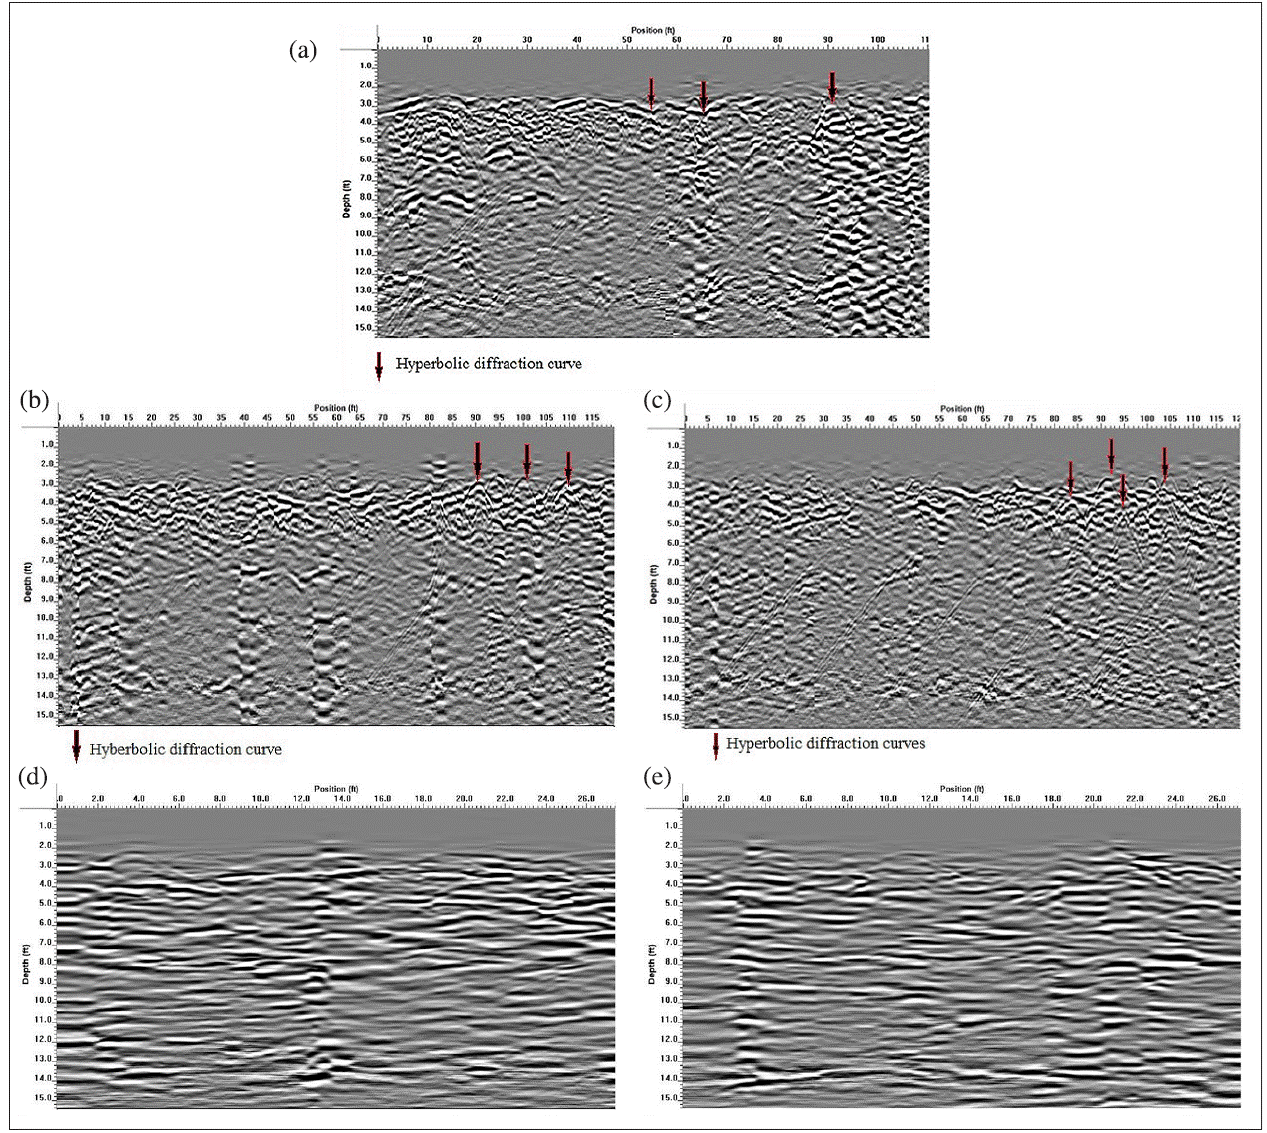
Figure 6 GPR Reflection Profiles (a) ran over the grave area (P18) (b) right of the reference profile (P17) (c) left of the reference profile (P19), (d) Profile 22 and Profile 23 established directly on the possible burial site with reflection signatures showing variation in dielectric properties relative to the host geologic materials.
The desired target in this study is a burial tomb which is better evaluated in 2D dimensional form. The combination of all the individual radargram sections generated a 3D image from which time slices of different depths were extracted for the purpose evaluating the GPR reflections patterns at various depths. Eighteen GPR time slices generated at 0.061 m interval from 0.73 m to 1.83 m and stacked at six (6) traces each, are presented in figures 7 (a - c). Figure 7a presents the first stack traces with the shallowest trace extracted at 0.73 m. This is because shallower than 0.73 m the GPR reflections were attenuated and poorly resolved. The first stacked traces (Figure 7a) show characteristic low amplitude reflections which dominates the entire slice except for isolated relatively high reflection amplitude in extreme north of the surveyed area. The stacked traces indicate gradual increase in reflection amplitude with depth that suggests increase in resolution with depth which may result from reduction in clay content and probably decrease in water saturation, since the lateritic unit is known to inhibit adequate groundwater recharge after rainfall (Osinowo and Olayinka, 2012). The relatively high reflection amplitude observed within the depth range (upper 1.04 m) in the presented GPR time slices in the first stack (Figure 7a), probably relates to near surface bioactivities such as burrow of animals or occurrence of artifacts. The second stack (Figure 7b) shows traces extracted from 1.04 m to 1.4 m. It shows progressive deeper part of the subsurface beneath the surveyed area. The slices present relatively higher GPR reflection amplitude which suggests less attenuation of the GPR reflection energy, especially when compared with degree of attenuation in the upper very near surface (<0.73 m). Variation in the reflection amplitude generally characterizes the iso-depth reflection slices extracted from this depth interval. This variation can be attributed to the varying dielectric properties of the subsurface materials at these intervals. This variation may relate directly or indirectly with break in distribution of geologic material at the intervals. Occurrence of voids or foreign material of contrasting dielectric properties will properly present contrasting GPR reflection amplitude (Moran et al., 1993; Novo et al., 2011). The cordoned off part of the surveyed area, believed by locals to be the ground directly above the Queen Sheba’s tomb (Figure 3a), presents unique GPR reflection amplitude. The region marked with circle presents gradual increase in reflection pattern with depth (Figures 7b) and it is found to continue with depth and consistent in pattern up to 1.83 m (Figure 7c). The relatively high amplitude reflection pattern observed around the location of the burial tomb, demarcated with circle indicates variation in dielectric properties, especially when compared with the surrounding host/subsurface geology. This could be attributed to the alteration in the original geology through digging of the grave and introduction of foreign materials, such as tomb walls. Prominent and consistent high GPR reflection amplitude around the cordoned part of the burial site is apparent on the GPR time slices extracted at 1.24 m, 1.30 m, 1.36 m and 1.43 m as shown in figure 8. The anomaly in GPR reflections could be attributed to the occurrence of tomb walls as well as occurrence of void around the walls of the grave (Bladon et al., 2011).
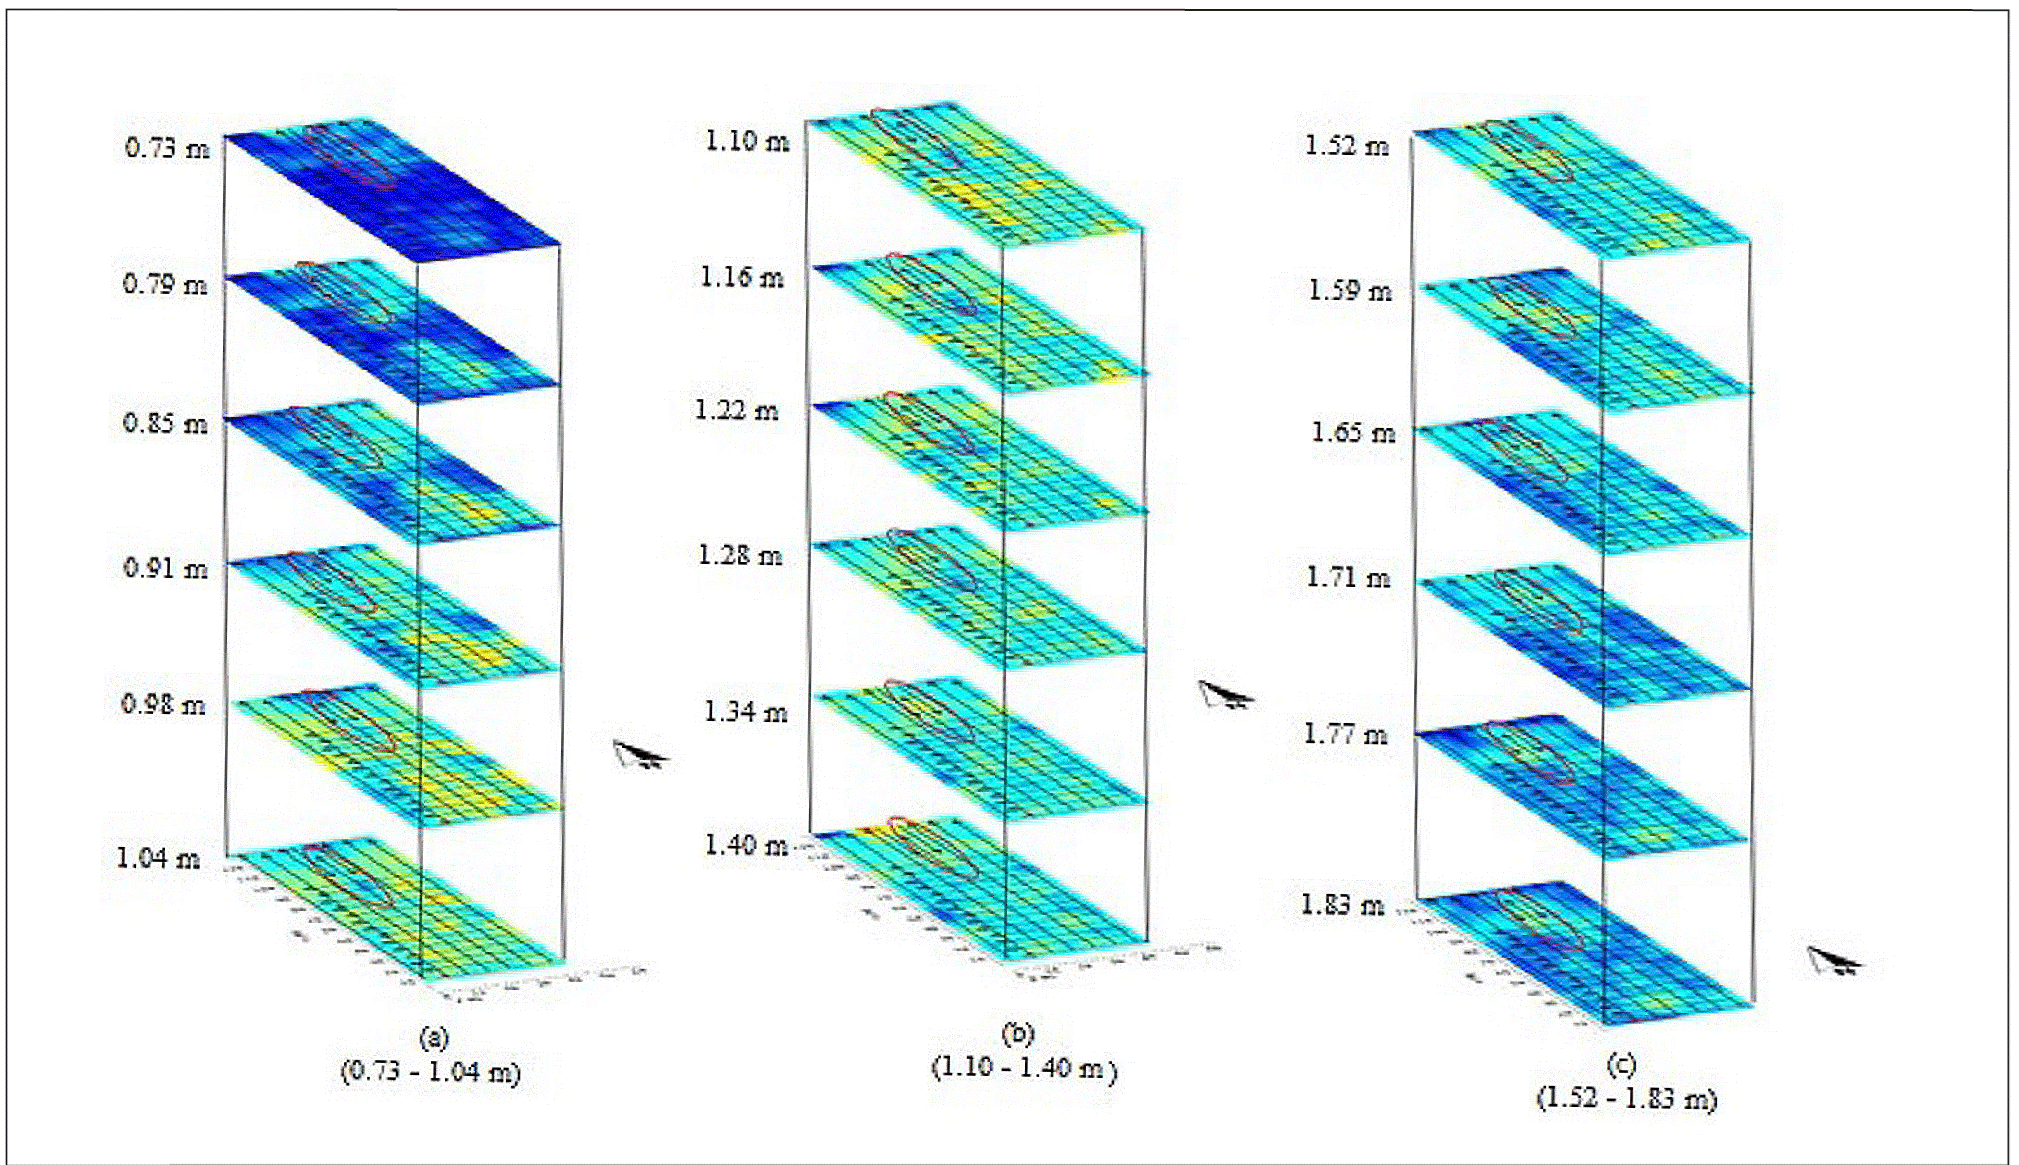
Figure 7 (a-c) Iso depth GPR reflection time slices (a) 0.73 - 0.91 m, (b) 1.10 - 1.40 m, (c) 1.52 -1.83 m with the circle defining the possible location of the tomb.
Conclusion
Variation in subsurface dielectric properties, determined from ground penetrating radar reflection measurements across a burial site claimed by the Christian, Muslim and Traditional believers as the burial place of the biblical Queen Sheba (Bili-kisu Sungbo) in Oke-eri in Ijebu-Ode, southwestern Nigeria, has proved very effective in establishing the occurrence of a grave beneath the cordoned part of this heritage site. The hyperbolic diffraction curves as well as the consistent and relatively high amplitude GPR reflection pattern, though not able to establish who was buried in the tomb, suggest the occurrence of tomb walls, and possible anthropogenic foreign material that is consistent with occurrence of a burial place beneath the cordoned off part of the site.


 nueva página del texto (beta)


