SciELO - Scientific Electronic Library Online

 
vol.69 número2Desing of grating couplers for submicron optical waveguidesExtended Jacobi elliptic function solutions for general boussinesq systems índice de autoresíndice de materiabúsqueda de artículos
Home Pagelista alfabética de revistas  

Servicios Personalizados

Revista

Articulo

Indicadores

Links relacionados

  • No hay artículos similaresSimilares en SciELO

Compartir


Revista mexicana de física

versión impresa ISSN 0035-001X

Rev. mex. fis. vol.69 no.2 México mar./abr. 2023  Epub 05-Nov-2024

https://doi.org/10.31349/revmexfis.69.021304 

Optics

Crystalline native defects in ZnO analyzed by photoluminescence applying Maxwell-Boltzmann statistics in the visible region

M. A. Vicencio Garrido* 

O. R. Portillo Araiza** 

M. Chávez Portillo*** 

O. Portillo Moreno**** 

M. Lozano Espinosa***** 

* CIDS-ICUAP, Universidad Autónoma de Puebla, Av. 14 Sur Col Jardines de San Manuel, Ciudad Universitaria, Puebla, Pue., México.

** Universidad Popular Autónoma del Estado de Puebla, Bachillerato, Plantel Sur, Calle Independencia 6339, Col. Patrimonio, Puebla, Pue. 72450, México.

*** Universidad Politécnica de Puebla, C. Juan Bonilla, Puebla, México.

**** Lab. Mater. Sci. Facultad de Ciencias Químicas, Benemérita Universidad Autónoma de Puebla, Pue., P.O. Box 1067, 72001 México.

***** Conacyt-Universidad Autonoma Metropolitana-Cuajimalpa, Av. Vazco de Quiroga 4871, Santa Fe, 05300 , México.


Abstract

Zinc oxide (ZnO) is prepared by Chemical Bath Deposition (green chemistry) technique at ~ 80.0 ± 2oC temperature. This manuscript continues with previous research examining the Photoluminiecence spectra situated at UV-Vis-egion. In this investigation, three different molar concentrations of the progenitor reagent containing the Zn2+ cation are chosen in order to find the optimal conditions for crystal growth and determine the influence of this parameter on crystal growth. The average grain size and lattice strain using Scherrer’s equation and Williamson-Hall (W-H) method are discussed. The normalized absorbance situated at UV-region, electronic transitions located at ~ 239 nm (~ 5.18eV) and ~ 283 nm (~ 4.38eV) associated with quantum confinement are appreciated. We consider that the inorganic nanomaterial has native defects and the strain is caused by point defects (vacancies and interstices). According to emission bands situated at Vis-region by means of Photoluminescence spectroscopic technique, green (GE) and yellow emission (YE) bands are discussed, which are associated with native defects. The Photoluminescence dependence with the trap density and the surface recombination velocity in the light of the Maxwell-Boltzmann theoretical model (MBM) results associated with the electronic transitions related to the native defects situated at Vis-region are investigated. The trap density cm-3 of nanocrystals located at range ~ 8.9 — 9.9 × 10²³. An approximate theoretical-experimental the kinetic model is shown, considering that the coordination complex ion is a key parameter in the crystal growth of ZnO nanocrystals. The optimized geometry of ZnNH342+ molecule was obtained with the DFT method using the functional of H-GGA B3LYP.

Keywords: Green chemical; kinetic model; quantum confinement; pholuminescence; Maxwell-Boltzmann statistics

1 Introduction

The electron configurations of Zinc (Zn) and Zn2+ cation are [Ar]3d104s2 and [Ar]3d104s0, respectively. Zinc oxide ZnO is a II — IV semiconductor with a large band gap energy located at range 3.18-3.40 eV [1,2], inorganic material that possesses structural properties and requires careful examination to find the correlation with its morphological and optical properties. ZnO it is a semiconductor with important physical and chemical properties for wide application as a base material in the design of optoelectronic devices and biochemical applications [3]. Therefore, is very versatile inorganic material with applications on the optoelectronics devices, based on thin solid films, but also with a significant number of unresolved issues. Detailed studies of the key parameters in the kinetic chemistry of crystal growth for the synthesis of ZnO nanocrystals through theoretical experimental models [4], associated in the evolution of each of the stages that govern the origin in the surface morphology of this inorganic nanomaterial, continues to be a strong challenge for the scientific community [5]. Classical theoretical models propose that for kinetic formalism two mechanisms at crystal growth are: nucleation and autocatalytic growth and was considered to be the only theory of nucleation until formulated an approach of constant slow nucleation followed by autocatalytic crystal growth [6]. The chemical and physical process of the nucleation and growth of nanocrystals have been investigated through the LaMer burst nucleation and following Ostwald ripening to describe the change in morphological characteristics, native crystalline defects and the particles size [7]. Considering the overwhelming synthesis techniques, it is found that ZnO is a very sensitive material to the synthesis technique, which leads to presenting different morphological, structural and optical properties. Another serious problem is the incorporation of different pollutants of different sizes are directly and indirectly that are inevitably incorporated into the matrix of this inorganic material [8]. Morphology is decisive and drastically governed by crystal growth parameters, in particular ZnO presents different, impressive and wonderful morphologies associated directly with the growth parameters as well as with the applied technique [9,10] It is of utmost importance to understand the wide range of theoretical and experimental chemical and physical techniques in the synthesis of nanocrystals and in particular of ZnO. In this way, the limitations in the synthesis promote a greater knowledge and with more clarity, from there it is possible to predict the properties that this nanocrystals possesses. Nanocrystals form the bulk of ZnO research trends due to their ease of chemical and physical using a wide array of methods enabling the synthesis with many shapes and sizes; nanospheres, nanocactus, nanonanoplates, nanorods, nanodendrites, nanotubes, nanoshells, nanoneedles, nanoribbons, nanobelts, nanosheets, nanopyramids, nanotowers, nanocombs, nanorings, nanosprings, nanowires, nanocages, nanopencils, etc. [9]. The chemical phenomenon is explained considering that is often driven by both interparticle electric interactions and the influence of the ionic environment, and it here different from bulk due to electric interactions with the nanocrystals surface. The environment of nanocrystals can be sensitively influenced by local ions and/or ligands, with effects already occurring at low concentrations of progenitor reagents. The ionic electrical interaction of particles present in the aqueous solution, is an important parameter which is associated with the typical short and long range van der Waals electrical forces. On the other hand, the growth of nanocrystals by oriented attachment is frequently reported as a method supplementary to the classical growth by Ostwald ripening process [11]. The classical model and non-classical crystallization pathways, in which particles: ions, cations, coordination complex cations, ionic clusters, amorphous precursors, poorly crystalline nanoparticles and nanocrystals, among others, have been investigated [12]. It is found that the crystalline morphology is different and interesting (in some cases they are amorphous materials) and the origin of this morphological behavior, is currently and since the past in deep investigation by the scientific community [13]. We present in this manuscript, a chemical kinetic model that allows us to understand in a simple way the key stages in the chemical synthesis of the crystal growth of ZnO nanocrystals. The inorganic nanomaterial is synthesized in a thin solid film format applying the Chemical Bath Deposition (CBD) technique. We further note that in this study we used the experimental results previously published [14]. Using the spectra obtained through the Photoluminescence spectroscopic technique located at UV-Vis region, the emission bands are assigned to crystalline defects associated with vacancies, intertices, stacking faults, different pollutants, stoichiometry, etc., are examined to find the correlation of these emission signals with the native crystalline defects [15]. Applying the theoretical model of Maxwell-Boltzamann statistics (MBM), the native defects are associated with vacancies/interstices, which in a first approximation are considered as particles that present corpuscular behavior [16].

2 Experimental

2.1 Kinetic model in the chemical synthesis of ZnO nanocrystals

The Chemical Bath Deposition (CBD) technique, has been successfully applied at chemical synthesis of nanocrystals because it is versatile and relatively inexpensive, in which the chemical parameters of crystal growth are easily experimentally controlled [17]. Previous report, we systematically presented experimental details on the chemical synthesis to prepare rare earth and oxide-hydroxide transition metal and semiconductor nanocrystals [14,15,18]. The key chemical and physical parameters in CBD technique are systematically investigated with the aim of locating optimal conditions in small ranges of reaction temperature, dilute concentrations of precursor reagents, pH, etc. [14,15,17,18,19]. The chemical synthesis, is carried out in small temperature range located at 20 — 90 ± 2oC, kinetic mechanism presents by us is based on the indirect chemical synthesis of coordination complex MNH342+ ion M=Pb2+,Cu2+,Ni2+,Zn2+,Bi3+,Er3+, etc. ). The kinetic model we consider in crystal growth, present an interesting structural phenomenon associated with the molecular distortion Jahn-Teller effect (JTE), which favors the synthesis of nanocrystal [20]. We propose the following key stages (i) creation of ZnNH342+ ion in aqueous solution, at alkaline medium in which Zn(OH)2(aq) nanocolloids are generated. The step is simple by direct addition of salt containing Zn(OH)62+ cation and direct combination of KOH, which generates the alkaline medium (pH ~ 8.3), (ii) the white suspension turns colorless when adding NH4NO3 solution, which contributes NH3 molecules and the indirect creation of the coordination complex ZnNH342+ cation, under these reaction conditions due to incubation period of the nanocoloids and the slow release of NH3 molecule with the formation of ZnO nanocrystals in the final stage crystal growth. Next, we present the chemical reactions associated with the energetic changes of Gibbs free energy ΔG0, accoding to ΔG0=-nετ equation, where: ΔG0 represents the free energy of Gibbs, ε0 half-cell potential [21,22] n the number of equivalents (electron exchange) and τ is a numerical constant value (τ96,500 V/equivalents) [23]. The chemical equilibria are proposed, the molar concentration (MC) of the precursor reagents: ~ 1.0M, ~ 2.0M and ~ 3.0M, chemical parameter investigated here. The equilibria reactions for the crystal growth of ZnO nanocrystals, we propose the following stages

Zn2++2e-Zn

ΔG0=+147.20 kJ, (1)

ZnO22-+2H2O+2e-Zn+4OH-

ΔG0=+234.49 kJ, (2)

ZnOH+H++2e-Zn+H2O

ΔG0=+95.92 kJ. (3)

At the chemical synthesis, it is proposed the coordination complex Zn(OH)62+ cation, have undergone a fast transformation into ZnNH342+ cation, which is supported by chemical mechanisms that could explain the transformation: dissolution, in situ crystallization and/or transformation of solid-solid phase of ZnO product. On the other hand, the ZnO22- ion, is dissolved in the aqueous solution to form the coordination complex ZnNH342+ cation at basic solution (pH ~ 8.3), where these growth units dehydrate when they are incorporated in the crystal growth [24]. Generally, chemical balances are presented in a compact and straightforward way and it is possible to apply Hess’s law, which allows us to carry out in a convenient and adequate way; addition and/or subtraction, change of direction of chemical reactions, etc, [25].

According to Hess’s law, we proceed to arrive at the final product

ZnOH++H++4OH-Zn(OH)42-+H2O

ΔG0=-288.15 kJ, (4)

ZnO+H2O+2e-Zn+2OH-

ΔG0=+243.18 kJ, (5)

Zn2++4OH-ZnO22-+2H2O

ΔG0=-87.29 kJ. (6)

The intermediate complex of coordination ZnNH342+ cation, releases slowly NH3 molecules, presenting the following chemical equilibria:

ZnNH342+Zn2++4NH3ΔG0=+53.30 kJ. (7)

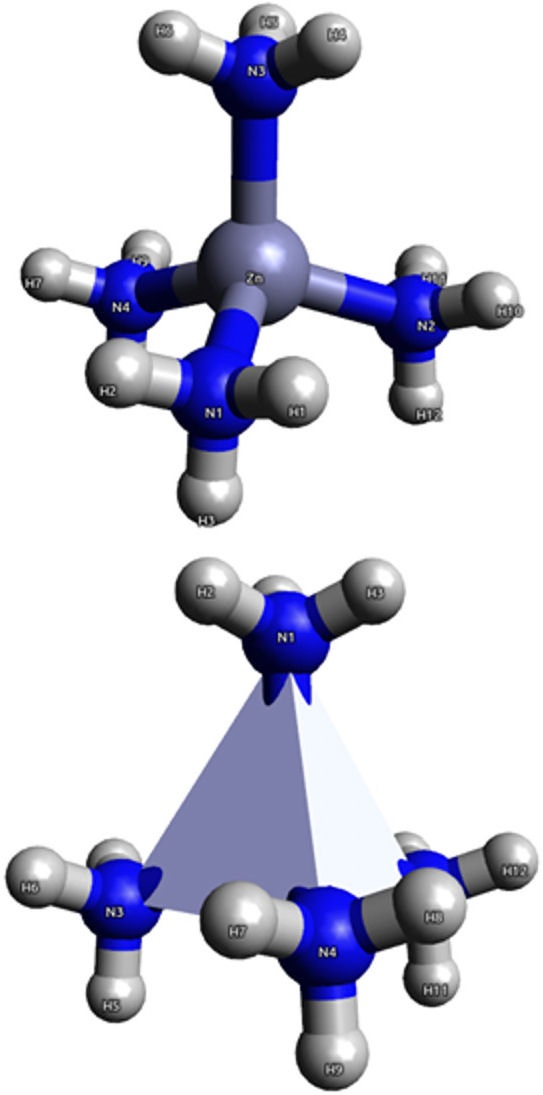
From (7) it is observed that ΔG0>0, the slow release of Zn2+ ion is favored, this is a key parameter to control the spontaneous precipitation of ZnO product. Figure 1 shows the spatial distribution of NH3 ligands (L) of the complex intermediate ZnNH342+ cation. The optimized geometry of ZnNH342+ molecule was obtained with the DFT method using the functional of H-GGA B3LYP [26]. The basis set B2 (also called WH3f) is specifically optimized for the Zn atom by Amin et al., [27]. The molecular configuration of ZnNH342+ cation with greater relative thermodynamic stability according to our theoretical calculations, corresponds to tetrahedral geometry. The Zn2+ cation is located at central part at tetrahedron, in which L=NH3, are situated at the vertices with a coordinated covalent bond according to the valence bond theory. It is important to mention that for the case of the Cu2+ complex cation, in which the most thermodynamically stable molecular configuration corresponds to the planar-square, which undergoes molecular distortion due to the JTE effect [20]. We propose the formation of ZnNH342+ cation (intermediately generated coordination complex), according to the chemical equilibrium in Eq. (7) in which the NH3 molecules are released slowly, the Zn2+ cation also combines slowly to form O-Zn-O chemical bonds, which are thermodynamically stable to finally reach the ZnO product. The tability of metal complex increases with decrease in size of the metal cations. Ionic radii of Zn2+0.60 Å cation and CO32-(1.62Å), S2-(1.84Å) ions [28]. These findings highlight the impact of the presence of H2O on the interaction of Zn2+ cation and NH3 molecules, in aqueous ammonia solution, which is an limitation with the hard/soft Lewis acids and bases classification of H2O being a hard L associated at NH3, which is attributed as being soft. Experimental and theoretical studies have been widely employed to explore the chemical properties of solvated ionic species, and in particular to study molecular structure, ion-solvent distance, coordination number and L exchange, conformational changes of the solvation complex [29].

Figure 1 The spatial distribution of NH3 molecules (Ligands) of the complex intermediate ZnNH342+ ion. 

On the other hand, the equilibrium constant keq of ZnNH342+ ion, provides us with semi-empirical information regarding the thermodynamic stability of cation and is related to the concentrations of the ligands (L). In this particular case are; L=NH3 is molecule monodentate according to the following expression [30]

keq=ZnNH342+Zn2+NH344.6×1017. (8)

As mentioned above, in our conditions the following chemical equilibria are proposed:

ZnNH342++4OH-ZnO22-+2H2O+4NH3

ΔG0=-28.97 kJ. (9)

Adding the chemical (1) and (5) equilibria

Zn2++2OH-ZnO+H2ΔG0=-95.98 kJ. (10)

The precipitated white powder corresponds in a first stage, which synthesis chemical was carried out with Zn2+ catiion (in aqueous solution), obtaining hydrozincite Zn5CO32(OH)6, which stoichiometrically blends Zn(OH)62+ (hexahydrated cation) and ZnCO3[31]. The process chemical might incorporate many chain reactions leading ZnO formation in solid state

ZnNH342++ZnO22-2ZnO(s)+4NH3+2e-

ΔG0=+7.13 kJ. (11)

Hydrolysis of thiourea at room temperature (RT), provides CO32- and HS-ion, which are identified by FTIR studies [32,33]

SCNH22+3H2OCO32-+HS-+NH3. (12)

On the other hand, according to the experimental results of XRD previously reported in the structural investigation of ZnO product [14], the crystalline Zn5CO32(OH)6 (product) is identified in quantities not quantified by XRD technique. The chemical equilibria presented by the formation of the pollutant is shown below

ZnNH342++5ZnO22-+CO32-+5OH-

ZnO+4NH3+2e-+Zn5CO32(OH)6. (13)

The synthesis of the green chemistry CBD of inorganic materials has been previously reported [14]. However, we will briefly point out some of the strategic steps that we applied in the chemical synthesis of samples. The CBD technique is reduced to preparing three solutions at MC of ~1.0 M, ~ 2.0 M and ~3.0 M of ZnNO325H2O salt provided by Zn2+ cation. All precursor reagents were analytically pure and used as received without any further purification were of ~99.9% purity (Baker). The following progenitor reagents are held constant: KOH(0.5M),NH4NO3(1.5M) and SCNH22. The time of deposition is ~1.0 h while maintaining the T ~ 80 ± 2oC temperature. The glass substrates were previously immersed in HCl/H2O for 2.0 h; after which they were rinsed in distilled water and dried in a clean hot-air flow. The substrate cleaning was carried out by immersing them into an acid-chromium mixture K2Cr2O7/HCl/H2O for 24.0 h and then rinsing them in deionized water. The thin solid films were labeled: ZnO-A,ZnO-B and ZnO-C samples, according to MC1.0M,2.0 M and 3.0 M, respectively. All the films are white and the porosity decreases with the increase at MC. The samples are repeatedly washed with deionized water (1.8MΩ) to remove impurities that are generally suspended in the solution and these adhere weakly on the crystals. The Photoluminescence (PL) spectra was characterized by a main peak, under optical excitation provided by an Ar+ laser beam, with a pump power of 10,350nm as excitation, using a Science-Tech model 9040 apparatus.

3 Discussion

In this manuscript, we continue to investigate the systematically obtained experimental results of ZnO synthesized by the CBD technique, to investigate the correlation of morphological, structural and optical properties with the aim of systematically applying the Maxwell-Boltzmann theoretical model (MBM), considering how first approximation that the different crystalline defects (vacancies and intertices) behave as free particles.

The nanocrystals labeled by the ZnO-A,ZnO-B and ZnO-C symbology, were investigated applying systematically SEM, XRD, optical absorption and Photoluminescence (PL) technique previously reported [14]. The percentage composition expressed in % of atoms (stoichiometry), is quantified in ZnO-A: Zn67.65,O32.35,ZnO-B:Zn44.18,O 76.38 and ZnO-C:Zn49.70,O50.30 samples. Morphological images were obtained by Scanning Electron Microscopy (SEM) of ZnO-A, ZnO-B and ZnO-C thin solid films. Here, we analyze the different morphologies and their correlation with the optical properties that these materials present. The ZnO-A sample presents spongy morphology with cavities of different sizes. ZnO-B film has well defined crystals of long micro-javelins and ZnO-C sample, morphological images of tetrapod is presented. It is shown that the MC of ZnNO3 in our experimental conditions of precursor reactants, temperature, stirring are constant, with different MC therefore, it is a key parameter that significantly modifies the stoichiometry and morphology of thin solid films. According to (JCPDS card No. 36-1451) standards the hexagonal phase is identified. However, some structural differences are observed and compared with each other. Zn-A and Zn-B samples, broadening of crystalline planes with respect to Zn-C sample, is observed. The characteristic thing in Zn-A and Zn-B samples, is the emergence of a crystalline plane at angular position located at 2θ32.85, corresponds to Zinc-hydroxyl-carbonate Zn5CO32(OH)6 (Zinc hydrocincite) according to (No. 04-013-7572) standards. The MC increase in ZnO-A and ZnO-B samples, produces a decrease at relative intensity of the (002) reflection plane, reaching a relative maximum at Zn-C sample. A reflection associated with the crystalline plane of Zn5CO32(OH)6 material, is observed. Structural behavior, with increase of 3.0M of the salt containing the Zn2+ cation, favors the thermodynamic stability of the nanocoloids and the crystalline growth of the free ZnO(s) of Zinc-hydroxyl-carbonate pollutant. The grain size (GS) presented the following numerical values: Zn-A33.4 nm,Zn-B36.5 nm, and Zn-C34.2 nm, resspectively. The addition of thiourea, the mixture could result in strong electrostatic interaction with the polar surfaces of growing ZnO nanocrystals thus resulting in decreasing the energy of polar surfaces and hence slowing down the growth rate of the polar planes being the exposed basal surface of the nanocrystals which grows slowly with well developed facets, the intrinsically anisotropic growth of ZnO along the (002) oriemtation is substantially suppressed and crystal growth then proceeds sideways, which results in the formation of Zn-A and Zn-B spongy morphology with cavities of different sizes [35]. In crystalline growth they are identified as pollutants and generally adhere to the surface and in general to the volume of nanocrystals in quantities not yet quantified. Structural parameter called strain (ε) is evaluated by applying the experimental of XRD results. Williamson-Hall method was applied. The grain strain is related to the measured FWHM (β) of the diffraction plane by following βcosθ=λ/GS+ελsinθ equation, λ and θ are wavelength of the X-ray source and Bragg’s angle, respectively [36]. The plot of ε vs. sinθ for ZnO-A,ZnO-B and ZnO-C films, the slope of the plot gave the amount of residual ε. The lattice constant c of ZnO-C films is larger than the ZnO-A and ZnO-B and all the films exhibit tensile ε,ZnO-A(002) plane position was shifted to higher angle (2θ) as well as the increase in the intensity of the crystalline planes with increasing at MC. The variation of c with increasing MC suggests that the compressive stress is generated during deposition due to MC which according to the low MC induces structural defects; thickness, roughness, grain boundaries, and stacking faults are parameters associated with stress [37]. The increasing MC increases the atomic mobility and reduces the structural defects, and thus a relaxation of ZnO-C film. Thus, the extrinsic stress will not be present and the total estimated stress values must be to dominantly intrinsic. Also, the decrease in residual stress might be brought about by release of defects, such as interstitials.

Figure 2 Normalized absorbance spectra of of ZnO-A, ZnO-B and ZnO-C thin solid films ZnNH342+ ion. 

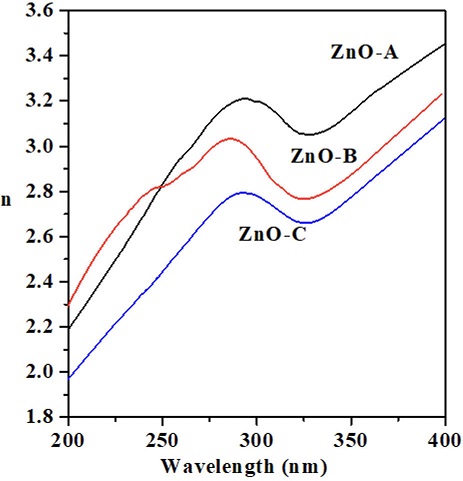
Optical propertie were investigated through the refractive index n(λ) from the reflection coefficient and the optical extinction data, following the Fresnel equation [39]. Figure 3 displays the real of n(λ) spectrum of ZnO-A,ZnO-B and ZnO-C nanocrystals. The refractive was calculated using Eq. (5)
n=1+R1-R+4R1-R2-k2. (14)

Figure 3 Real refractive index n(λ) spectrum for of ZnO-A, ZnO-B and ZnO-C nanocrystals ZnNH342+ ion. 

To determinate the values of extinction coefficient (k) we used the following equation:

k=αλ4k. (15)

The data were recorded in the wavelength range 200-400nm absorption, and then the optical data were used to calculate the n(λ) using an angle of incidence of 30.

The electronic transitions of greater relative intensity are seen at ZnO-A and ZnO-B nanocrystals. A plausible explanation is proposed; ZnO-A and ZnO-B samples has a high concentration of native defects. The observed absorption bands can, in principle, be justified by the optical and structural phenomena and electronic transitions locted at UVVis, native defects as vacancies, grain boundaries, stacking faults, stoichiometric and quantum confinement effect [40]. It has been ascribed to a slight deviation of the local symmetry of the Zn2+ ion induced by the CO32- and OH- ions modifiers for O2- ion, such differences in the optical properties arising from the ZnO-A and ZnO-B electronic transition. The absorption bands intensity was found to increase with the concentration of the -OH. The presence of -OH groups induces a greater relative intensity in the absorption bands and the values agree with those already reported [ 41]. It can be related to the decrease in GS causes more atoms to be closer to the surface and thereby increasing the rate of trapping of photogenerated holes h+ at the surface, which in turn enhances the emission intensity. The n(λ) exhibits anomalous dispersion in the near-UV region, associated with the steep onset of absorption. In the Vis-region, the values are comparable for all three samples, i.e. they range situated at range 2.2-2.3eV. These are compatible with earlier results for pure ZnO film [42,43]. We can observe, that the n(λ) for all samples lncrease when the λ increase. This phenomenon is attributed to light scattering and to the increase of absorbance.

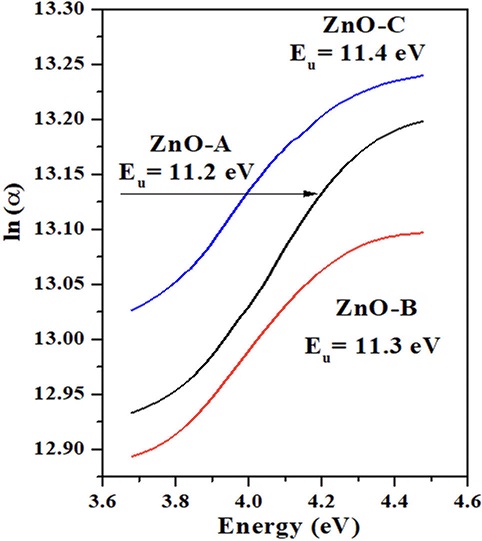
Urbach’s energy Eu has a strong experimental theoretical form for the study of crystal lattice defects, these are generally associated with crystalline disorder (which can be ionic, atomic and/or molecular). Analyzing the structural behavior, it has been found that for a wide variety of inorganic solid crystals, the energies quantify the static, structural disorder causing localized exponential-tail states, and dynamic disorder from electron-phonon ( e-- h+) scattering. The theoretical model Eu is powerful and allows us to examine the degree of of optical absorption generated by crystal defects. It has been found that that sub-gap absorption due to singlet excitons is universally dominated by thermal broadening at low photon energies and the associated Urbach energy equals the thermal energy, regardless of static disorder [44]. The studies of the Eu parameters allow us to extract opticalinformation associated with the crystalline disorder, stacking faults, stoichiometry, and disordered crystalline grain boundaries, GS, orientation of crystalline planes, among other parameters related tocrystal growth, resulting in the formation of confined situations into the Eg energy. The absorption spectra, α(v) are used to define the Eu corresponding to the electronic intratransitions between the extended states of the valence band (VB) and the localized states of the conduction band (CB). In the low energy photon (hv) regime, it is assumed that the spectral dependence of absorption edge follows the empirical Eu given by α(v)=α0exphv/Eu equation [45], where α0 is a constant, Eu denotes an energy which is constant or weakly dependent on temperature and is often interpreted as the width of the tail of localized states in the Eg. Figure 4 displays the ln(α) as a function of energy (eV) spectra of ZnO-A, ZnO-B and ZnO-C films.

Figure 4  ln (α) as a function of energy eV spectrum of ZnO-A, ZnO-B and ZnO-C samples [Zn(NH3)4]2+ ion. 

It has been recently reported that the Eu does not correlate with the topological disorder in ZnO nanocrystals [46]. The absorption edge fluctuations are linked to the variations of the Eg, the width of Urbach tails. From these spectra, it can be seen that the optical absorption edge shifted to higher λ(nm). This was attributed to decrease in GS, preferred orientation and stoichiometry. The defects and disorders may lead to forming a delocalized state near the band level and the enhancement of the Eu value. The structural motif for the localization of the mid-gap states is a crystalline-like atomic environment within the amorphous network. Therefore, these mid-gap states trap an extra electron spontaneously, creating deep traps in the Eg [47]. Urbach energy was calculated as Eu11.2 eV for Zn-A,Eu11.3 eV and Zn-C11.4 eV, respectively. In our opinion, Eu increacrease is associated with increacrease in native crystalline defects and impurities, resulting in a nanomaterial with major disorder and major density of localized states. Research related to the optical behavior of the Eu originates from Eg fluctuations attributable to chemical composition variations at nanoscale, while electrostatic fluctuations contribute significantly.

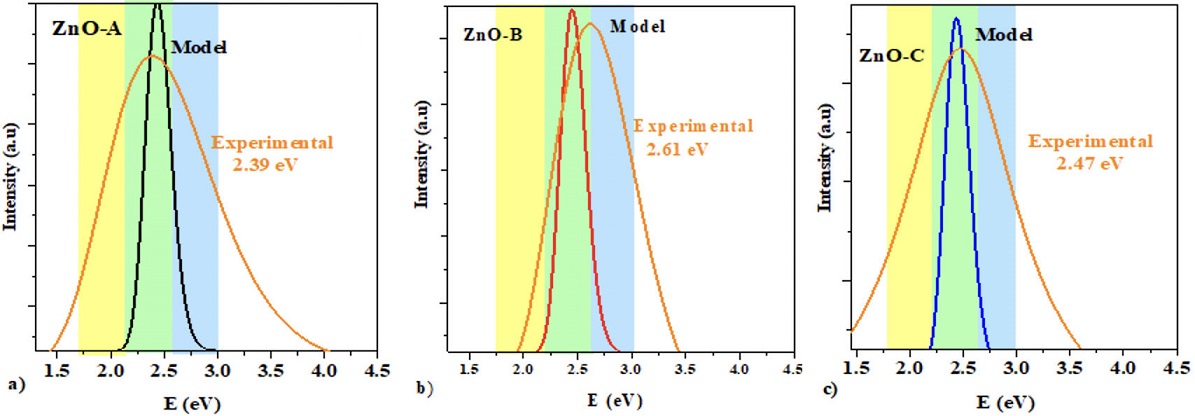
The photoluminescence (PL) spectroscopy technique, is applied in research of the band edge electronic transition levels of a material have been performed by many research groups [48]. We present a previous study applying the technique of PL located at UV-Visregion with the aim of investigating the green (GE) and yellow (YE) emission bands, respectively [14]. Generally, native defects located at UV-Vis region by means of PL technique and recorded at range 1.5-3.0 eV was carried out by deconvolution, is observed that different emission signals are overlapping with other energy levels and PL measurements indicate GE band at 495 nm (2.50 eV) [49]. Shallow acceptor levels are created at 0.3-0.4 eV above the top of the valence band (VB) due to zinc vacancy VZn and oxygen interstitial Oi, respectively [50]. Figure 5 shows the theoretical and experimental PL spectra of (a) Zn-A, (b) Zn-B and (c) Zn-C manocrystals. The experimental emission band recorded here, they are asymmetric implies different signals overlapping each other. We performed an analysis of nanocrystal emission bands located at UV-Vis region, applying the statistical theoretical model based on Maxwell-Boltzmann (MBM) distributions, in this context, several detailed studies have been carried out [15,16, 51]. The emission band applying the MBM is indicated by a sky blue stripe. The emission band at (2.25 eV) may be related to deep level defects [52]. The emission band situated at 607 nm ( 2.04 eV), is known YE band in ZnO [53]. PL results from the recombination of a photogenerated hole h+ with the electron (e e- occupying oxygen vacancies site. Oxygen, in general, exhibits three types of charge states of oxygen vacancies. GE band has been proved to be an outcome of singly oxygen vacancies in the sequence of (VO0,VO+ and VO2+) located below the bottom of the conduction band (CBD). The emission band is produced by the recombination of delocalized electrons close to the CB with deeply trapped holes in the Oi- point defect level. The deep level emission is known to be related to intrinsic VZn,VO, or Zni) and extrinsic (acceptor) point crystal defects. Vis-emission bands is also reported from ZnO nanocrystals owing to various crystal defects. Zinc interstitial Zni produces a shallow donor level at 0.5 eV below the bottom of CB. In our cases, we observed PL emission in the Vis-region which indicates that the emission band in this case is governed by the crystal defects related deep level emission over the band edge UV-emission [54]. The Vis-emission band at 485 nm ( 2.55 eV) arises due to electronic transition between interstitial zinc Zni and zinc vacancy Vzn level arises due to transition between Zni and Vzn level [50]. The emission band 527 nm ( 2.3 eV) can be related to singly ionized oxygen vacancy Vo. It is also reported that the defect-related PL emission dominates for the nanorods of high-aspect ratio as compared to that of bulk because of more number of surface states and incorporation of pollutant. According to these experimental results we observed that our material presents contribution of defects associated with GE and YE bands. This is confirmed by the spectrum of optical absorption and morphological images obtained by SEM. The emission band associated at the amount of interstitial oxygen (O i-), and according to the studies obtained by SEM technique, it is appreciated that samples ZnA amd Zn-B present a lower amount of oxygen with respect to Zn-C, which is almost stoichiometric ( Zn/O1). Therefore, the emission bands must show a significant change as seen here. GE and YE bands is observed at 600-450 nm (2.06-2.75 eV) which is attributed to the amount of nonstoichiometry, producing intrinsic defects in the material that may originate from the Vzn and anti-site defect in the ZnO. Howeber, VO would be the dominant intrinsic defect under both Zn-rich and O-rich conditions and it is a deep double donor. The red emission (RE) band has been related to the Zni which causes a lattice disorder along c-axis, introducing shallow donor levels [4]. It seems that the band could originate from a donor acceptor pair transition. Chemical pollutants may also cause a surrounding of structural defects by distorting the lattice as well as the surface of a nanocrystal. The trap-states may be caused by the thermal fluctuations of the molecules, which are expected to result in shallow trap states within the Eg [55]. The UV emission for the bulk ZnO is detectable only at very low temperature but for the tetrapod-shaped ZnO (Zn-A sample) it was detectable even at room temperature owing to mainly two reasons (i) first being the high quality and lesser impurities and structural defects in ZnO tetrapods and (ii) is related to the quantum confinement effect in nanocrystals [48]. A remarkable difference in response from a group of randomly oriented tetrapods and a single tetrapod oriented that one of its arm is aligned parallel to the incident laser beam. The reason for the broad Vis-emission band is that ZnO tetrapod have a large surface to volume ratio. This difference in optical behavior is reasoned on the basis that the vertical leg of the aligned tetrapod behaves like a Fabry-Perot resonant cavity, the essential reason for high-directivity antenna with different superstrates can be revealed in terms of the Fabry-Perot resonant theory [56].
I(E)α(E)E2exp-E-EgKBT. (16)

Figure 5 Theoretical and experimental PL spectra of a) Zn-A, b) Zn-B and c) Zn-C thin solid film The distribution of particles is reflected by time resolved, in this equation the absorption coefficient and the Maxwell-Boltzmann statistical function Eq. (17) provided with exponential term, with describes the energy variation of the density traps. The MaxwellBoltzmann distribution of carriers was reflected in the time resolved where is the PL intensity, is the energy dependent absorption coefficient, is the bandgap energy of ~ 3.0 eV and k is the Boltzmann constant. The Maxwell-Boltzmann stastical fiting energy function cand be obtained by ZnNH342+ ion. 

Maxwell Boltzmann theoretical model (MBM), shown in Fig. 6. Table I presents the trap density cm-3.

Figure 6 Trap density of Zn-A, Zn-B and Zn-C thin solid film ZnNH342+ ion. 

Table I Trap density cm-3 of Zn-A,Zn-B and Zn-C nanocrystals. 

Sample Density traps (cm-3)
ZnO-A 8.9 × 10¹³
Zno-B 9.3 × 10¹³
ZnO-C 9.9 × 10¹³

Trap density can be obtained by the following equations:

Nt=1τp0τn0σpσnvth,

where τp0 and τn0 are the lifetime of charge carriers, σ is the cross caption section, vth is velocity due thermal increment.

These experimental results are generally concerned with high lifetimes [15,16]. The presence of a detectable PL emission bands in the nanocristal, characterized by the presence of ZnO, demonstrates that Zn2+ cation are already optically active in this crystalline configuration. Surface recombination varies widely even in the high-lifetime regime because it depends on the surface’s state, i.e., bare, passivated, contaminated, polarized of π-cloud, etc. The Zn-A and Zn-B samples show a small shift towards lower photon energy (hv), which is associated with a higher concentration of native defects as well as impurities identified by XRD and SEM. In other words, this phenomenon is associated with the hybridization (sp) of orbitals generating the π-cloud of delocalized electrons, phenomena has not been properly appreciated [57]. The molecular configuration of these inorganic materials presents the criteria that are based for the existence of π-delocalized electrons (delocalization of π-electron cloud) associated with the conjugated bonds external electromagnetic radiation produces a strong distortion of the polarization of the π-electronic cloud, which also generates significant changes in the electronic transitions in this solid nanomaterial [58]. The interesting part of inorganic material associated with this planar configuration focuses on the short-range van der Waals electrostatic interactions produced by the distortion in the π-electronic cloud of the functional group of Zinc-hydroxylcarbonate (> C=O … H-O-C-Zn-) pollutants. One approach to address these issues consists of growing high-quality single crystalline bulk and thin films in which the concentrations of impurities and intrinsic defects are controlled. A very interesting study has been published in which they apply the theory of doping and native defects in ZnO based on densityfunctional calculations, discussing the stability and electronic structure of native point defects and impurities and their influence on the electrical conductivity and optical properties of ZnO [59].

4 Conclusions

The search for the optimal conditions to prepare ZnO in a direct and simple way, present a greater scientific advance every day. Applying the appropriate technique in the synthesis of ZnO, the main objective is to have interesting morphological, structural and optical properties for its possible application. Considering the optical property, it is found that the PL signals recorded in the Vis-region of the spectra are associated with native defects. These are in turn associated with vacancies, intertices. It is well known that the origin of the aforementioned PL emission bands is still in a deep scientific debate. However, from the multiple reports on ZnO made by various research groups, they are identified and carefully examined through theoretical-experimental studies. We found a drastic and marked difference in the theoretical-experimental PL emission signals, with respect to those recorded by the MBM. In this theoretical model, the effect of other defects was not considered. However, it is applied here as a first approximation.

References

1. E. Ley-Koo, Recent progress in confined atoms and molecules: Superintegrability and symmetry breakings, Rev. Mex. Fís. 64 (2018) 326, https://doi.org/10.31349/RevMexFis.64.326. [ Links ]

2. J. d. O. Primo et al., Synthesis of zinc oxide nanoparticles by ecofriendly routes: adsorbent for copper removal from wastewater, Frontiers in Chemistry 8 (2020) 571790. [ Links ]

3. M. A. Borysiewicz, ZnO as a functional material, A Review, Crystals 9 (2019) 505. [ Links ]

4. R. Viswanatha, H. Amenitsch, and D. Sarma, Growth kinetics of ZnO nanocrystals: a few surprises, Journal of the American Chemical Society 129 (2007) 4470. [ Links ]

5. K. Eden et al., Competition between primary nucleation and autocatalysis in amyloid fibril self-assembly, Biophysical journal 108 (2015) 632. [ Links ]

6. N. T. Thanh, N. Maclean, and S. Mahiddine, Mechanisms of nucleation and growth of nanoparticles in solution, Chemical reviews 114 (2014) 7610. [ Links ]

7. Z. L. Wang, Zinc oxide nanostructures: growth, properties and applications, Journal of physics: condensed matter 16 (2004) R829. [ Links ]

8. L. Qin et al., Economic Friendly ZnO-Based UV Sensors Using Hydrothermal Growth: A Review, Materials 14 (2021) 4083. [ Links ]

9. D. Cao et al., Preparation of ZnO nanoparticles with high dispersibility based on oriented attachment (OA) process, Nanoscale research letters 14 (2019) 1. [ Links ]

10. H. Pan and R. Tang, Towards an understanding of crystallization by attachment, Crystals 10 (2020) 463. [ Links ]

11. L. B. Gower, Biomimetic model systems for investigating the amorphous precursor pathway and its role in biomineralization, Chemical reviews 108 (2008) 4551. [ Links ]

12. M. C. Portillo et al., Structural and optical properties of ZnO nanocrystals growth by the chemical bath deposition, Optik 157 (2018) 125. [ Links ]

13. L. S. de la Rosa et al., Maxwell-Boltzmann statistics to elucidate the luminescent emission bands in Co(OH)2 and Co3O4 nanocrystals, Optik 227 (2021) 165473. [ Links ]

14. D. Gutiérrez-Argüelles et al., Maxwell-Boltzmann statistics applied in the study of photoluminescent emission bands in the (S)-(-)-1-(4-bromophenyl)-N-1, 2, 3, 4-(tetrahydro-1-naphthyl) methanimine organic crystals, Optical Materials 96 (2019) 109307. [ Links ]

15. M. C. Portillo et al., Structural properties of sulfur copper (CuS) nanocrystals grown by chemical bath deposition, Optik 208 (2020) 164518. [ Links ]

16. M. Mora-Ramírez et al., Optical emission bands of Sm2O3 and their link with crystalline defects and 4fd → 4fd electronic transitions at UV-Vis region, Optik 241 (2021) 167211. [ Links ]

17. O. P. Moreno et al., Jahn-Teller effect analysis at coordination complex ZnNH342+ ion, growth by green synthesis in CuS nanocrystals, Optik 251 (2022) 168470. [ Links ]

18. G. Milazzo, S. Caroli, and R. D. Braun, Tables of standard electrode potentials, Journal of The Electrochemical Society 125 (1978) 261C. [ Links ]

19. A. Baran, R. Parsons, and J. Jordan, Standard Potentials in Aqueous Solution, IUPAC (1985). [ Links ]

20. J. E. Brady, N. D. Jespersen, and F. A. Senese, Chemistry: the study of matter and its changes (John Wiley & Sons, 2009). [ Links ]

21. E. A. A. Júnior et al., Synthesis, growth mechanism, optical properties and catalytic activity of ZnO microcrystals obtained via hydrothermal processing, RSC advances 7 (2017) 24263. [ Links ]

22. T. W. Davis, A common misunderstanding of Hess’ law, Journal of Chemical Education 28 (1951) 584. [ Links ]

23. K. Raghavachari, Perspective on Density functional thermochemistry. III. The role of exact exchange, Theoretical Chemistry Accounts 103 (2000) 361. [ Links ]

24. E. A. Amin and D. G. Truhlar, Zn coordination chemistry: Development of benchmark suites for geometries, dipole moments, and bond dissociation energies and their use to test and validate density functionals and molecular orbital theory, Journal of Chemical Theory and Computation 4 (2008) 75. [ Links ]

25. J. Liu et al., Probing the coordination properties of glutathione with transition metal ions (Cr2+, Mn2+, Fe2+, Co2+, Ni2+, Cu2+, Z2+, Cd2+, Hg2+) by density functional theory, Journal of biological physics 40 (2014) 313. [ Links ]

26. S. R. Galle Kankanamge and D. G. Kuroda, Molecular structure, chemical exchange, and conductivity mechanism of high concentration litfsi electrolytes, The Journal of Physical Chemistry B 124 (2020) 1965. [ Links ]

27. D. Banerjea, T. A. Kaden, and H. Sigel, Enhanced stability of ternary complexes in solution through the participation of heteroaromatic N bases. Comparison of the coordination tendency of pyridine, imidazole, ammonia, acetate, and hydrogen phosphate toward metal ion nitrilotriacetate complexes, Inorganic Chemistry 20 (1981) 2586. [ Links ]

28. D. Navas et al., Controlled dispersion of ZnO nanoparticles produced by basic precipitation in solvothermal processes, Heliyon 6 (2020) e05821. [ Links ]

29. K. S. Ramaiah et al., Structural and optical investigations on CdS thin films grown by chemical bath technique, Materials chemistry and physics 68 (2001) 22. [ Links ]

30. H. Gullu et al., Temperature-dependent optical characteristics of sputtered Ga-doped ZnO thin films, Materials Science and Engineering: B 263 (2021) 114834. [ Links ]

31. O. P. Moreno et al., CeO2+ nanoparticles growth by chemical bath and its thermal annealing treatment in air atmosphere, Optik 148 (2017) 142. [ Links ]

32. D. C. Look, Recent advances in ZnO materials and devices, Materials Science and Engineering: B 80 (2001) 383. [ Links ]

33. M. Mora-Ramírez et al., Synthesis, characterization and optical properties of Co2+ doped PbS nanocrystals, Optik 238 (2021) 166629. [ Links ]

34. P. Singh and R. Kumar, Investigation of refractive index dispersion parameters of Er doped ZnO thin films by WDD model, Optik 246 (2021) 167829. [ Links ]

35. W. Zhang et al., Morphology and optical property of zno nanostructures grown by solvothermal method: effect of the solution pretreatment, Journal of Nanomaterials 2013 (2013). [ Links ]

36. V. Mote, Y. Purushotham, and B. Dole, Williamson-Hall analysis in estimation of lattice strain in nanometer-sized ZnO particles, Journal of theoretical and applied physics 6 (2012) 1. [ Links ]

37. D. Kumar et al., Effect of surface mechanical treatments on the microstructure-property-performance of engineering alloys, Materials 12 (2019) 2503. [ Links ]

38. M. S. Ghamsari et al., Impact of nanostructured thin ZnO film in ultraviolet protection, International journal of nanomedicine 12 (2017) 207. [ Links ]

39. M. C. Portillo et al., Optical and structural analysis of the charge transfer of Ce3++ e — — > Ce4+ ion in the cerium oxide (CeO2), Optik 248 (2021) 168178. [ Links ]

40. M. C. Portillo et al., White light upconversion in NdOHCO3 to Nd2O3 nanocrystals: Structural and optical transition, Optik 249 (2022) 168272. [ Links ]

How to Cite. M. A. Vicencio Garrido, O. R. Portillo Araiza, M. Chavez Portillo, O. Portillo, and M. Lozano Espinoza, “Crystalline native defects in ZnO analyzed by photoluminescence applying Maxwell-Boltzmann statistics in the visible region”, Rev. Mex. Fís., vol. 69, no. 2 Mar-Apr, pp. 021304 1-, Mar. 2023.

Received: June 13, 2022; Accepted: August 17, 2022

Creative Commons License This is an open-access article distributed under the terms of the Creative Commons Attribution License