1. INTRODUCTION
The majority of observed galaxies live in rather small groups containing from a few to tens of galaxies (e.g. Tully 1987, Nolthenius & White 1987, Eke et al. 2004, Berlind et al. 2006, Tempel et al. 2014). A particular subset of these systems are known as compact groups (e.g. Hickson 1997, Tovmassian et al. 1999, Lee et al. 2004, de Carvalho et al. 2005, Niemi et al. 2007, McConnachie et al. 2008, Díaz-Giménez et al. 2012), with sizes in projection (< 100kpc) a few times the optical diameters of their member galaxies and relatively well isolated from other normal galaxies and structures.
Of the best known compact groups (CGs) are those first identified by Hickson (1982). Although some CGs in Hickson’s initial catalog are not considered any longer physical groups (e.g. Sulentic 1997, Hickson 1997), there is ample evidence, ranging from HI observations (e.g. Borthakur, Yun & Verdes-Montenegro 2010) to X-rays (e.g. Ponman et. al. 1996, Desjardins et al. 2014), and morphological signs of interactions (e.g. Mendes de Oliveira & Hickson 1994, Coziol & Plauchu-Frayn 2007), that lends support to the physical reality of many observed CGs in the sky. Observational determinations of redshifts of other compact group configurations in the sky, like the Shakhbazian-type having crossing times ∼ 0.1Gyr (Tovmassian & Tiersch 2008), show that these compact structures are a definite feature of the large-scale structure of the universe.
Ever since the discovery of Hickson’s compact groups it was noticed that their dynamical time scales, many with td~ 0.01 tH(
There have been many works on the evolution of compact group-like associations of galaxies, using both dynamical (e.g. Barnes 1985, AMB97, Gómez-Flechoso & Domínguez-Tenreriro 2001, Aceves & Velázquez 2002, Taranu, Dubinski & Yee 2013) and cosmologicalmodels (e.g. Diaferio et al. 1994, Governato et al. 1996, Sommer-Larsen 2006, McConnachie et al. 2008, Díaz-Giménez & Mamon 2010, Mendel et al. 2011, Aceves et al. 2015). Earlier N-body simulations (e.g. Barnes 1985; Bode, Cohn & Lugger 1993) showed that a common massive dark halo delayed the merging time of small groups, and later AMB97 reported on a large set of collision-less simulations, where they found that massive, non-concentrated common dark halos slowed the merging time; in particular if such a halo is in virial equilibrium, the groups can survive without merging for times longer than the Hubble time.
Several of the cosmological studies mentioned have shown that the observed number density of CGs is consistent with the statistics of compact grouplike associations in the current standard cosmological scenario (e.g. McConnachie et al. 2008, Díaz-Giménez & Mamon 2010, Aceves et al. 2015). Hence the overmerging problem of CGs, inferred from their small crossing times, does not seem to pose a big problem for our current understanding of structure formation in the universe, even though they observationally have very small crossing times. For example, from the results of Aceves et al. (2015) it follows that compact group-like associations can arrive at the current epoch, in a natural way in a ΛCDM cosmology avoiding overmerging. In such a study it was found that compact associations of galaxy-size dark halos are in a stage of gravitational collapse, and that a non-cuspy and non-massive (< 20% of the total mass) common dark halo exists. This is a∼ likely situation that can represent what is actually happening in observed CGs at present.
Several works have addressed the topic of the future evolution of large-scale structures in the universe and of the Local Group of galaxies (e.g. Loeb 2002, Busha et al. 2003, Hoffman et al. 2007, Cox & Loeb 2008, Araya-Melo et al. 2009). At the moment, to our knowledge, the future fate of current compact configurations obtained directly from cosmological simulations has not been investigated. This would provide, among other things, an assessment of wheter an overmerging problem is expected to be happening just after the present epoch (and to what extent) or if a longer longevity of these systems is likely.
The purpose of the present work is to use the systems of galaxies, modeled as pure dark halos, that form a compact association (similar to the observed CGs) obtained from several cosmological simulations, and to follow their future dynamical evolution for the next 5 Gyr to study their longevity. For completeness, we provide some examples of the behavior of kinematical quantities of three representative CGs over their dynamical evolution.
The outline of the paper is as follows. In § 2 we describe the method used in this work, and provide some details of the simulations used, as well as criteria used to determine when a merger occurs. In § 3 we present our results and some discussion. In § 4 we provide some final comments and conclusions.
2. METHOD
2.1. CGs from Cosmological Simulations
To investigate the longevity of compact grouplike associations (CAs) we use a previously reported set of cosmological simulations (Aceves et al. 2015), where several CAs were identified in a ΛCDM cosmology. Their CAs are defined to be those systems with 3D group radius Rg ≤ 250h−1 kpc. The positions and velocities of the members identified in such groups will, along with the dark intragroup matter, determine the initial conditions for the dynamical simulations described below. Here we briefly review such simulations.
The simulations we done using Wmap7 parameters (Larson et al.2011, Table 3), with a Hubble parameter h = 0.70, in boxes of comoving length L = 100h−1 Mpc with a total number Np = 5123 of dark matter particles; each particle has then a mass mp ≈ 6 × 10⁸h−1 M⊙. The N-body cosmological simulations were run using the code Gadget2 (Springel 2005), with a softening length ε = 20h−1 kpc. A set of galaxy-type dark halos with masses M ∈ [1011,5 × 1012]h−1M⊙ were identified in five cosmological simulations, and well isolated groups of such halos up to a radius of ≈ 1Mpc from the center-of-mass were identified. Inside this range of halo masses, normal galaxies can presumably reside, mimicking an observational setting similar to that of compact groups.
Fourteen small physical and bound associations were found at z = 0, with a mean group radius ≈200h−1 kpc, a three-dimensional velocity dispersion σ ≈ 300km/s, a dimensionless crossing time tc/tH ≈ 0.04−, (with tc = Rg/σ), and a mean mass ≈ 9 × 10¹²h 1 M⊙. The CAs found in these simulations had on average < 20% of its total gravitational mass in the form of a common dark halo∼ with a rather homogeneous distribution, definitely non-cuspy, and all CAs were a state of gravitational collapse. The current epoch CAs identified here had all a mean group radius of ≈ 1h−1Mpc at z = 1, as shown in Figure 8 of Aceves et al. (2015).
2.2. Dynamical Modeling
Out of these 14 CAs we isolate all matter up to a radius of 1Mpc from the center of mass, including the member galaxy-size dark halos and their intragroup dark matter. This radius corresponds to about the turn-around radius for a system of mass ≈ 1013h−1M⊙, and is about 5 times the radius of the CGs at z = 0; hence it is well isolated from the rest of the large-scale structure. We study the future dynamics of these CAs by isolating them from the Hubble flow. This appears to be well justified, given the compactness of the CAs. All comoving quantities are converted to physical ones using h = 0.70. Such decoupling will allow us also to increase the number of dark matter particles in the galaxy-size halos of such CAs, to have a better resolution.
Dark halos in the cosmological simulations were identified using the Amiga code (Gill et al. 2004, Knollmann & Knebe 2009). This code provides information about their virial radius and mass, as well as their concentrations, assuming a NFW profile (Navarro et al. 1997). Using this information we approximated each member halo by one modeled with a NFW spherical density profile:
where rt is the truncation radius, that we take to be equal to the cosmological virial radius of the halo, rs is the scale radius, and ρ0 the normalizing constant of the profile such that the total mass is equal to the virial mass. N-body realizations of the NFW profile were done using the algorithm described by McMillan & Dehnen (2007) and implemented in the Nemo numerical library (Teuben 1995).
Numerical models for the dynamical halos were run in isolation for 1 Gyr to ensure that they were constructed in equilibrium, a condition that was satisfied. Also, the particle closest to the center-ofmass among the 100 most bound particles was moved artificially to this center and made 10 times more massive than the rest of the halo particles. The latter allowed us to use this central particle as a tracer of the bulk motion of each halo, as has been done sometimes in simulations of galaxy interactions (e.g. Aguilar & White 1985).
The particles of the intragroup dark matter, those outside the cosmological virial radius of the individual galaxy-like halos but bound physically to the whole system, were kept with the same mass each (mig ≈ 6 × 10⁸h−1 M⊙). In order to minimize two-body relaxation effects between the halo particles and the intragroup particles we chose softening parameters so as to satisfy the following equal acceleration-relation:
where mh is the mass of each particle in the dark halo, and ǫh and ǫig are the softening parameters for the halo and intragroup particles, respectively. An ǫh = 500pc was chosen for the halo particles. This determined, given the total mass of the halo, the ǫig for each simulation, after having set to Nh = 500,000 the number of particles for the largest mass halo in each CA.
The mass, radius, concentration, initial positions and velocities, as well as the number of particles used to represent each halo, are listed in Table 1 (see the Appendix) for each group. The simulations were run for 5 Gyr using the Gadget numerical code. Energy conservation in all cases was < 0.5% for the entire time span. The initial and final virial ratios, 2∼ T/|U|, of the group systems are also indicated in Table 1.
Mergers were identified using a criterion similar to the typical ones used for binary mergers of galaxies (e.g. Binney & Tremaine 2010). In particular, if any two halos have their relative distance d and relative bulk velocity V satisfying:
a merger is signaled, where r and v correspond to the 3-dimensional position and velocity vectors of each halo, and rs and σs correspond to the scale radius and the internal velocity dispersion, respectively, of each halo. In addition to fulfilling these criteria, we checked by visual inspection that the actual halos were merging.
3. RESULTS AND DISCUSSION
In this section we show the results of the dynamical simulations described above. In Figures 1-3 we show the evolution of the particle configuration for three representative cases (G4, G7, G9) out of the fourteen ones obtained in the simulations at different times. The figures are meant to schematically show of the evolution; no special weighting of the particles was used when plotting.
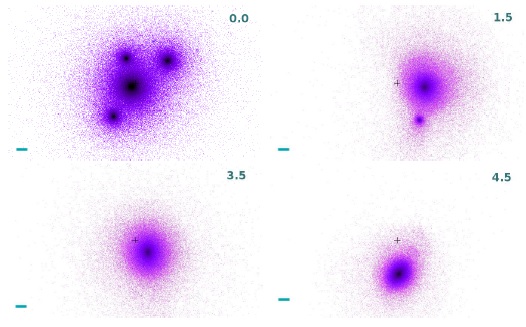
Fig. 1 Projected spatial dynamical evolution of the only CA (group G4) that forms a single massive remnant after about 5 Gyrs. The system is shown, from left to right and top to bottom, at t = {0.0,1.5,3.5,4.5}Gyr after the current epoch. The box dimension is 1 Mpc×1 Mpc. The bar scale on the lower left of each panel corresponds to 50kpc in length.
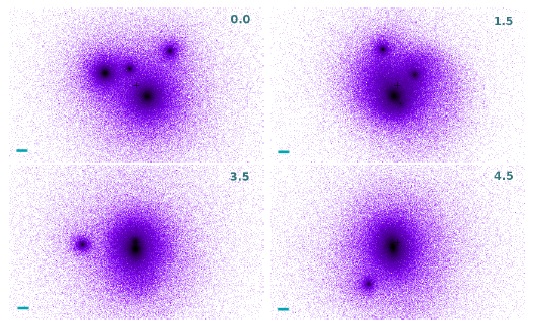
Fig. 2 Projection position of halos and intragroup matter similar to Figure 1, but here the end stage configuration results in a large dark halo and another halo in orbit around the first (group G7).
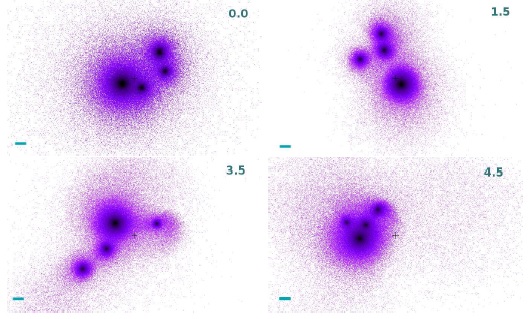
Fig. 3 Projected spatial configuration evolution, as in Figure 1, but in this case (group G9) no merger develops over 5 Gyr of evolution from the present.
Figure 1 shows the projected evolution of the only group (G4, 1 out of 14) that suffers a complete merger in the 5 Gyr after the current epoch. At 1.5 Gyr there are only two halos noticeable, and at 3.5 Gyr a single object appears. A gravitational collapse of all material, both from individual halos or from intragroup matter, is present at 5 Gyr.
Figure 2 shows a sample of the evolution of a group (G7) where 2 objects are discernible at ≈ 5Gyr, and in Figure 3 we show a group (G9) where none of the halos merge in the time span of the dynamical evolution. Notice that even after 5 Gyr of dynamical evolution, in the groups of Figures 2 and 3 an appreciable amount of intragroup matter exists, contrary to the situation displayed in Figure 1.
In Figure 4 we show the merging history of our 14 CAs during 5 Gyr of dynamical evolution after the current epoch. Noticed that only one CA suffered a complete merger and in only one case no merger occurred in the time span of these simulations. Also, only one group had 5 members initially (G1). This group ended having 4 halos after suffering a binary merger. From this figure it follows that some CAs, even after 5 Gyr of evolution, might survive for a longer time and show still discernible halos.
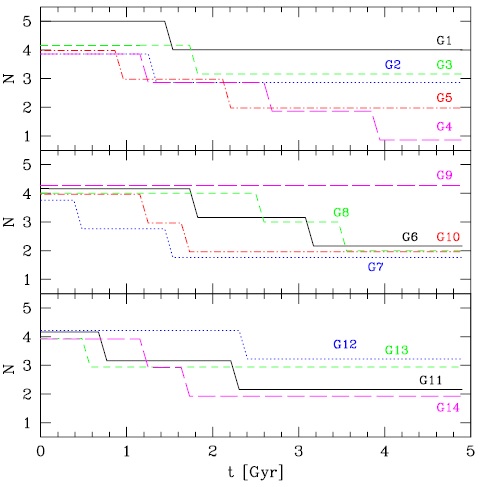
Fig. 4 Merger history of our 14 CAs. Only one CA had initially 5 galaxy-size dark halos, the rest all had 4 such members; a full merger is indicated when only N =1 object remains in the system. A single group (G4) coalesced into a single object and only other group (G9) survived without any merger in 5 Gyr.
The relatively small number of CAs studied in this work precludes us from making any statistically significant estimate of the number of currently observed compact groups (at z ≈ 0) that could resist total merging in the next five giga-years. Nonetheless, it seems from the results presented here that such a number might not be very different from 10% of the total number of observed compact groups.
On other hand, from Figure 4 it follows that it is highly probable that none of the true compact groups observed (at z = 0) will suffer a complete merger within the next ≈ 1Gyr, even if they are in the process of gravitational collapse. Only four of the fourteen initial CAs (≈ 30%) suffer a binary merger in approximately the next giga-year. Probably half of them will survive at least for another 3 Gyrs without a complete merger.
The results obtained here indicate that there is no risk of an overmerging problem to occur in the near future in observed CGs, in so far as the model used here resembles the actual situation of observational counterparts.
In the case where a complete merger occurs, as shown in Figure 1, a large concentration of dark matter is present, with a minimal large envelope, but the subsequent dynamical evolution of that system was not explored. The other cases where an incomplete full merger is achieved, the amount of intragroup matter is more noticeable. No clear physical boundary for a halo can be established in these dynamical simulations, since its gravitational potential does not tend to zero away from the center of each dark halo inside the group, before encompassing another halo; this is a necessary condition to compute a gravitational radius.
Some kinematical quantities of the CAs shown in Figures 1-3, such as the crossing time (τc), projected harmonic radii (RH), one-dimensional velocity dispersions (σ) and total inferred “virial masses” (Mvir) are displayed in Figure 5. The definitions used to compute these quantities are those in Aceves & Velázquez (2002), following common observational estimators:
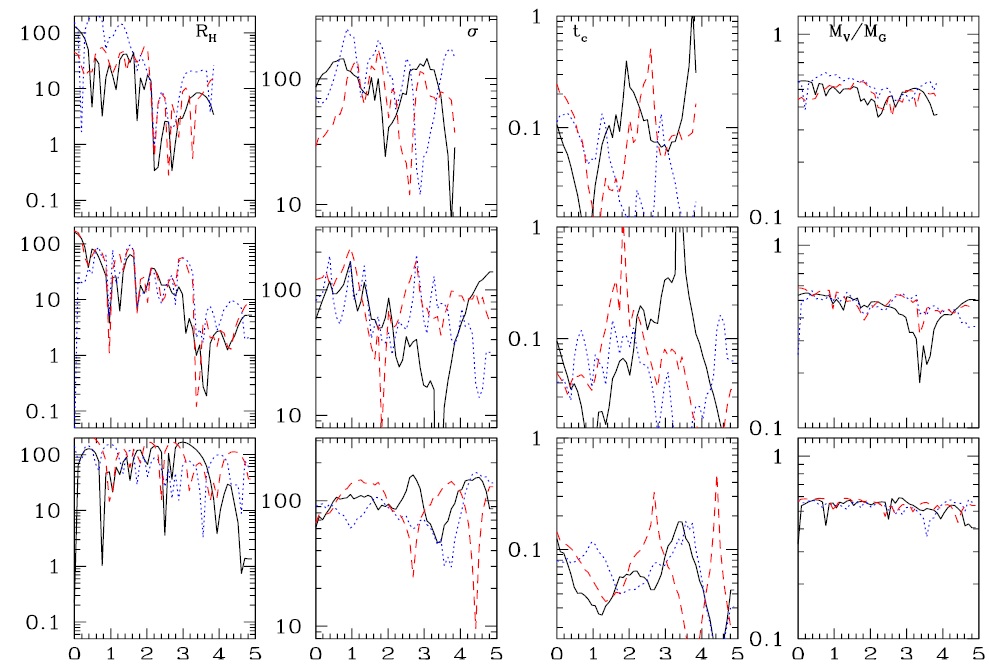
Fig. 5 Kinematical quantities for CAs in Figures 1-3 (groups G4, G7 and G9) from top to bottom row, respectively, are shown. The projected harmonic radius, RH, the one-dimensional velocity dispersion along each “line-of-sight” σ, the crossing time
where R,Rij and Ng are the average projected separation, the projected separation between galaxy pairs and the number of galaxies, respectively. The virial mass was calculated following Heisler et al. (1985):
Here, V i is the velocity along the line of sight with respect to the velocity centroid. To compute such quantities, the bulk motions of the dark halos inside the physical group were used. The values shown for these CAs are representative of the observed CGs, and two things are worth mentioning here. On the one hand, the average mass of a CG is probably underestimated since (assuming this evolutionary scenario is correct) since the Mv estimator is about 50% of the total mass of the bound group mass. This has repercussions on the mass estimates obtained for such systems using typical virial when a full group merger is signaled.
mass estimators, as suggested in an early studies (e.g. Barnes 1985, Aceves & Velázquez 2002), This needs to be taken into consideration when addressing such problems.On the other hand, the small values of the crossing times obtained for our models of CGs (
4. FINAL COMMENTS
The longevity of present CAs formed by galaxylike size dark halos immersed in common dark halos obtained from cosmological simulations, was studied using dynamical N-body simulations.
The initial conditions for the CAs used in this work were obtained from previously reported ΛCDM cosmological simulations (Aceves et al. 2015) where, in particular, it was found that a non-massive (≲ 20%), collapsing and non-cuspy distribution encompasses a set of galaxy-like objects resembling compact groups.
The present work used normal galaxy-like size dark halos to model galaxies in environments that mimic observed CGs. The use of pure N-body simulations as well as the use of only spherical halos to represent galaxies in such environments has been studied in the past (e.g. Carnevali et al. 1981, Ishizawa et al. 1983, Barnes 1985, Governato et al. 1991, Bode et al. 1993, AMB97, Aceves & Vea´zquez 2002, Taranu et al. 2013), and has led to important insights in the evolution of CGs. Concerning the purpose of this work, the use of such a halo model to represent galaxies appears well justified.
The main result of this work indicates that the currently observed compact groups of galaxies, in general, will not suffer a complete merger within roughly the next 5 Gyr, roughly half the age of the universe. In particular, our results suggest that most current observed CGs will undergo 1-2 mergers, and nearly half of them will end up with 2 members. Hence, present compact groups probably have a long time to further evolve despite indications to the contrary, as their present small crossing times.
The near future overmerging of present CAs does not seem to be a problem for these systems. It may be that the dynamical friction timescales are much larger than the crossing times. However, no reliable estimation of the former timescale can be done because “galaxies” are not point particles and the intragroup medium is not homogeneous; in practice one would need to do an N-body simulation calibration of the Chandrasekhar formula for the dynamical friction timescale (e.g. Inoue 2011).
A limitation of our work is the small number of CGs considered, that precludes us to obtain statistically significant results. Another one is the resolution in mass of our simulations, in particular, for the IG particles. Clearly a larger number of cosmological simulations, including some re-zooming techniques and a disk component in some dark halos, would alleviate some of these limitations. An orbital analysis of those current compact associations that will not suffer a full merger in the near future could provide more insight into the dynamical conditions for avoiding overmerging. Unfortunately, such analysis is beyond the scope of this paper, as are topics such as the structure of the merger remnants of spiral-like galaxies or the effects of gas on star formation, but future studies are planned.


 nueva página del texto (beta)


