1. INTRODUCTION
Future advances in astronomy depend on the ability to perform deep observations at near infrared (NIR) wavelengths. To observe the early universe, for example, the observations must be performed at increasingly longer wavelengths, as the diagnostic optical spectroscopic features become more redshifted (Ellis & Bland-Hawthorn 2008). However, there are also some problems with NIR astronomy, the main concern being the background level. Of particular interest is the 1-2.5 µm region. The dominant NIR infrared background arises from very bright hydroxyl emission (Meinel 1950), resulting from the vibrational decay of an excited OH-radical. Furthermore, the intensity of the OH emission is highly variable, making accurate subtraction very difficult (Davies 2007). Astronomers have searched for a technology to suppress this background signal from OH emission lines. Two of the solutions that have been proposed are: (1) the use of space infrared telescopes such as the James Webb Telescope (Mather 2010) still under construction and with extremely high costs (Witze 2018); and (2) the use of new optical fiber devices that constitute a new discipline known as astrophotonics, which seeks to use photonic technologies within fibers (or other waveguides) to perform more complicated functions, not feasible with traditional optics (Bland-Hawthorn & Kern 2009). The use of optical fibers in astronomy dates back to 1980 (Hill et al. 1980), with significant developments through the 80′s and 90′s, such as multi object spectroscopy, integral-field spectroscopy, interferometry and photometry (Parry 1998). The primary use of optical fibers has been mainly to transport light from the telescope to an instrument. Now the application of specialty fibers used in astrophotonics includes multiple notch filters, multi-mode to single-mode converters and frequency combs (Ellis & Bland-Hawthorn 2015).
The astrophotonics solution for OH suppression at NIR wavelengths consists of the use of two innovations: aperiodic fiber Bragg gratings (AFBGs) and photonic lanterns (Ellis & Bland-Hawthorn 2008; Bland-Hawthorn et al. 2004; Ellis et al. 2012; Trinh et al. 2013; Trinh 2013; León-Saval et al. 2005; Birks et al. 2015). AFBGs have the capability to behave as complex multi-notch filters that can suppress hundreds of OH emission lines in the 1,000 to 1,800 nm band at high attenuation (≈ 30dB in transmission) over a large bandpass ( 200 nm), with low attenuation between the lines (< 0.2dB) and a narrow wavelength interval [δλ = 0.16nm] (Bland-Hawthorn et al. 2011). The photonic lantern is a low-loss optical device that connects one multimode core to several cores (e.g. single-mode) (León-Saval et al. 2005; Birks et al. 2015) and provides a mean to capture light from the telescope as a multimode optical fiber, convert n optical modes into the output of n singlemode optical fibers, where the AFBGs are printed, and convert them back again into a multimode optical fiber end to be coupled to the spectrograph. This solution has proved to be very successful to reduce 103 OH emission lines doublets in the 1.47 -1.7 μm band by a factor of ≈1,000 using seven 50 μm core fibers connected to 19 single mode fibers with two sets of AFBGs each (GNOSIS instrument). However, the results were not as successful as expected in the reduction of the background between the OH lines (Ellis et al. 2012; Trinh et al. 2013). Despite the success of the above technique of OH emission lines reduction, we believe that it can be further improved. We propose in this work an active tension system that reduces in real time the variability of the OH emission lines. We demonstrate the effect experimentally by simulating one OH emission line with a semiconductor laser at 1548.43 nm and its suppression by tension tuning from 0 gf to 54 gf with a commercially available FBG centered at 1547.76 nm. A conceptual design of this real time active tension system is then proposed by means of software, electronics and tension actuators.
2. ATMOSPHERIC OH EMISSION
The complex chemical composition of the upper layers of the atmosphere, rich in molecules of O2, N2, NO, CO, CN, CO2, H2O, OH and the ionizing effect caused by solar ultraviolet radiation, present a marked dominant emission in the nearinfrared (NIR) regions of the electromagnetic spectrum (Schlatter 2009; Rousselot et al. 2000), compared to the infrared emissions of galactic astronomical objects, which in most cases can be on the order of hundreds of times the average brightness of the night sky background (Davies 2007). Particularly relevant are the emissions caused by the vibrational decay of OH located in a thin layer 6-10 km thick in the atmosphere, at a height above sea level of 87 km (Rousselot et al. 2000). These narrow lines show a very compact concentration and are created by the reaction between atomic hydrogen and ozone, providing enough energy to keep the OH populating the vibrational level X 2Π i and quantum number ν = 9 (Anlauf et al. 1968).
The observations made in the year 1999 using the Paranal Hill telescopes and the models proposed for the characterization of these emissions in the region 100-2,264 nm (Moorwood et al. 1999) have allowed us to identify with a good approximation the most representative components of the region comprised between 1,000 - 1,600 nm of the near infrared. However, there is still much to understand about how the emissions of the rest of the molecules in the Earth’s atmosphere, combined with the residual brightness of the night sky, contribute to the integrated total brightness that hinders the astronomical observations in the NIR band. The contributions by thermal radiation both of the atmosphere and of the instruments on the Earth’s surface, are an additional factor to be extracted in its entirety through appropriate radiatives models (Ellis & Bland-Hawthorn 2008) and which are integrated at the moment of the reduction of the observational data.
In this scenario, it is a challenge to understand the emission in the J and H band of the electromagnetic spectrum between 1,100 nm-1,800 nm, a very bright area attributed in part to the vibrational decay of the OH radical as well as to the emission and dispersion of zodiacal and galactic plane light, the thermal emission of the atmosphere, the thermal emission of the instruments, the thermal emission of the interstellar dust and the microwave emission of the cosmic background. Although there are spectroscopic techniques to subtract them, the difficulty to maintain a low level of brightness in the interlinear regions persists and is significantly compromised when masking techniques are used, dispersing additional brightness in these areas (Maihara et al. 2004).
The line width is caused by a combination of processes inside the atmosphere that contribute to a greater or lesser extent, and of which stand out: the Doppler effect due to the thermal movement of the molecules, which imprints a dominant profile in the line width, typically Gaussian; the collisional and natural effects contribute with a Lorentzian component, giving rise to a convoluted symmetry that is distinguished by the formation of weak lateral wings. To model these effects together under certain thermodynamic considerations typical of the atmospheric layer the Voigt profile model proposed by Ellis and Bland Hawthorn (Ellis & Bland-Hawthorn 2008) is considered to be one of the best approximations to the extremely narrow profile of the OH emission lines. These have been compared with the spectra obtained and cataloged by Rousselot in 2000 (Rousselot et al. 2000). This is the starting point for the understanding of the problem of the spectral reduction of the atmospheric infrared barrier.
The spectrum of Figure 1 (left) shows the “forest” of OH emission lines in the range of 1 - 2 µm plus the components of zodiacal scattered light and thermal emission which are noticeable starting from 1.8 µm (Ellis & Bland-Hawthorn 2008). Figure 1 (right) shows in detail the 1,150.97 nm emission line from the database obtained with the ISAAC instrument of the European Southern Observatory (Near-Infrared Gemini Observatory 2015).

Fig. 1 OH spectrum with the added components of the scattered zodiacal light and thermal emission (Left) (Ellis & Bland-Hawthorn 2008). A typical emission line of the atmospheric OH (Right) (Rousselot et al. 2000; Near-Infrared-Gemini Observatory 2015).
Equation 1 shows the model relationship between the integrated flux V as a function of the collisional cross section σ of the particle, the increased FWHM linewidth γ produced by the molecules collision pressure effect, the central wavelength λ ′ and the variable wavelength λ.
It is very important to model these profiles if the purpose is to design an adequate fiber optic Bragg grating system which can filter with a high performance in the infrared zone, maintaining similar narrow transmission profiles with low power losses, which could contribute to the emission in the interlinea continuum.
3. PROPERTIES OF BRAGG GRATINGS
A fiber Bragg grating (FBG) is a periodic perturbation of the refractive index along the length of a single-mode fiber, which is formed by exposure of the core to an intense optical interference pattern. The perturbation is possible because of the sensitivity to ultraviolet light of the optical fibers doped with germanium (Hill et al. 1978; Hill & Meltz 1997).
The disturbance of the refractive index in the core acquires the shape of a volume structure as shown in Figure 2 which acts as a filter and which allows it to reflect a particular wavelength band according to the design of the period of the grid; this wavelength, called Bragg wavelength, depends directly on the period Λ as well as on the effective refractive index n eff of the core.
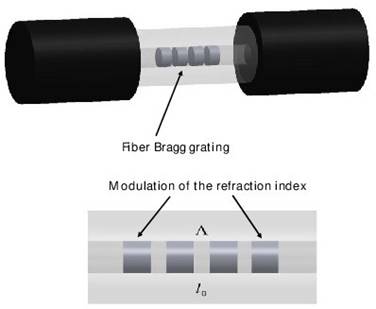
Fig. 2 Effect of the disturbance of the refractive index due to the incidence of ultraviolet radiation on the core of a single-mode optical fiber; the interference of the beam of light causes a regular modulation of the index of refraction.
For a practical grating, we must specify the grating L and the modulation amplitude ∆n. The strongest response in the narrowest possible notches occurs in the weak grating limit for which (Bland-Hawthorn et al. 2011)
where δλis the approximate full width half maximum (FWHM) bandwidth of the grating, L/λ is the number of the grating planes. From this equation, the required modulation can be determined (∆n ≈ 10−4) and a minimum grating length could be L = 50 mm. The peak reflectivity of the grating rmax is given by:
This peak reflectivity is determined by the grating amplitude ζ (in units of inverse length) and the grating length L. The grating amplitude is related to the induced refractive index modulation ∆n along the fiber axis z by:
where z is the distance along the FBG. The variable ζ is the coupling efficiency of the propagating and counter-propagating electric fields and defines the grating strength. The quantity h∆ni is the average refractive index change within the grating modulation. For a periodic FBG the notch is far from rectangular and has a finite width; the wings of the notch are too strong and they exhibit ringing. The wings can be greatly suppressed, and the notch can be squared off by shaping (apodizing) the upper envelope of the refractive index profile (Bland-Hawthorn et al. 2011).
Figure 3 shows the characterization of a commercially available FBG (Micron Optics os1100) (Micron Optics 2017) done at our laboratory. We used a superluminiscent broad-spectrum diode (SLD1550-A1) from Thorlabs as the source. The reflected Bragg wavelength is observed as a notch in the transmission signal detected by a Yokogawa AQ6370D optical spectrum analyzer. The reflected spectrum shown was calculated.
4. APERIODIC FBGS
A practical OH emission lines suppressing filter is a highly complex grating structure. All parts of the grating contribute with important information to all of the notches. In addition to the refractive index modulation, along the grating length the flexibility in the FBG designs is achieved by incorporating phase variation (Bland-Hawthorn et al. 2011):
where z is the physical length along the fiber axis, the term (2π/Λ)z describes the phase delay at each reflecting plane in the FBG, and the parameter ∆φ describes the phase variations (dephasing) with respect to the linear term. The simple grating uses a constant ∆n, whereas the apodized grating adopts a “raised cosine” envelope in ∆n to suppress the reflections at the extremes of the grating.
A complete discussion of the aperiodic gratings design is highly technical and is discussed in detail elsewhere (Feced et al. 1999; Glaesemann 2017). In summary, the coupled mode equations describing light propagation in an FBG (Feced et al. 1999) must be solved:
where E f and E b are the amplitudes of the forward and backward propagating fields. Equation (7) constitutes a pair of non-linear partial differential equations that can be solved using a direct/inverse scattering transform. The grating function q(z) is now expressed in its complex forms, such that q(z) = ζ(z)exp[iφ(z)], where the amplitude function ζ = |q| and the phase function φ = Arg(q). The coupled equations must satisfy all wavelengths in a broad spectral band ∆λ centered at λ 0. The wavelength dependence enters through the variable δ defined as the wavelength (detuning) offset normalized to λ 0. The transmission and reflection profiles, T(λ) and R(λ) are computed through a matrix transformation (Feced et al. 1999).
5. PHOTONIC LANTERNS
The use of optical devices as shown in Figure 4 allows to cover several of the requirements that the study of astronomical sources demands; it is necessary that the input end be in the multimode regime so it can accept the reduced optical power available; also, the device should cover the required bandwidth of the order of hundreds of nanometers. The assembly of a set of mono and multi-mode fibers by thinning would allow coupling the light coming from extended cosmic sources that emit at several wavelengths (which are captured by the telescopes), to conveniently separate them into different waveguides in whose interior Bragg grating have been drawn, which perform the function of selective filtering for certain wave profiles. The device can be bidirectional because the remnant of the radiation processed in the single-mode fiber cluster would have to pass directly to the spectroscopic analysis system by means of another multi-mode fiber end, thus recovering part of the power of the radiation front captured by astronomical instruments. Also, each single mode fiber could include several Bragg gratings simultaneously (León-Saval et al. 2005; Birks et al. 2015).
6. OPTICAL FIBER BRAGG WAVELENGTH TUNING
The physical characteristics of the optical fiber have shown an excellent behavior to the elastic deformations when they are subjected to mechanical stresses of tension and compression. In the case of the optical fibers the modulus of elasticity is in the range of 70-73 GPa, and its performance level is below 100 kpsi (0.69 GPa); that is to say it could support loads of the order of 8.4675 N (863 grams) before its rupture (Glaesemann 2017).
To confirm the possibilities of modifying the period of the Bragg grating by deformation induced by mechanical stress, some parameters of the silicon dioxide fiber with 8.2 microns of diameter core and 125 microns of external diameter were used, simulating a modulus of elasticity of 73 Gpa. The response is practically elastic as shown in Figure 5, which opens the possibility that when tension is applied within a previously selected range, a tuning of the Bragg wavelength can be achieved by modifying the period of the grating.
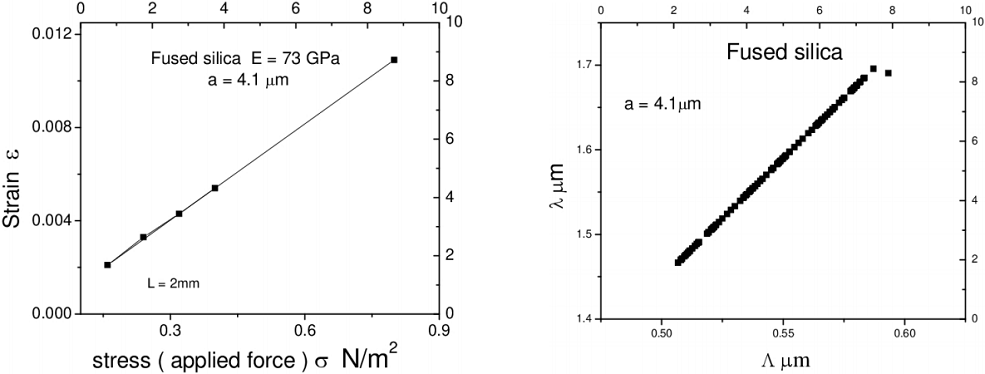
Fig. 5 Simulation of the longitudinal deformation by a force applied to a segment of a silica fiber, with an elasticity modulus of 73 GPa (left). Calculated Bragg wavelength as a function of the Λ period change under an applied force (right).
For linearly elastic materials, it is possible to determine by the modulus of elasticity E the proportion of the deformations ε = ∆l/l when subjected to mechanical stresses = F/s, where s is the cross section of the optical fiber.
However, the optical fibers made of silica (silicon dioxide), can be considered as isotropic materials and the effects of longitudinal tension efforts would show a practically linear trend, as has been confirmed in the simulations.
Table 1 shows the result of the simulation of a fused silica fiber segment subjected to mechanical tension. A linear deformation can be observed, as the tension is increased. The results allow to see clearly the possibility of tuning the wavelength of the Bragg grating within a tolerance margin of less than 10 nm. By stressing an optical fiber with a Bragg grating drawn on its core, it is possible to modify the period Λ and to relate it to the modulus of elasticity and the deformation of the fiber; the development can be seen in detail in Appendix A. The Bragg wavelength is in direct proportion to the physical parameters of the fiber and to the tension force to which it is subjected (equation 9). In the case of the SMF-28 fiber, the effective refractive index is 1.4682 at 1550 nm.
TABLE 1 SIMULATION OF A FUSED SILICA FIBER SEGMENT UNDER MECHANICAL TENSION
| Modulus of Elasticity E=73GPa | |||
|---|---|---|---|
| Length mm |
Force N |
Effort σ
Gpa |
Strain ε |
| 2 | 0.981 | 0.79951 | 0.0109 |
| 2 | 1.962 | 0.159902 | 0.0021 |
| 2 | 2.943 | 0.239853 | 0.0033 |
| 2 | 3.924 | 0.319804 | 0.0043 |
| 2 | 4.905 | 0.399755 | 0.0054 |
For a fiber of 125 microns diameter, g = 9.8066m/s2 and E = 70 × 109Pa (Fang et al. 2004).− we obtain a constant k = 0.009339[kg 1]. In the case of the Bragg grating, the period was taken from the manufacturer’s data, as well as the design wavelength at 1547.76 nm and the effective refractive index of 1.4682, with an approximate grating period of the 527 nm. Equation 8, where µ represents the mass of the suspended weight, is shown in Figure 6.
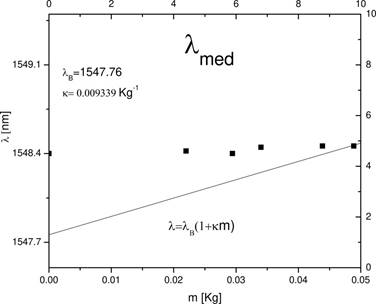
Fig. 6 The convolution of the two profiles preserves a mean wavelength that remains almost constant and very close to the wavelength of the 1548.8 nm source. Simultaneously, the average wavelength λ med of the profile reflected by the grid is shown for each of the tests.
This is the model proposed for the tuning of the wavelength of the profile reflected by the grating when subjected to stresses, according to equation 9.
7. EXPERIMENTAL DEVELOPMENT
To carry out the simulation of a tension tuned FBG to reflect one of the emission profiles of the atmospheric OH radical, an experiment was designed and performed as shown in Figure 7. A single-mode fiber pigtailed laser diode LP1550-SDA2 from Thorlabs with a maximum optical power of 2.5 mW at a nominal current of 22.6 mA was used to simulate an OH NIR emission line at 1548.85 nm. Mechanical tension was applied by means of scale calibrated weights from 0 g to 55.83 g suspended to a commercially available Bragg grating OS1100 of Micron Optics. The FBG is printed in 10 mm of core of a compatible SMF-28 type optical fiber, coated with polyamide, a diameter of 125 microns, maximum reflectivity of 70%, FWHM = 0.25nm ± 0.05nm and a Bragg wavelength design of 1548.85 nm. The transmission spectrum was observed and recorded with an optical spectrum analyzer (OSA) Yokogawa AQ6315.

Fig. 7 Experimental assembly required for the simulation of a NIR wavelength using a semiconductor laser at 1548.85 nm and a FBG at 1547.76 nm at 0 g tension. The tension was changed from 0 to 55.83 grams with the use of calibration weights.
The experimental assembly required for the implementation of a support, which would allow the fiber segment where the grating Bragg was drawn to be maintained in position. To avoid damage of the fiber optic cladding, the ends of the FBG were covered with two adhesive tape clamps, on which neodymium magnets were placed acting as clips, leaving the assembly firmly on a metal support. The charges were fixed directly on the optical fiber, also with adhesive tape. Due of the highly sensitive response of the fiber to the deformation, the mass of the tape was taken into account as part of the mass of the total load.
8. ANALYSIS OF RESULTS
Figure 8 shows the spectral response of the FBG and how the Bragg wavelength shifts to longer wavelengths as the weight of the pulling mass is increased. As we discussed, the change of the period of the Bragg grating Λ caused by mechanical tension, proportionally displaced the peak of the wavelength in the reflected profile.
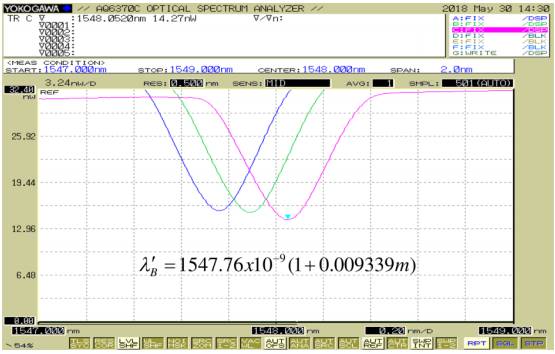
Fig. 8 Bragg Wavelength shift as the original period of the grating is modified due to the deformations to which it was subjected by test calibration weights. The color figure can be viewed online.
The gradual approach followed by pulling the FBG with different calibration weights shifted the transmitted spectral response of the optical fiber Bragg grating with respect to the maximum of the laser emission line. This resulted in the convolution of the two profiles in the wavelength domain. As a consequence, the amplitude of the laser emission line at 1548.85 nm transmitted and measured by the OSA was reduced, reaching a maximum attenuation of 6.8 dB (75%) as shown in Figure 9. The results were observed and recorded in the OSA in frame accumulation mode to compare the progressive effect of the attenuation in the profile transmitted by the FBG according to equation (9). Table 2 shows the numerical results obtained in the experiment. These values show that the strain sensitivity of the FBG is 0.0014 nm g−1.
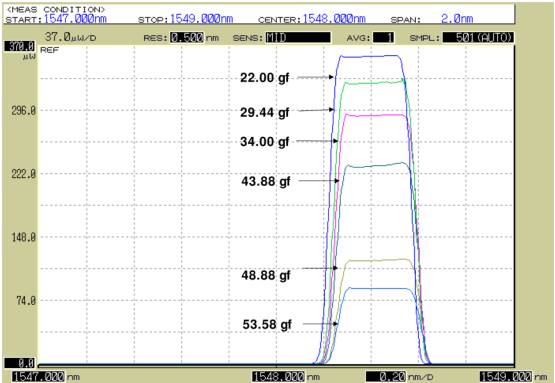
Fig. 9 Attenuation of the laser transmission profile simulating an OH emission line at 1548.43 nm as a function of the tension applied to the FBG with the calibrated weights from 22 to 53.88 g. The color figure can be viewed online.
TABLE 2 RESULTS OF THE TESTS*
| Bragg OS 1100 1547.76 nm Effective index : 1.4682 | ||||||
|---|---|---|---|---|---|---|
| Source LP 1550 SAD2 1548.8 nm | ||||||
| m | Effort | Power | λ′ B | λmed | Attenuation | Period Λ′ |
| g | GPa | µW | nm | nm | db | nm |
| 0.000 | 0.000 | 355.000 | 1547.760 | 1548.400 | 0.000 | 527.090 |
| 22.000 | 17.580 | 329.300 | 1548.078 | 1548.420 | 0.330 | 527.203 |
| 29.440 | 23.534 | 292.300 | 1548.185 | 1548.400 | 0.844 | 527.239 |
| 34.000 | 27.179 | 231.250 | 1548.251 | 1548.450 | 1.861 | 527.262 |
| 43.880 | 35.077 | 120.250 | 1548.394 | 1548.460 | 4.710 | 527.730 |
| 48.880 | 39.074 | 88.800 | 1548.466 | 1548.460 | 6.018 | 527.334 |
| 53.880 | 43.071 | 74.000 | 1548.538 | 1548.470 | 6.809 | 527.359 |
*Carried out on the measured transmitted optical power of the semiconductor laser and the FBG subjected to mechanical tension by different calibration weights.
The result obtained in the reduction of the simulated OH transmission profile was of a factor of 4 (6.8 dB), which is much smaller than the factor of 1000 (30 dB) obtained by the GNOSIS instrument which suppresses 103 OH doublets between 1.47 and 1.7 µm (Ellis et al. 2012). However, it is important to emphasize that in this experiment a commercial Bragg grating was used, and the spectral response obtained for the transmission profile was enough to highlight the viability of this technique. We believe that it is important to have the ability to fine tune the response of the FBGs in the field, so we could apply this technique of tension tuning also to the aperiodic FBGs. The sensitivity obtained is very close to that reported by Bland-Hawthorn (BlandHawthorn et al. 2004). They reported a sensitivity of 0.010 nm g−1 versus 0.014 nm g−1 from our experiment. In fact, they indicated that an offset to the printed wavelengths of 0.2 nm to shorter wavelength at 0 g axial strain was applied to allow for fine tuning.
9. CONCEPTUAL DESIGN OF AN ACTIVE TENSION TUNING SYSTEM OF APERIODIC FBGS
With the previous results, we identify a field of opportunity to improve the technique presently used with aperiodic FBGs: we propose the design of a new system, as shown in Figure 10, in which data of the optical intensity vs wavelength from the spectrograph are transferred to a computer system and the average of the target intensity peaks is calculated. This average value signal will drive a current source coupled to an actuator, the aperiodic FBG will be finely stretched to shift the Bragg wavelengths, thus reducing the average intensity of the emission lines during the observation of the NIR field. The actuator can be, for example, a small DC motor. It is expected that each aperiodic FBG can suppress approximately 50 OH emission lines; m is the number of Bragg modules required to suppress the total of emission lines in the band considered, n will be the number of single-mode optical fiber corresponding to the n number of modes at the multimode end of the optical fiber. The number of actuators will be therefore m × n. For example, in the system reported by Ellis and Bland-Hawthorn (Ellis et al. 2012) two aperiodic Bragg gratings and 19 single-mode fibers are used. In our proposed system this will give a total of 2 × 19 = 38 actuators. An electronics converter will be necessary to demultiplex output data form the OSA into 38 digital ports. 38 digital to analog (DACs) will provide 38 voltage signals applied to 38 voltage-to-current converters, and then to the 38 small dc motors to change their torque, that is, the force applied to the Bragg Module. This will work as an automatic control system in real time to actively tune the suppression system.
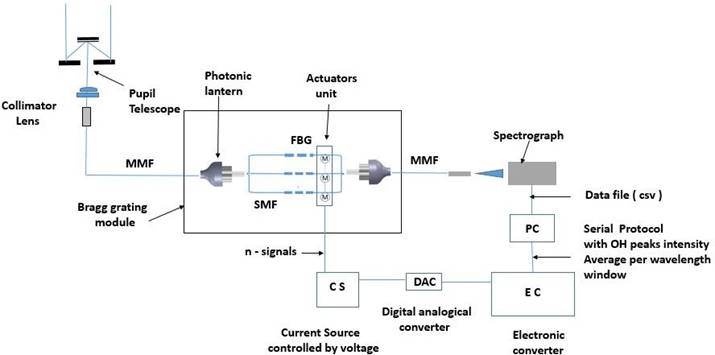
Fig. 10 Conceptual design of an active tension tuning of aperiodic FBGs. MMF: Multimode fiber. SMF: Single-mode fiber. CS: Current source controlled by voltage. DAC: Digital to analogue converter. EC: Electronic converter. PC:Personal computer, csv: comma separated values.
Temperature dependence of the aperiodic FBGs was not considered in this work. However, the reported sensitivity of FBGs is approximately 0.013 nm K−1 (Bland-Hawthorn et al. 2004). This dependence can be compensated precisely by the active tension tuning proposed here, although a thermal chamber with an automatic temperature control system can also be used.
10. CONCLUSIONS
We have demonstrated the possibility of mechanically fine tuning the rejection Bragg wavelength of an FBG in order to better suppress the OH infrared emission lines from the upper layer of the atmosphere for ground telescopes. The tunable optical fiber grating would be used in the conjunction with photonics lanterns. In our experiment we employed a commercial optical fiber Bragg grating with a Bragg wavelength of 1547.7 nm, without tension applied. When tension is applied with a controlled force, in our simulation given by calibrated weights, the corresponding mechanical stress produced a lineal deformation that changed the Bragg period. We experimentally showed that a pulling tension of 53.88 grams force produced a reduction of 75% of the initial amplitude of the simulated emission line from a semiconductor laser of 1548.2 nm at a 25◦ C. This was a relatively low value for the suppression of actual OH emission lines if it is compared with special purpose aperiodic FBGs, but it suffices to demonstrate the effect of tension tuning. The transmitted optical reduction was achieved by red shifting the optical spectrum response of a commercial Bragg filter, with a Bragg wavelength set to 1.17 nm less than the target wavelength of the peak emission line. This essentially performed an optical convolution. The conceptual design of an active tension tuning of aperiodic FBGs was proposed, in which data of the optical intensity vs wavelength from the output of the spectrograph will be transferred to a computer system, and the average of the target intensity peaks will be calculated. This average value signal will drive a current source coupled to an actuator to stretch the aperiodic FBGs to shift their Bragg wavelengths, thus reducing the average intensity of the emission lines during the observation of a NIR astronomical field. We expect that a system like this can be used to improve the instrumentation under trial in ground telescopes, and to extend their use for NIR astronomical observation.
R. Benítez-Álvarez would like to thank CONACYT for a Ph.D. studentship and SIP IPN for the BEIFI grant awarded. F. Martínez-Piñón would like to thank SIP IPN for their support of this research project.


 nueva página del texto (beta)


