1. INTRODUCTION
To better understand the structure and evolution of the Milky Way, open clusters (OCs) are helpful probes. OCs can be used to examine the history of star evolution because they are created by the collapse and fragmentation of massive molecular clouds (Bate et al. 2003; Harris and Pudritz 1994). For more than 1.3 billion sources, the third Gaia data release (Gaia DR3) offers precise five-parameter astrometric data (positions, proper motions, and paral laxes). Gaia DR3 demonstrates how well these data can be utilized to identify cluster members, particularly in high-density areas, and it is quite successful. Over the years, OCs have been the focus of numerous studies. They are crucial and frequently utilized to understand different aspects of the Galactic disc, such as the Milky Way’s spiral arms (Bonatto et al. 2006).
2. DATA ANALYSIS AND PROCEDURE
In our previous research (Badawy et al. 2022), we studied the vector point diagrams of a large sample of open stellar clusters selected from the Dais Catalog using the astrometric data of Gaia DR2. Here, we selected 9 objects that lie very close to the galac tic plane and have not been studied astrometrically before using Gaia DR3 (Gaia Collaboration et al. 2022). There are full astrometric solution of posi- tions on the sky (α, δ), parallax (ω), and proper motions (µ α , µ δ ) for around 1.46 billion sources, with a limiting magnitude of about G 21. We used the library Astroquery to obtain Gaia data. Astroquery is an Astropy-affiliated package that contains a collection of tools to access online astronomical data. The standard dataset of these clusters was downloaded from Astroquery.gaia package1. Using the library python package (astroquery.simbad)2 we can get the central coordinates of our clusters. The source data were downloaded from the Gaia DR3 database service with radii of 0.2 degrees This package allows access to the European Space Agency Gaia Archive3. From the Dias catalog (Dias et al. 2014), the open clusters under study were selected and distributed according latitude and longitude, as shown in Figure (1), where the red dots represent the open clusters that are currently being studied, while the yellow dots represent all the open clusters in the catalog.
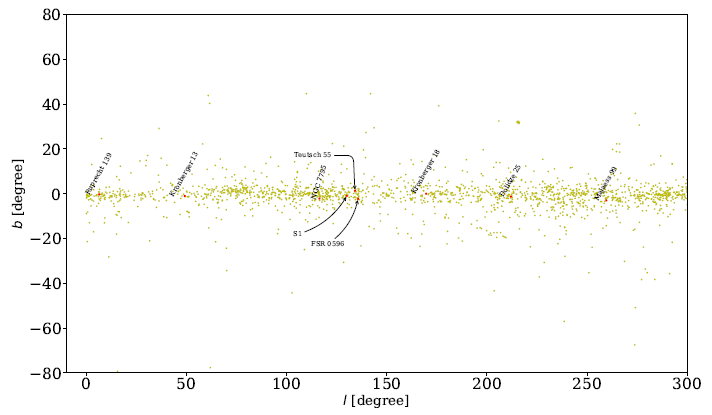
Fig. 1 The locations of the studied clusters (red dots). The yellow dots represent all the clusters obtained from Dias’ catalog (Dias et al. 2014). The color figure can be viewed online.
In order to select the membership, we follow the following steps. The vector point diagram (VPD) of proper motions is very useful in identifying field stars from the member stars of a cluster (Yadav et al. 2013; Straižys et al. 2019; Tadross and Hendy 2021, 2022). The vector point diagrams for all clusters are shown in Figure 2. The densest area of the cluster was placed in a sub-circle with a radius of 0.2 deg. Figure 3 shows those member stars that move at the same speed and direction in the sky (co-moving stars). The position uncertainties are 0.01 0.02 mas for G < 15, 0.05 mas at G = 17, 0.4 mas at G = 20, and 1.0 mas at G = 21 mag. Due to the high accuracy of Gaia DR3, we use the sources that have G 20.5 mag. The proper motion uncertainties are 0.02 0.03 mas/yr for G < 15, 0.07 mas/yr at G = 17, 0.5 mas/yr at G = 20, and 1.4 mas/yr at G = 21 mag. The condition of 3σ for proper motions was applied to the member stars. The 3σ error in parallax was also calculated for the mean and median of the cluster. If a star of 3σ parallax error is found within the cluster mean parallax and lies inside the cluster’s region, it is considered to be a member star. If we take 2σ parallax errors instead of 3σ, some of the stars will be outside of the cluster’s region and so they will not be considered member stars of the cluster. The parallax uncer tainties are 0.02 0.03 mas for G < 15, 0.07 mas at G = 17, 0.5 mas at G = 20, and 1.3 mas at G= 21 mag. We used only sources with parallaxes > 0. In their discussion of the conventional method of inverting parallaxes to determine distance, Luri et al. (2018) explain that the method is only accurate when there are no measurement uncertainties and when the distance is > 100 pc. It is not applicable for negative parallaxes arising from the survey’s measurement process. The left hand side of Figure 4 shows the studied clusters’ parallax range. Mem- ber stars are represented by blue dots, and back- ground field stars are represented by yellow dots. The middle and right hand sides of Figure 4 show the stars’ parallaxes in relation to their magnitudes and counts. Also, one of the parameters that must be taken into consideration is the value of the renormalized unit weight error, RUWE, which indicates that the single-star model provides a good fit to the astrometric observations, when it is 1.4 (Tadross and Elhosseiny 2022). As a result, these member stars form the usual shape for the color-magnitude diagram, CMD of the cluster, (Hendy and Tadross 2021). When the radius of the cluster is calculated (see § 3), all the stars that fall within this radius are regarded as member stars, and the stars outside this radius are regarded as background field stars.
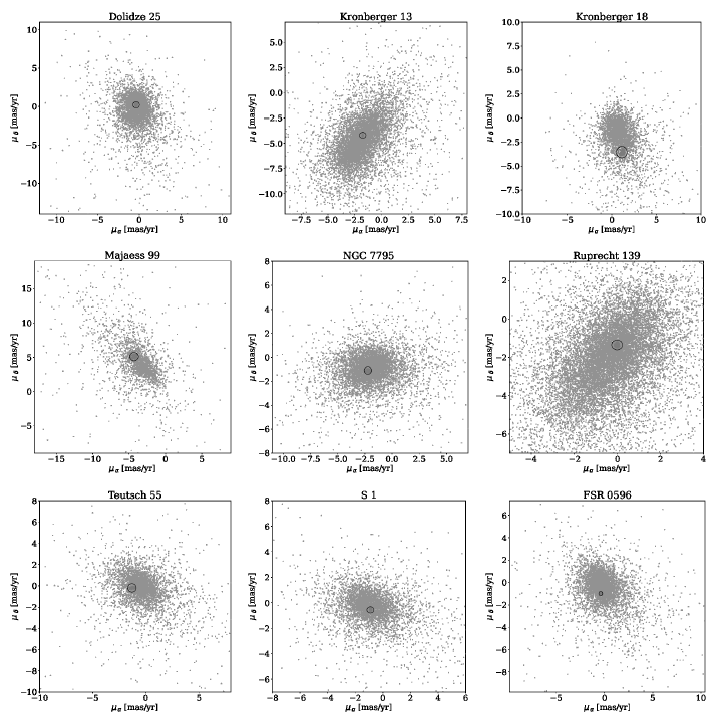
Fig. 2 The vector point diagrams (VPDs) of the studied clusters. The densest areas were placed in sub-circles with radii of 0.2 degrees.
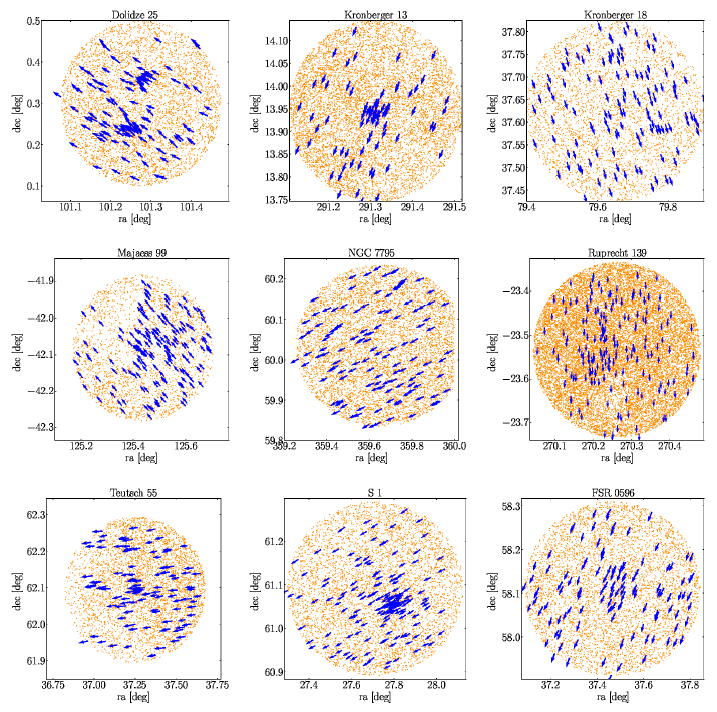
Fig. 3 Co-moving stars of the studied clusters. The blue arrows indicate the member stars as they move together in the same direction and speed, while the yellow dots show the background field stars. The color figure can be viewed online.
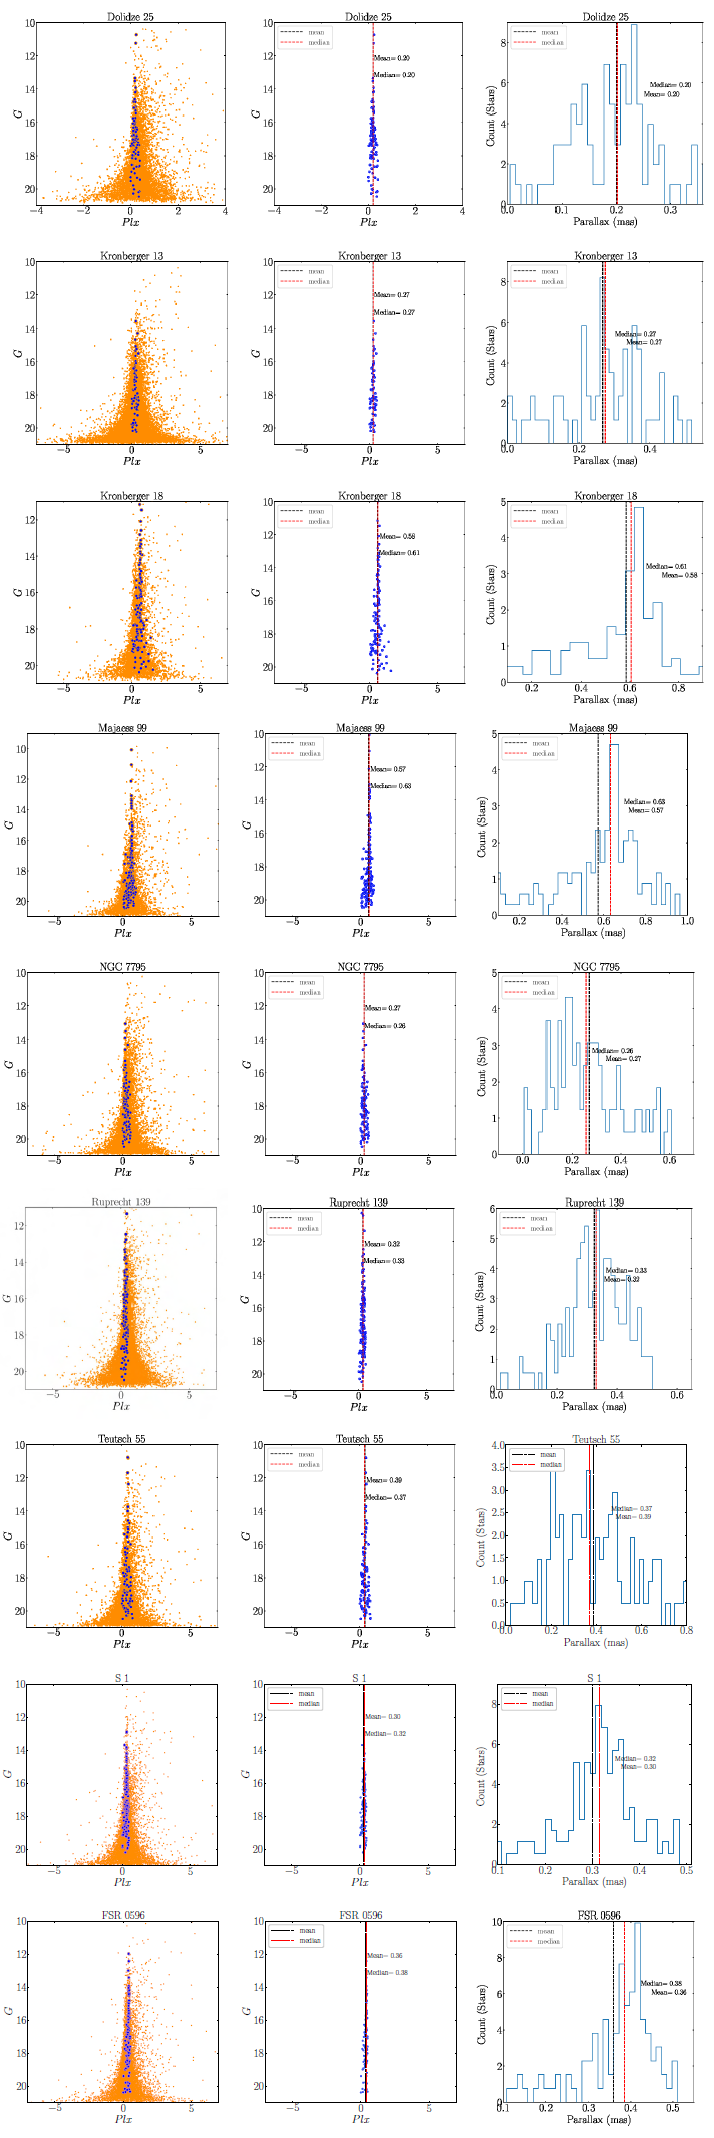
Fig. 4 The left-hand panels show the parallax range of studied clusters. The blue dots represent the member stars, while the yellow dots represent the background field stars. The middle and right hand panels show the parallax versus the magnitudes and the count numbers. The color figure can be viewed online.
3. OPEN CLUSTER SELECTION
Based on the Dias catalog (Dias et al. 2014), which has 2167 open clusters, we selected the current 9 open clusters that are close to the galactic plane and have members’ proper motions separated from the field stars. The quality of Gaia DR3 astrometry provides high accuracy proper motions in right as- cension and declination (µ α , µ δ ). Some OCs in Gaia, through, (Cantat-Gaudin et al. 2019) as well as OCs with unclear overdensities in VPDs, were excluded from our study. Kronberger13 and Ruprecht 139 are located in the first Galactic quadrant, and the rest of the clusters are located in the second Galactic quadrant.
The investigated nine open clusters, Dolidze 25 (Number=555 stars, Distance=6800 pc, E(B V)=0.80 mag, log age=6.80 yr, Ra- dius=10.50 arcmin). Kronberger 13 (Number=26 stars, Distance=1380 pc, E(B V)=1.13 mag, log age= 8.60 yr, Radius= 2.53 arcmin). Kronberger 18 (Number=40 stars, Distance= 3250 pc, E(B V)=1.29 mag, log age= 8.00 yr, Radius=2.00 arcmin). Majaess 99 (Number=85 stars, Radius=5.50 arcmin). NGC 7795 (Number=806 stars, Distance=2105 pc, E(B V)=1.00 mag, log age=8.65 yr, Radius=11.00 arcmin). Ruprecht 139 (Number=1416 stars, Distance=550 pc, E(B V)=0.15 mag, log age=9.05 yr, Radius=11.58 arcmin). S1 (Number=101, Distance=2200 pc, E(B V)=0.77 mag, log age=7.40 yr, Radius=4.00 arcmin). Teutsch 55 (Num- ber=80 stars, Distance=6020 pc, E(B V)=0.82 mag, log age=6.70 yr, Radius= 4.50 arcmin). FSR 0596 (Number=29 stars, Distance=1417 pc, E(B−V)=0.52 mag, log age=9.15 yr, Radius=2 arcmin). These OCs have been reported by Sampedro et al. (2017). A cluster may be difficult to find depending on a variety of parameters, including the density of the background, interstellar extinction, the population density, the age, and the proper motions of the field stars (Cantat-Gaudin et al. 2018).
4. SPATIAL STRUCTURE: CLUSTERS’ SIZES, CENTERS, AND RICHNESS
Knowing cluster size is a substantial issue to in- vestigate the cluster’s dynamic evolution. It is hard to determine the precise cluster center and radial extent. Cluster radius estimation is one of the most significant basic parameters (Bisht et al. 2020). The cluster center is taken at the most over-condensation area of the cluster region taken from Dias’ catalog. Subsequently, using Gaia DR3 data, we divided the area of the cluster into equal-sized bins in RA and Dec and counted the stars in each bin. The mean and median values have been applied to both RA and Dec. We estimated the radial stellar density profile (RDP) by estimating the stellar density inconcentric circular rings centered at the cluster center. The number of stars in each annular region is counted (Joshi et al. 2012). The number density in the i zone is then ρ i = N i /A i , where N i and A i are the star number and the area of the i zone, respectively. The error bars are derived supposing that the number of stars in an area follows the Poisson error. The limiting radius R lim could be estimated to cover the entire cluster region and reached a sufficient sta- bility, where the member stars merge with the field ones (Tadross and Hendy 2022). Therefore, R lim was calculated according to the following formula of Bukowiecki et al. (2011); we can get the boundary radius by applying the equation as follows:
where σ bg is the uncertainty of the f b value. So, the estimated radius of such cluster is just a minimum radial range of the cluster (Maurya and Joshi 2020).
The spatial structure and radial density of the OCs were derived by fitting the RDP given by King (1966) as follows:
where f b , f o , and R c are the background field density, central star density and the core radius of the cluster, which is defined as the radial distance from the center where the stellar density f (R) becomes half of its central value f o . The estimated values of the structural parameters are reported in Table 1 for all the clusters. The stellar density distributions for the studied clusters are shown in Figure 5 where the solid red curves are the King profiles. Furthermore, the tidal radius of the cluster R t is the distance from the core of the cluster, where the effect of gravity for the Galaxy is equal to that of the cluster. With the mass calculation of these clusters, the tidal radius can be estimated by using Jeffries et al. (2001) equation as follows:
where R t and M c are the tidal radius (in parsecs) and the total mass of the cluster (in solar masses). The concentration parameter C indicates how the member stars are prominent compared with the field stars; based on Peterson and King (1975), we can obtain the concentration parameter as follows:
TABLE 1 THE STRUCTURE PARAMETERS’ VALUES OF THE STUDIED CLUSTERS
| Cluster
... |
fo
star/arcmin2 |
fb
star/arcmin2 |
Rlim
arcmin |
Rc
arcmin |
Rt
arcmin |
C ... |
| Dolidze 25 | 81.75 | 4.27 | 5.40 | 0.12 | 7.12 | 1.65 |
| Kronberger 13 | 85.24 | 39.93 | 5.25 | 0.89 | 6.27 | 0.77 |
| Kronberger 18 | 89.74 | 13.04 | 4.80 | 0.34 | 7.60 | 1.15 |
| Majaess 99 | 341.84 | 8.85 | 4.20 | 0.12 | 7.71 | 1.54 |
| NGC 7795 | 3.83 | 1.81 | 4.28 | 0.50 | 6.33 | 0.32 |
| Ruprecht 139 | 640.91 | 59.90 | 3.70 | 0.21 | 11.52 | 1.24 |
| Teutsch 55 | 242.59 | 17.62 | 4.30 | 0.32 | 7.84 | 1.13 |
| S 1 | 242.89 | 20.49 | 4.30 | 0.22 | 8.70 | 1.29 |
| FSR 0596 | 55.00 | 20.49 | 3.53 | 0.09 | 6.36 | 1.59 |
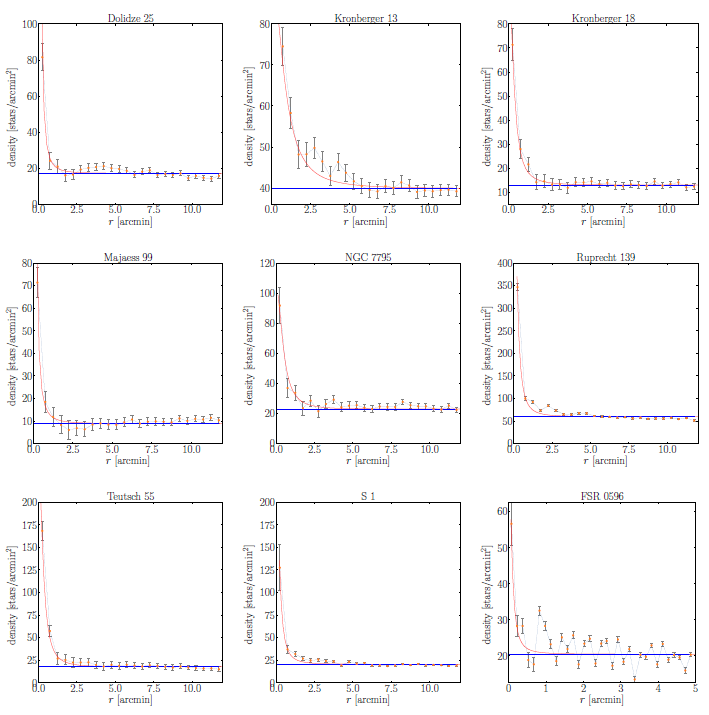
Fig. 5 The RDP curves of the studied clusters. Errors are determined by the relation
5. COLOR-MAGNITUDE DIAGRAM, AGE AND DISTANCE
The distances and ages of the Galactic OCs are important parameters when using them as tracers to investigate the structure and chemical evolution of the Galaxy. The analysis of the color-magnitude diagram (CMD) is a commonly used method for analyzing the observable main sequence of a cluster. Due to their sharing the same origin, the cluster members move through space in the same direction and at the same speed. It is necessary to identify which star evolutionary isochrones (from the COLIBRI tracks of Marigo et al. 2017) match well the cluster’s main-sequence curve (CMD 3.6 input form)4. To lessen the impact of field stars contamination only the cluster members are used. By fit- ting the theoretical isochrones of solar metallicity Z = 0.0152 provided by Marigo et al. (2017) on the CMD of the clusters, the ages and distances of the clusters have been determined. The passbands of the Gaia filters are obtained from Riello et al. (2021), as listed in Table 2. To achieve the best fit while changing the isochrone of a given age for different distance-modulus, the reddening E(G BP G RP ) values established are employed as reported in Table 3. The presence of interstellar dust lying along the line of sight of the cluster reddens the observed magnitudes and colors due to the scattering of background star light by dust particles. The redding values are taken from the isochrones fitting to the CMD of the studied clusters. The red lines in Figure 6 show the best fitting isochrones to the CMDs of the studied clusters.
TABLE 3 THE PHYSICAL PARAMETERS’VALUES OF THE STUDIED CLUSTERS
| Cluster
... |
ra(2000)
degree |
dec(2000)
degree |
l(2000)
degree |
b(2000)
degree |
E(BP − RP)
mag |
(m −M)
mag |
AG
mag |
d
PC |
Plx
mas |
| Dolidze 25 | 101.27 | 0.30 | 211.94 | -1.27 | 0.90 | 13.80 | 1.67 | 2666 | 0.27 |
| Kronberger 13 | 291.31 | 13.94 | 49.17 | -0.98 | 1.60 | 13.5 | 2.98 | 1270 | 0.34 |
| Kronberger 18 | 79.65 | 37.62 | 169.64 | 0.03 | 0.20 | 10.70 | 0.37 | 1164 | 0.58 |
| Majaess 99 | 125.44 | -42.08 | 259.60 | -2.98 | 0.69 | 11.60 | 1.28 | 1158 | 0.63 |
| NGC 7795 | 359.65 | 60.035 | 116.37 | -2.16 | 0.75 | 13.86 | 1.39 | 3104 | 0.27 |
| Ruprecht 139 | 270.26 | -23.53 | 6.41 | -0.23 | 1.30 | 13.50 | 2.42 | 1644 | 0.39 |
| Teutsch 55 | 37.25 | 62.09 | 134.08 | 1.35 | 0.92 | 13.70 | 1.71 | 2500 | 0.43 |
| S 1 | 27.71 | 61.09 | 130.05 | -0.96 | 1.00 | 13.80 | 1.86 | 2443 | 0.41 |
| FSR 0596 | 37.47 | 58.11 | 135.65 | -2.31 | 0.03 | 10.00 | 0.05 | 977 | 0.41 |
| TABLE 3. CONTINUED | |||||||||
| Cluster
... |
TR Myr |
logage yr |
τ
... |
N Stars |
MV mag |
MC
M⊙ |
IMF
... |
µα
mas/yr |
µδ
mas/yr |
| Dolidze 25 | 12.55 | 7.70 | 3.99 | 81 | -2.01 | 116.07 | -2.35 | -0.40 | 0.33 |
| Kronberger 13 | 4.59 | 9.00 | 217.86 | 77 | -6.06 | 79.33 | -2.40 | -1.76 | -4.21 |
| Kronberger 18 | 3.57 | 8.35 | 62.71 | 120 | -4.08 | 141.24 | -1.30 | 1.11 | -3.55 |
| Majaess 99 | 3.17 | 7.50 | 9.97 | 155 | -3.71 | 147.34 | -2.35 | -4.31 | 5.13 |
| NGC 7795 | 12.81 | 9.00 | 78.06 | 108 | -3.83 | 145.76 | -2.35 | -10.81 | -2.87 |
| Ruprecht 139 | 2.86 | 8.00 | 34.96 | 175 | -8.16 | 491.01 | -2.35 | 0.02 | -1.37 |
| Teutsch 55 | 6.16 | 7.50 | 5.13 | 110 | -5.71 | 155 | -2.35 | -1.22 | 0.18 |
| S 1 | 8.58 | 8.50 | 36.83 | 160 | -5.33 | 212.46 | -2.35 | -0.74 | -0.83 |
| FSR 0596 | 2.06 | 9.50 | 1534.95 | 116 | -1.76 | 82.79 | -2.35 | -0.41 | -0.98 |
| TABLE 3. CONTINUED | |||||||||
| Cluster
... |
X⊙
pc |
Y⊙
pc |
Z⊙
pc |
RGC
kpc |
|||||
| Dolidze 25 | -2261.82 | -1410.05 | -59.09 | 10.56 | |||||
| Kronberger 13 | 830.21 | 960.81 | -21.71 | 19.19 | |||||
| Kronberger 18 | -1145.02 | 209.32 | 0.61 | 21.15 | |||||
| Majaess 99 | -208.76 | -1137.43 | -60.20 | 8.48 | |||||
| NGC 7795 | -1377.71 | 2779.03 | -116.99 | 9.97 | |||||
| Ruprecht 139 | 1633.71 | 183.54 | -6.60 | 18.37 | |||||
| Teutsch 55 | -1738.67 | 1795.42 | 58.90 | 10.10 | |||||
| S 1 | -1571.74 | 1869.81 | -4.93 | 9.95 | |||||
| FSR 0596 | -698.07 | 682.41 | -39.38 | 20.71 | |||||
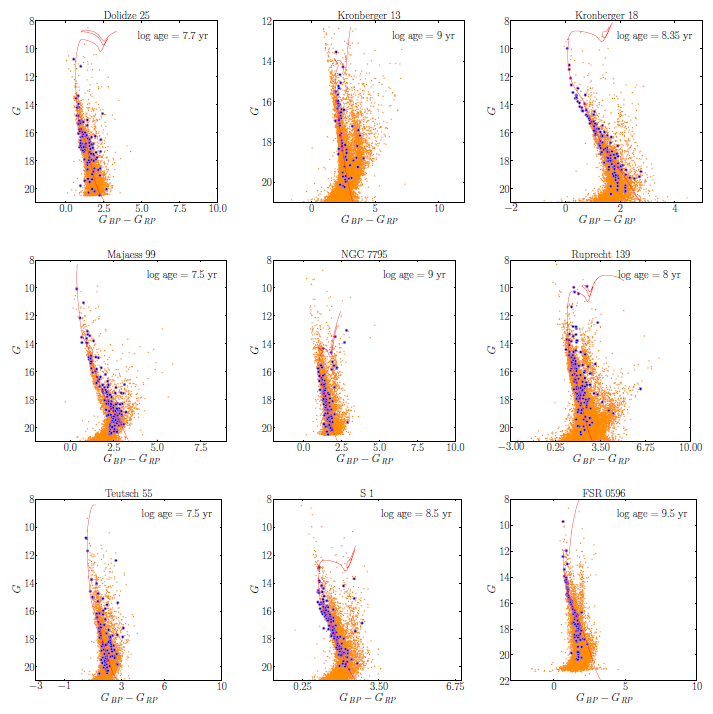
Fig. 6 The color-magnitude diagrams of the studied clusters. Probable cluster members are represented by blue dots which are obtained from the VPDs. The color figure can be viewed online.
To calculate the true distance to the clus- ter, the apparent distance modulus must be corrected for the reddening parameter, which has a significant impact on the total absorption value, (m − M ) o = (m − M ) − A G , where A G = 1.86E(G BP G RP ). By converting the current color excess to E(B V ) and correcting the magnitudes for interstellar reddening, these ratios have been employed, with A V = R V E(B − V ), where R V = 3.1.
As reported in Table 3, the estimated Cartesian Galactocentric coordinates (X ⊙, Y ⊙, Z ⊙) and dis- tances from the Galactic center (R GC ) are provided. The calculation of cluster’s geometric distances has been taken from Tadross (2011). The distance be- tween the Sun and the Galactic core is R o = 8.20 kpc (Bland-Hawthorn et al. 2019). The distance from the Sun, R ⊙, the axes of the projected rectangular distances on the Galactic plane, X ⊙ and Y ⊙, and the distance from the Galactic plane, Z ⊙, are known as the Galactic geometric distances. Such distances are significant for studying the Galaxy’s structure or the traces left by the Milky Way arms.
6. LUMINOSITY FUNCTION
The total number of a cluster stars across all magnitude bins is known as the luminosity function (LF). Figure 7 provides the predicted LF for the studied clusters. The LF shows how the cluster members absolute magnitudes are distributed. The apparent G magnitudes of the cluster members were converted into absolute magnitudes using the distance moduli determined through isochrone fitting, M g = G (m - M ). By using the data from the isochrones of Marigo et al.(2017) at the cluster’s age, it is possible to determine the luminosities and masses of the cluster members. For the most effective potential estimates of the LF and mass function (MF) which will be mentioned in the next section, the magnitude bin intervals are chosen to be suitable for stars in each bin. Table 3 shows the LF and MF derived for the studied clusters.
7. MASS FUNCTION
Understanding the process of star formation and the subsequent chemical and dynamical evolution of the star clusters depends heavily on the initial mass function (IMF) investigations Kroupa (2002). The primary link between the bright, massive members and the less massive, fainter members is provided by the IMF. It is essential for understanding the early dynamic evolution of star clusters and acts as historical evidence of the star formation process. Due to the dynamic evolution of the star system, a direct determination of IMF for the cluster is not feasible. According to Salpeter (1955) power law, which states that the number of stars in each mass range declines as the mass increases, the IMF was calculated for the bright massive stars > 1M
⊙. Comparing the color and magnitude of each star to the theoretical solar metallicity isochrones (Marigo et al. 2017) at the estimated age, we were able to determine the mass of each star photometrically. On the chosen isochrones, the mass of each cluster member was calculated from its closest neighbour. As a result, we calculated the current MF, which is the number of stars per mass bin, and is frequently described by the power law
where log(dN ) is the logarithmic number of stars per unit logarithmic mass interval (dM ). Salpeter (1955) determined the slope of the mass function α as −2.35 among the solar neighborhood stars, which is typically regarded as a classical value of the MF slope, for the mass range 0.4 < M/M⊙ ≤ 10. We determined the mean mass in each magnitude bin of the G band. We provide the mass range, mean mass, and cluster members in different brightness range for the clusters. The two-stage power law in some of the MF slopes of OCs may be due to the dynamics of clusters and/or to initial conditions in star formation events (Bonatto & Bica 2005). The resulting mass function obtained for the clusters is shown in Figure 8.
8. THE DYNAMIC RELAXATION TIME
The dynamic relaxation time TR is the time during which the velocity distribution of stars in a cluster approaches its equilibrium distribution. We estimated the dynamic relaxation time to determine if the mass segregation process in the clusters is caused by dynamical development or by the star formation process itself. According to Spitzer and Hart (1971), the relaxation time, TR, is mathematically defined as
where N is the total number of stars in the cluster. R
h
is the star cluster’s half-mass radius, and
9. CONCLUSIONS
The main astrophysical parameters of the nine open stellar clusters Dolidze 25, Kronberger 13, Kronberger 18, Majaess 99, NGC 7795, Ruprecht 139, Teutsch 55, S1, and FSR 0596 were estimated in this paper for the first time using the Gaia DR3 database. Comparing the astrometric parameters obtained here for 5 OCs (Kronberger 18, Majaess 99, NGC 7795, Ruprecht 139, and Teutsch 55) with those provided by Dias et al. (2018). Kronberger 18 (radius = 3 arcmin, µ α = 2.01 mas/yr, µ δ = 3.89 mas/yr, number = 49 stars). Majaess 99 (radius = 6 arcmin, µ α = 6.21 mas/yr, µ δ = 5.56 mas/yr, number = 69 stars). NGC 7795 (radius = 11.5 arcmin, µ α = 1.57 mas/yr, µ δ = 0.95 mas/yr, number = 879 stars). Ruprecht 139 (radius = 7 arcmin, µ α = 0.21 mas/yr, µ δ = 2.31 mas/yr, number = 658 stars). Teutsch 55 (radius = 5 arcmin, μα = −1.11 mas/yr, μδ = −0.29 mas/yr, number = 87 stars) it is clear that they are well consistent with our results. Dolidze 25, S1, FSR 0596, and Kronberger 13 are not found in that catalog. Majaess 99 was reported only by Monteiro and Dias (2019); their results are in good agreement with ours as well. Majaess 99 (log age = 6.66 ± 0.01 yr, distance = 1.32 ± 0.08 kpc, E(B-V ) = 0.02 ± 0.02 mag, number = 46 stars, μα = −4.37±0.002 mas/yr, μδ = 5.19±0.01 mas/yr, parallax = 0.66 ± 0.03 mas). All the parameters of our studied clusters are summarized and listed in Table 3.


 nueva página del texto (beta)


