1. INTRODUCTION
Observed rotational modulation of brightness in a light curve of a solar-type star is interpreted as a strong photometric evidence of cool star spots on the stellar surface, which co-rotate with the surface. These spots might emerge in various locations on the surface of the star as a manifestation of the magnetic activity, which is commonly observed among solartype stars. Such a light curve allows one to trace the temporal and spatial evolution of spots, as well as to determine the photometric period of the star. Finding the photometric period of a single star is crucial because that period can be considered as the rotation period the star. In the case of binary stars, it is possible to determine the photometric and orbital period separately. If the components of the binary system are solar-type stars, then a comparison between the photometric period and the orbital period provides hints on the surface differential rotation, which is one of the key parameter that drives the dynamo mechanism in stellar interiors.
Until the era of very high precision space photometry, photometric studies of the magnetic activity of solar-type stars had relied on long-term time-series photometry obtained from dedicated ground-based telescopes (Henry & Eaton 1995; Strassmeier et al. 1997; Rodonò et al. 2001) or on all sky surveys (Pojmanski 1997; Kochanek et al. 2017). These sources provided photometric data with an uncertainty of a few percent of a magnitude (rarely at milimag level; e.g. Henry & Eaton 1995) and enabled to trace the short and long-term magnetic activity behaviour of solar-type stars in terms of mean brightness, light curve amplitude and photometric period.
After entering the era of groundbreaking space photometry, astronomers had extremely high precision photometric data obtained in a wide wavelength range. Especially, the Kepler space telescope (Borucki et al. 2010; Howell et al. 2014) reached a photometric precision down to a few tens of partper-million. Such a precision not only enabled to detect a planetary transit in a light curve, which was the primary mission of the Kepler space telescope, but also sub-millimag amplitude variability of stars. In the case of magnetic activity of solar-type stars, such precision allowed detection of very small amplitude rotational modulation of brightness, which could not be distinguished in ground-based photometry due to the typical observational scatter of a few per-cent of a magnitude. In addition to its very high precision, Kepler photometry spans over four years without any considerable time gap, which enables one to trace low amplitude photometric signs of magnetic activity of solar-type stars. All these properties encouraged research for more detailed and comprehensive photometric studies of stellar flares and differential rotation of large sample of stars (Balona 2015; Reinhold & Gizon 2015) or of individual targets, (particularly eclipsing binaries; Yoldaş & Dal 2021; Özdarcan et al. 2018). In some cases,Kepler photometry revealed effects of two separate variability mechanisms, (e.g. pulsation and cool spot activity), in eclipsing binary system (see, e.g., Özdarcan & Dal 2017).
In this study, we present a comprehensive analysis of a solar-type eclipsing binary system KIC4832197. Our analysis is based on ground-based medium resolution optical spectroscopy and Kepler photometry. KIC4832197 draws attention with its very shallow eclipse depths in its light curve and its remarkable out-of-eclipse variability with an amplitude that is comparable to the eclipse depths. Neither eclipses nor out-of-eclipse variability of the system were discovered until the advent of very high precision Kepler photometry. The system was included in the planet candidate catalogue due to its shallow eclipse depths (Coughlin et al. 2016). However, no confirmed exoplanet in this system has been reported so far. KIC4832197 appeared as a late A spectral type star according to Tycho-2 measurements (B − V = 0m . 202 ± 0m . 111, Høg et al. 2000). On the other hand, more recent and precise broadband UBV colours and magnitudes of the system are V = 11m . 673 ± 0m . 018, B − V = 0m . 496 ± 0m . 030 and U −B = −0m . 002±0m . 032 (Everett et al. 2012), which indicate an F7 spectral type for the system (Gray 2005).
Remarkable out-of-eclipse variability may indicate cool spot activity or pulsations on one or both components. Furthermore, shallow eclipses may indicate a possible third light, which may reduce eclipse amplitudes in the light curve depending on its contribution to the total light of the system. All these properties of KIC4832197 are promising not only for testing stellar evolution models, but also for further studies on the variability mechanism currently occurring in one or both components. Analysis of very high precision Kepler photometry is excellent for such studies.
In this context, we combine ground-based optical spectroscopy and space photometry to determine the physical properties of the system and its evolutionary status. We further analyse brightness variability at out-of-eclipse phases, which can shed light into the current variability mechanism on the components of KIC4832197. We organize the remaining parts of our study as follows. We describe the observational data and reduction in the next section. Section 3 includes light time variation analysis, spectroscopic and photometric modelling of the system, including atmospheric parameter estimation of each component, spectroscopic orbit of the system and light curve analysis. In the last section, we summarize our findings and discuss our results.
2. DATA
2.1. Spectroscopy
Medium resolution optical spectra of KIC4832197 were obtained at TUB¨ ITAK National˙ Observatory (TNO) with the 1.5 m Russian-Turkish telescope and the Turkish Faint Object Spectrograph Camera (TFOSC1). An Andor DW436-BV 2048 × 2048 pixels CCD camera with a pixel size of 13.5 × 13.5 µm 2 was used, which allows recording optical spectra between 3900 - 9100 Å in 11 ´echelle orders. This instrumental set-up provided an average resolution of R = λ/∆λ = 2700 ± 500 around the λ = 5500 Å wavelength region. Observations were carried out on eight nights between July 2014 and April 2017. Ten spectra were recorded in total.
Conventional procedures for reducing ´echelle spectrum images were followed. These steps are applied under IRAF environment2 and start with the removal of bias level and continue by division of biasremoved object and calibration lamp images by a normalized flat-field image. Then, scattered light correction and cosmic rays removal steps are applied to the bias and flat-field corrected images. Finally, object and calibration lamp spectra are extracted from the ´echelle orders. Wavelength calibration of the extracted object spectra is done by using a Fe-Ar calibration lamp spectrum recorded on the same observing night. After completing standard reduction steps, all object spectra were normalized to unity by applying 4th or 5th order cubic spline functions.
2.2. Kepler Photometry
Very high precision space photometry of KIC4832197 was obtained by Kepler spacecraft. The spacecraft recorded images in 6.02 second exposure times with 0.52 second read-out times in a broad wavelength range between 4100Å and 9100Å (Gilliland et al. 2010). The broad wavelength range allows to record more photons in a single exposure, which increases precision, at the expense of losing colour information. From the recorded images, two data sets were created depending on two separate integration times; 58.9 second (short cadence data) and 29.4 minute (long cadence data). These integrations were grouped as separate data sets, where each set covered approximately three months, called quarters, except the first quarter, which covered ten days of commissioning phase and is called quarter zero (Q0). During operation of the spacecraft over 4 years (between 2009 and 2013) photometric data were collected for eighteen quarters in total (from Q0 to Q17). Continuous long cadence photometry obtained in each quarter is available for the majority of Kepler targets, including KIC4832197. Long cadence photometry of KIC4832197 for each quarter is obtained from Mikulski Archive for Space Telescopes (MAST). Prior to analyses, it is necessary to remove instrumental effects from the long cadence data. For each quarter, simple aperture photometry (SAP) fluxes are considered. These fluxes are de-trended as described in Slawson et al. (2011) and Prša et al. (2011). De-trended fluxes are then normalized to unity. The analysis and modelling process is based on these normalized fluxes. We show the long cadence light curve of KIC4832197 in Figure 1.
3. ANALYSIS
3.1. Light Time Variations
The first step of the analysis is to determine mideclipse times of KIC4832197 for primary eclipses. In principle, mid-eclipse times can be determined straightforwardly by applying the Kwee - van Woerden method (Kwee & van Woerden 1956) to observations close by to mid-eclipse time. An alternative way is to fit a function to the observational data around the estimated mid-eclipse time and determine the extremum point of this function, which corresponds to the mid-eclipse time. These methods may work flawlessly for a light curve of an ordinary eclipsing binary, which shows symmetric eclipse light curves with respect to the mid-eclipse time and exhibits flat or slightly distorted maxima at out-ofeclipse phases. Such light curves indicate the absence of intrinsic variability for any of the component. Looking at Figure 1, one may easily notice the variable nature of the light curve. Because of the relatively short orbital period and integration time of long cadence data, a few data points can be found around the expected mid-eclipse time for a given orbital cycle. Combination of these two effects gives a complex shape to the light curve and makes the methods mentioned above unsuited for the precise determination of mid-eclipse times. In such cases, one of the most reliable ways is to find a best-fitting light curve model and then only adjust the mid-eclipse time of the primary minimum in the model for each cycle. We follow exactly this way for a precise determination of mid-eclipse times from long cadence data.
Actually, this is an iterated process, which starts by preparing a phase-folded light curve with initial light elements, i.e. an ephemeris reference time (T 0) and an orbital period (P), then continues by finding the best-fitting light curve model. In the case of KIC4832197, initial T 0 and P values are adopted from the Kepler Eclipsing Binary Catalogue3 (Prša et al. 2011; Slawson et al. 2011) given in equation 1:
After finding the best-fitting light curve model, T 0 is adjusted for each orbital cycle separately, by keeping all other model parameters fixed. In this step, time-based long cadence data are considered, instead of phase-folded light curve. Thus, the mideclipse time of each orbital cycle can be determined precisely together with formal errors. Practical application of this method is done with the Wilson-Devinney code (see later sections for details). After determination of mid-eclipse times, a simple eclipse time variation (etv) diagram is constructed and linear corrections are determined and applied to both T 0 and P. Then the whole process is repeated by using the corrected T 0 and P. In most cases, two iterations are enough to obtain self consistent T 0, P, and light curve model parameters. The converged solution leads to the corrected light elements given in equation 2:
The numbers in parentheses are statistical uncertainties for the last digit of the corresponding parameter. These uncertainties are computed from a linear least squares fit. T 0 and P values given in equation 2 are adopted for further analyses and kept fixed. The resulting eclipse time variation diagram is shown in Figure 2. In the figure, an irregular undulating variation is noticeable among the scatter, with an approximate amplitude of 0d .003. Since that pattern does not repeat itself strictly over four years, it is not likely to be due to a possible third body. A more likely explanation of this pattern might be the out-of-eclipse variability of the system, which can be noticed in the b and c panels of Figure 1.
3.2. Radial Velocities and Spectroscopic Orbit
The next step of our analysis is to determine radial velocities of each component from each observed spectrum and to model the spectroscopic orbit of the system. In order to determine radial velocities of the components, we use the optical spectrum of HD184499 (T eff = 5743, log g = 4.07; Prugniel et al. 2011) as a template spectrum, which was recorded with the same instrumental set-up on 20th August, 2014. Then, each observed spectrum of KIC4832197 was cross-correlated with the spectrum of HD184499 by following the method proposed by Tonry & Davis (1979). The practical application of this method used the fxcor task (Fitzpatrick 1993) under IRAF environment. All clear absorption lines (except strongly blended or very broad spectral lines) were considered in the 5th and 6th échelle orders, which cover a wavelength range between 4900 Å and 5700 Å. In this wavelength range, it was possible to detect strong signals of both components. We show cross-correlation functions of two spectra of KIC4832197, recorded at two separate orbital quadratures, in Figure 3. The heliocentric radial velocities are tabulated in Table 1.
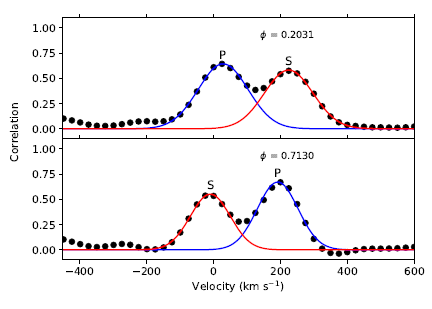
Fig. 3 Cross-correlation functions of two observed spectra recorded around orbital quadratures. P and S denote the primary and the secondary component, ϕ the orbital phase. The colour figure can be viewed online.
TABLE 1 SUMMARY OF SPECTROSCOPIC OBSERVATIONS*
| HJD
(24 00000+) |
Orbital
Phase |
Exposure
time (s) |
SNR | Primary | Secondary | ||
| Vr | σ | Vr | σ | ||||
| 56842.4581 | 0.7936 | 3200 | 120 | 61 | 10 | -150 | 11 |
| 56842.4963 | 0.8138 | 3200 | 95 | 58 | 9 | -146 | 10 |
| 56843.3937 | 0.2872 | 3200 | 90 | -141 | 10 | 70 | 15 |
| 56887.3009 | 0.4516 | 3200 | 140 | -79 | 9 | -8 | 11 |
| 56887.5063 | 0.5599 | 3200 | 95 | 7 | 11 | -74 | 13 |
| 56888.3307 | 0.9949 | 3200 | 120 | -43 | 6 | — | — |
| 57592.3910 | 0.4395 | 3600 | 90 | -81 | 9 | -1 | 9 |
| 57600.4912 | 0.7130 | 3600 | 110 | 59 | 11 | -154 | 13 |
| 57617.3447 | 0.6045 | 3600 | 90 | 17 | 10 | -106 | 17 |
| 57853.5170 | 0.2031 | 2700 | 100 | -135 | 13 | 72 | 16 |
*Along with the measured radial velocities and their corresponding standard errors (σ) in kms−1. SNR denotes the signa-to-noise ratio around 5500Å wavelength.
Preliminary inspection of the phase-folded light curve shows that the mid-primary and the midsecondary eclipses precisely occur at 0.0 and 0.5 orbital phases, respectively. This finding strongly suggests a circular orbit. Therefore, the spectroscopic orbit of the system is determined assuming zero eccentricity (i.e. e = 0). In this case, the longitude of the periastron (ω) is undefined; thus the T 0 value found in the light time variation analysis step is adopted instead of the periastron passage time. T 0 and P values are kept fixed during the modelling, while radial velocity semi-amplitudes of the components (K 1 and K 2), center-of-mass velocity of the system (V γ ) are adjusted. Application of a linear least squares fitting method to the observed radial velocities results in the best-fitting spectroscopic orbit parameters tabulated in Table 2. The agreement between the observed radial velocities and their bestfitting model is shown in Figure 4.
TABLE 2 BEST-FITTING SPECTROSCOPIC ORBIT PARAMETERS OF KIC4832197.*
| Parameter | Value |
| Porb (day) | 1.8954655 (fixed) |
| T0 (HJD24 00000+) | 54954.965798 (fixed) |
| Vγ (km s−1) | −41±2 |
| K1 (km s−1) | 104±4 |
| K2 (km s−1) | 113±5 |
| E | 0 (fixed) |
| α sin i (R⊙) | 8.15±0.26 |
| M sin3 i (M⊙) | 2.03±0.14 |
| Mass ratio (q = M 2/M 1) | 0.92±0.06 |
| rms1 (km s−1) | 5 |
| rms2 (km s−1) | 4 |
*M 1 and M 2 denote the masses of the primary and the secondary component, respectively, while M shows the total mass of the system and α sin i is the projected semimajor axis, depending on the orbital inclination i.
3.3. Spectral Type
Medium resolution TFOSC spectra allow us to determine spectral types and global atmospheric parameters for each component of KIC4832197. A spectrum recorded around any of the orbital quadrature is suitable for the atmospheric parameter determination of individual components, since the spectral lines of both components are often sufficiently separated from each other and can be distinguished at those orbital phases. This is observed in the TFOSC spectrum recorded on 30th July 2016, corresponding to 0.7130 orbital phase (see lower panel of Figure 3). Spectral types and atmospheric parameters are determined from this spectrum.
Determination of spectral types and atmospheric parameters is an iterated process, as in the case of determination of mid-eclipse times described in § 3.1. During the analysis, we fix the micro-turbulence velocity of each component at 2 kms−1. Actually, analysing high resolution optical spectra it is possible to determine the micro-turbulence velocity and the [Fe/H] abundance simultaneously, via the Blackwell diagram (Blackwell & Shallis 1979). However, due to the insufficient resolution of TFOSC spectra, we were unable to do so. Instead, we implicitly assume a 2 km/s micro-turbulence velocity and fix this value during the analysis. Although there is no strict relation in the literature to estimate micro-turbulence velocities reliably, limited observational studies indicate that 2 kms−1is appropriate for solar type stars (Landstreet et al. 2009).
It is possible to apply a constraint on the logarithm of gravity (log g) of the components. To do this, spectroscopic orbit model parameters are combined with preliminary light curve solution parameters. This step allows computation of the masses and radii of the components. Then, log g values are computed via the computed masses and radii of the components. Computed log g values are fixed in the spectral type analysis and effective temperatures of the components (T eff1 and T eff2 ) are estimated together with overall metallicity ([Fe/H]). Then, the estimated temperature of the primary component and the overall metallicity are adopted as fixed parameters, and combined light curve and radial velocity modelling is repeated. Two or three iterations are usually enough to reach a self-consistent solution.
Effective temperatures and overall metallicity are estimated by the spectrum synthesis method. ATLAS9 (Castelli & Kurucz 2004) model atmospheres, which adopt a plane-parallel atmosphere, are used for synthetic spectrum computation. A grid of synthetic spectra is computed for a temperature range of 6000 K to 7000 K with a step of 100 K. This computation is repeated for metallicities between solar ([Fe/H]=0) and sub-solar ([Fe/H]=−1.0), with a step of 0.25. The computation of synthetic spectra is done by a Python framework, iSpec software (Blanco-Cuaresma et al. 2014). Among various radiative transfer codes provided in iSpec, the Spectrum code (Gray & Corbally 1994) is adopted. iSpec also includes a comprehensive line list compiled from the third version of the Vienna atomic line database (VALD3, Ryabchikova et al. 2015). Each computed synthetic spectrum is convolved with a Gaussian line spread function to reduce the spectral resolution to the resolution of the TFOSC spectra. After that, a trial synthetic spectrum is chosen for each component among the computed spectra, and a composite spectrum of the system is computed. In order to compute the composite spectrum of the system, each individual spectrum is shifted in wavelength with respect to the radial velocity of the corresponding component and scaled with respect to the square of the ratio of the radii of the components.
Self-consistent effective temperatures and overall metallicities are determined in the third iteration, which gives T eff1 = 6300 K, T eff2 = 6100 K and [Fe/H] = −0.25. The estimated uncertainties are around 200 K for temperature and 0.25 for metallicity. The adopted ratio of radii is R 1 /R 2 = 1.27 and log g values are log g 1 = 4.30 and log g 2 = 4.47 (see next section for details). These results indicate F7V and F9V spectral types for the primary and the secondary components (Gray 2005), respectively. The observed TFOSC spectrum and the best-fitting composite spectrum are shown in Figure 5.
3.4. Light Curve Analysis and Evolutionary Status
Long cadence photometric data of KIC4832197 include 65190 individual data points in total, which means that a large amount of CPU time is required to find a best-fitting light curve model. Therefore, an average phase-folded light curve is prepared by computing an average in every 0.01 phase at out-of eclipse phases. Around mid-eclipse phases a phase step of 0.0005 is adopted in order to detect the ingress and egress phases of eclipses precisely. The average phase-folded light curve includes 556 data points in total, which enormously reduces the required CPU time for light curve modelling. Weighting of each normal data point in the phase-folded average light curve is done by considering the total number of data points, which produces the normal data point.
Light curve modelling is done with the 2015 version of the well-known Wilson-Devinney (WD) eclipsing binary light curve modelling code (Wilson & Devinney 1971; Wilson & Van Hamme 2014). Its practical application is done by the user friendly Python GUI PyWD2015 (Güzel & Özdarcan 2020). PyWD2015 allows the use of almost all features of the 2015 version of the WD code. In addition to the capabilities of the WD code, PyWD2015 includes many useful features and tools to speed up the modelling process and to trace successive iterations visually.
Two most critical parameters for an accurate light curve modelling are T eff1 and q. These have already been determined in previous sections, and are kept fixed during modelling. Effective temperatures of the components clearly indicate that both components possess a convective outer envelope; thus, gravity darkening (g) and albedo (A) values of each component are set to 0.32 (Lucy 1967) and 0.5 (Ruciński 1969), respectively. The low resolution of TFOSC spectra does not allow to determine reliable rotational velocities of the components; so, considering the non-eccentric orbit of the system, synchronous rotation is implicitly assumed for both components by fixing the rotation parameter (F) of each component to unity. A logarithmic limb darkening law (Klinglesmith & Sobieski 1970) is adopted for both components and limb darkening coefficients are taken from van Hamme (1993) for the Kepler passband. Adjustable parameters are: inclination of the orbit (i), effective temperature of the secondary component (T eff2 ), dimensionless potentials of the components (Ω1, Ω2) and luminosity of the primary component (L 1). Coarse and fine grid numbers for the stellar surface are set to 60. Modelling attempts with a possible third light contribution do not yield a reasonable model, which indicates extremely small or negative third light contribution. Therefore, the modelling process is carried out with no third light contribution. Convergence is not very quick due to the shallow eclipse depths. However, successive iterations converge slowly but firmly to a global minimum. Model parameters for the best-fitting light curve are tabulated in Table 3. In Figure 6, the phase-folded light curve and and the best-fitting light curve model are shown. A separate close-up view of each eclipse is shown in Figure 7.
TABLE 3 BEST-FITTING LIGHT CURVE MODEL PARAMETERS FOR KIC4832197.*
| Parameter | Value |
| q | 0.92 (fixed) |
| T 1(K) | 6500 (fixed) |
| g 1 = g 2 | 0.32 |
| A 1 = A 2 | 0.5 |
| F 1 = F 2 | 1.0 |
| i (◦) | 75.67(5) |
| T 2(K) | 6060(200) |
| Ω1 | 7.605(22) |
| Ω2 | 8.520(44) |
| L 1/(L 1+L 2) | 0.639(3) |
| x1,x2 | 0.685, 0.700 |
| y1,y2 | 0.270, 0.259 |
| ⟨r 1⟩,⟨r 2⟩ | 0.1498(5), 0.1219(8) |
| Model rms | 2.8 × 10⁻⁴ |
*⟨r 1⟩ and ⟨r 2⟩ show mean fractional radii of the primary and the secondary components, respectively. Uncertainties of the adjusted parameters are internal to the Wilson-Devinney code and are given in parentheses for the last digits, except T 2. The uncertainty of T 2 is assumed to be the same as that of T 1.
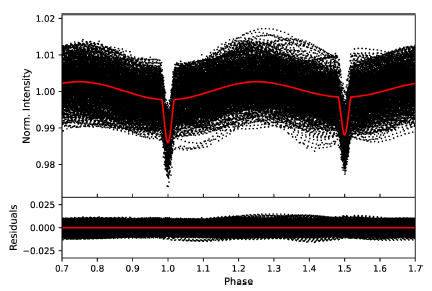
Fig. 6 Phase-folded long cadence Kepler observations and the best-fitting light curve model of KIC4832197 are shown along with residuals from the model. The colour figure can be viewed online.
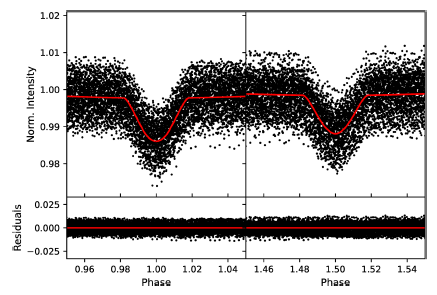
Fig. 7 Close-up view of observations and the best-fitting light curve model around eclipse phases. The colour figure can be viewed online.
Combination of the best-fitting spectroscopic orbit and light curve model parameters allows us to compute the absolute dimension of the system as well as its distance. Both the UBV colours (Everett et al. 2012) and the optical spectrum of the system indicate an F7 spectral type, which means that reddening and interstellar extinction should be negligible. Trial plotting of the system on the UBV colour-colour diagram gives E(B − V ) = 0m . 009, which is well below the observational error of B − V . Hence might be ignored for the distance computation. Considering P, K 1, K 2, i, ⟨r 1⟩ and ⟨r 2⟩ along with the published UBV magnitudes, the absolute dimension of the system is computed with the JKTABSDIM code4 (Southworth et al. 2005) and tabulated in Table 4. Calibrations given in Kervella et al. (2004) are adopted for the bolometric correction and distance computation.
TABLE 4 ABSOLUTE DIMENSION OF KIC4832197.*
| Parameter | Primary | Secondary |
| Spectral Type | F7V | F9V |
| Mass (M⊙) | 1.16(12) | 1.07(10) |
| Radius (R⊙) | 1.26(4) | 1.03(3) |
| log L/L ⊙ | 0.35(6) | 0.11(6) |
| log g (cgs) | 4.30(2) | 4.44(2) |
| M bol (mag) | 3.87(15) | 4.48(16) |
| [Fe/H] | −0.25(0.25) | |
| Separation (R⊙) | 8.41(26) | |
| Distance (pc) | 459(40) | |
* The statistical error of each parameter is given in parentheses for the last digits.
Comparing the locations of the components with stellar evolutionary tracks on the Log T eff − Log L/L ⊙ plane, it is possible to estimate the age of the system. In Figure 8, the components of KIC4832197 are plotted along with stellar evolutionary tracks computed with the PAdova and TRieste Stellar Evolution Code (PARSEC, Bressan et al. 2012). The best-matching isochrone to the positions of the components has log(age)=9.45, which indicates an age of 2.8 Gyr for the system. The estimated uncertainty for this age is approximately 0.8 Gyr. The primary source of this uncertainty is the uncertainty of the estimated effective temperatures and its propagation to the computed luminosities. Both components are still on the main sequence. However, the primary component is almost half-way through its main sequence life.
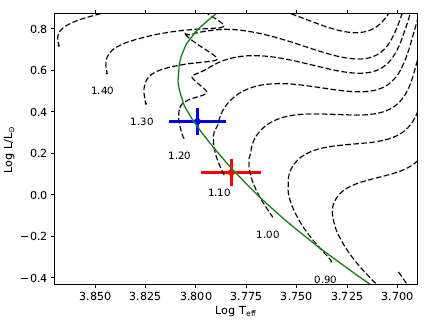
Fig. 8 Positions of the primary and the secondary components on log T eff −log L/L ⊙ plane. Dashed lines show evolutionary tracks for different masses. Each track is labelled with its corresponding mass. The continuous curve shows the isochrone for log(age)=9.45. The tracks are for a slightly sub-solar metallicity with Y = 0.273 and Z = 0.014. The colour figure can be viewed online.
3.5. Out-of-Eclipse Variability
A scatter of ±0.01 is clearly noticeable in the phase-folded light curve (see Figure 7). This scatter is a natural result of dominant brightness variability at out-of-eclipse phases (see Figure 1, lower panels). For further investigation of this variability, the best-fitting light curve model is subtracted from observations, and residuals from the model are obtained. In principle, these residuals do not include variability due to eclipses nor proximity effects of the components, and give hints on intrinsic variability of one or both components. Residuals from the best-fitting light curve model are obtained with PyWD2015 by inputting all long cadence data into the WD code and making a single differential corrections iteration. The obtained residuals are plotted in Figure 9. Quick changes in the residual light curve shape and amplitude are remarkable.
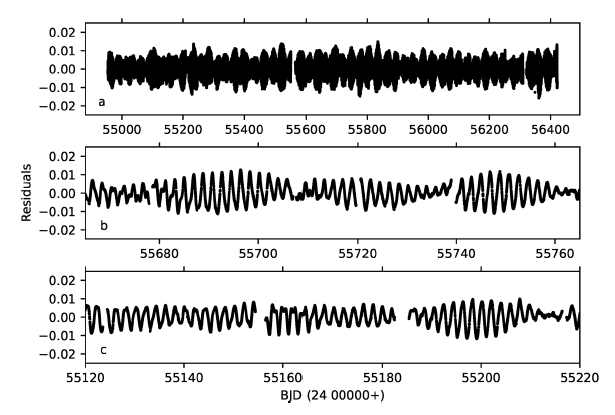
Fig. 9 Residuals from the best-fitting light curve model are plotted against time (BJD). Panel a shows the whole long cadence residuals, while Panels b and c show different portions of the whole set.
In order to see the reflection of this variability in the frequency-amplitude plane, a Lomb-Scargle periodogram (Lomb 1976; Scargle 1982) is applied to the whole long cadence residuals via a Python script pysca (Herzberg & Glogowski 2014). pysca allows quick and practical computation of the amplitude spectrum and can extract significant frequencies above a defined noise level. Adopting a 24.498 cycle/day (c/d) as Nyquist frequency, a single pysca run results in the amplitude spectrum given in Figure 10. The adopted Nyquist frequency corresponds to twice (≈ 59 min) the integration time of a single long cadence exposure. In the resulting amplitude spectrum, two dominant peaks are clearly seen around the orbital frequency, but no signal appears at the precise location of the orbital frequency. Frequency values of the two dominant peaks are tabulated in Table 5, together with the orbital frequency.
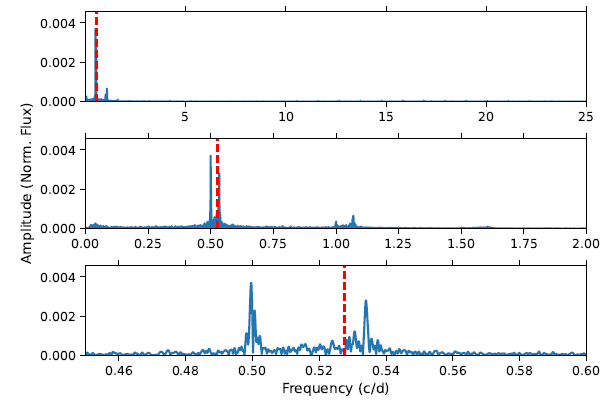
Fig. 10 Amplitude spectrum of light curve residuals. The uppermost panel shows the whole amplitude spectrum between 0 and 24.498 c/d. The middle panel focuses on 0 and 2 c/d, where dominant peaks appear. The lowermost panel shows a detailed view of the two most dominant peaks and the orbital frequency. In each panel, the orbital frequency is marked with a vertical dashed (red) line. The colour figure can be viewed online.
TABLE 5 FIRST TWO DOMINANT FREQUENCIES (F1, F2)*
| Frequency
number |
Frequency
(c/d) |
Amplitude
(Flux ×103) |
Phase
(radian) |
| f1 | 0.4995769(76) | 3.70(2) | 0.4947(8) |
| f2 | 0.5339561(88) | 2.79(2) | 0.807(1) |
| forb | 0.5275750(1) | — | — |
*Resulting from the frequency analysis of the residual light curve of KIC4832197 along with the orbital frequency (f orb ) of the system. Uncertainties are given in parentheses for the last digits.
It is also possible to trace the behaviour of the detected frequency peaks for each Kepler quarter separately. A close view of the f 1 and f 2 peaks is shown in Figure 11 for each Kepler quarter, separately. It is apparent that f 1 strongly appears in most of quarters while f 2 weakens or disappears in some quarters.
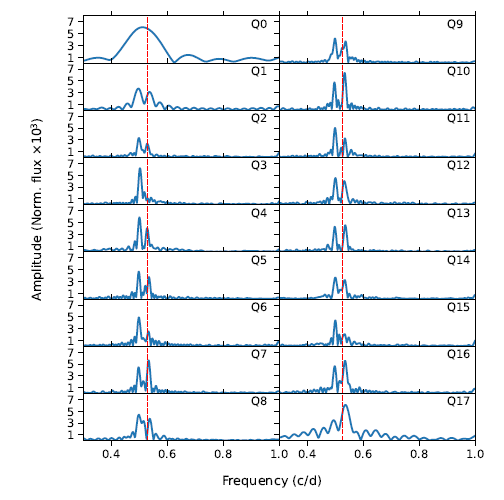
Fig. 11 Close view of the amplitude the spectrum of light curve residuals for each quarter of Kepler data. Panels are focused on the frequency region around f orb , which is shown by a vertical (red) dashed line. Each panel is labelled with its corresponding quarter in the upper left corner. The colour figure can be viewed online.
The corresponding frequencies of the first two dominant peaks in the amplitude spectrum give the phase folded residual light curves shown in Figure 12. Phase folding is done with respect to the reference ephemeris given in equation 2 and the corresponding period values of the frequencies listed in Table 5. A wave-like light curve pattern can be noticed easily in both panels of the figure. This picture appears to be the reflection of a double-humped structure of the light curve (see Figure 1, Panels b and c), which is the frequently observed through four years of long cadence data. Estimated spectral types of the components in § 3.3 suggest that these f 1 and f 2 frequencies are likely the result of cool spot activity on one or both components.
4. SUMMARY AND DISCUSSION
Analyses of medium resolution ground-based optical spectroscopy and very high precision Kepler photometry show that KIC4832197 is composed of F7V and F9V stars possessing slightly sub-solar metallicity ([Fe/H]=−0.25±0.25). The components move around the center-of-mass of the system in a circular orbit with a period of 1d .8954650. The Kepler long cadence light curve of the system is dominated by a wave-like brightness variability whose amplitude is comparable to the eclipse depths. In some epochs, the amplitude of this variability exceeds the amplitude of eclipses, which are very shallow and hardly exceed 0.01 in normalized flux units.
Shallow eclipse depths could be result of a possible third light contribution. However, the bestfitting light curve model indicates no third light contribution. The ETV diagram does not show any sign for a possible third body, but only a scatter of ± 5 minutes with some vaguely undulating patterns among this scatter. A remaining possible explanation is that the undulating pattern could be the reflection of the variability observed at out-of-eclipse phases. Considering the spectral types of the components, such irregular patterns in ETV diagrams could be attributed to an intrinsic photometric variability originating from magnetic activity of one or both components. (Balaji et al. 2015). Comparing the ETV diagrams of KIC4832197 and a very active eclipsing binary KIC12418816 (Dal & Özdarcan 2018, see Figure 1 in their study), it is clearly seen that our target system does not exhibit clear patterns, which indicates a much lower level of magnetic activity.
Combining the best-fitting spectroscopic orbit and light curve models, absolute physical properties of the components of the system are computed. Using these parameters, the components are plotted on the log T eff −log L/L ⊙ plane. The positions of the components on this plane suggest an age of 2.8±0.8 Gyr for the system. The primary component of KIC4832197 appears to have burnt almost half of its main sequence fuel.
UBV colours (Everett et al. 2012) of the system enable us to estimate interstellar reddening. Trial plots of the U − B and B − V colours of the system on the UBV colour-colour diagram yields E(B − V ) = 0m . 009. This indicates a distance of 452±40 pc. Considering the reported observational errors of the UBV colours and the small amount of E(B − V ), interstellar reddening can be neglected. In this case, the distance becomes 459±40 pc. Both distance values agree within the computed statistical error. The computed error of the distance is mainly dominated by the estimated 200 K uncertainty of the effective temperatures of the components. The distance of the system based on precise parallax measurement of GAIA (Gaia Collaboration et al. 2016, 2022; Babusiaux et al. 2022) is given as 449±2 pc, which is in good agreement with the computed distance in this study.
Removing the best-fitting light curve model from the long cadence Kepler light curve, a residual light curve is obtained, which shows clear brightness variability at out-of-eclipse phases. The residual light curve exhibits remarkable changes, with a time scale of a few orbital cycles. These changes occur both in amplitude and shape of the light curves. For instance, an asymmetric single-humped light curve can become a double-humped one with a noticeable amplitude change in a few days, and then can return to another asymmetric light curve with a different amplitude. Considering the spectral types of the components the most likely explanation for the source of the out-of-eclipse brightness variability is cool spot activity on one or both components. Such a spot activity is the result of magnetic activity in cool stars and causes emission features to appear in particular activity-sensitive spectral lines throughout the optical spectrum (e.g. Hα, Caii H& K lines). However, no emission features are observed, neither in the Hα nor in the Caii H& K lines in the TFOSC spectra of KIC4832197. Nevertheless, several very weak stellar flares, which can be considered photometric evidence of cool spot activity, are detected in the long cadence Kepler light curve of the system. Such a situation was observed before for the eclipsing binary KIC9451096 (Özdarcan et al. 2018), where no emission was detected in activity-sensitive lines but a significant number of flares were detected in the Kepler light curve. On the other hand, although the amplitude of the rotational modulation signal reaches up to 0.01 in normalized flux units, this is still a low amplitude brightness variability. Thus, observing no emission in activity-sensitive spectral lines may not be unexpected. Actually, a low level of magnetic activity is in agreement with the physical properties of the system. Masses of the components are slightly higher than the solar mass, which means that both of them possess more shallow outer convective envelopes compared to the Sun. Therefore, one may expect a decrease in the level of magnetic activity. Comparing KIC4832197 with KIC12418816 (Dal & Özdarcan 2018), which is a lower mass eclipsing binary with shorter orbital period and high level of magnetic activity, confirms this situation. The components of KIC12418816 possess a deeper convective envelope compared to the components of our target. As a result of the combination of faster rotation and deeper convective envelopes, a high level of magnetic activity in KIC12418816 is not surprising. In the case of KIC4832197, the situation is opposite. Hence, a low level of magnetic activity is not unexpected for KIC4832198.
Frequency analysis of the residual light curve shows two dominant frequency peaks around the orbital frequency (see the amplitude spectrum plotted in Figure 10). However, the lowermost panel of the figure clearly shows that almost no signal appears at the exact location of the orbital frequency. This means that the best-fitting light curve model precisely represents binarity effects. As a result, removing the best-fitting light curve model from the observations perfectly removes the binarity effects from the long cadence light curve. Comparing the frequencies (f 1, f 2 and f orb ) and their statistical error (listed in Table 5), one can notice that the separation of frequencies exceeds the statistical errors. No major splitting is observed for the peaks of f 1 and f 2, except for a remarkable side component of f 1 located at a slightly higher frequency compared to f 1. We interpret these frequencies as the result of two separate spots or spot groups located at different latitudes on the surface of one or both components. Looking at the lowermost panel of the Figure 10, it is quickly seen that the f 1 and f 2 frequencies are smaller and larger than f orb , respectively. Assuming that both components possess solar type differential rotation on their surfaces, a spot (or spot group) causing variability with an f 1 frequency is assumed to be located at lower latitudes, which are expected to rotate faster than at the latitude rotating with f orb . (The latitude that rotates with f orb is often called co-rotation latitude). In this case, the other spot (or spot group), which rotates with an f 2 frequency must be located at higher latitudes compared to the co-rotation latitude. These latitudes are expected to rotate slower than the co-rotation latitude as well. Further inspection of these frequencies reveals that f 1 persistently appears in each separate Kepler quarter while f 2 weakens or disappears occasionally. In this case, the spot (or spot group) related to f 1 is more persistent and exhibits stronger activity compared to the spot or spot group related to f 2. Four years of persistence of the f 1 frequency is not surprising in the context of solar and stellar activity since similar persistent active longitudes were reported previously for our Sun (Berdyugina & Usoskin 2003).
With the current data, it is difficult to distinguish which component possesses a spot(s) on its surface. However, we may make an implicit assumption by considering two mechanisms, depth of the outer convective envelope and rotation, which trigger the magnetic activity on cool stars. Although the system is composed of two similar stars, the secondary component is 500 K cooler than the primary. This means that the secondary star possesses a deeper convective envelope. Considering that the axial rotation periods of the components are synchronized with the orbital period, this finding indicates that the secondary component may exhibit stronger magnetic activity, because of its deeper convective outer envelope. Then, we may assume that the spots occur in the cool secondary component.
Assuming that both f
1 and f
2 come from spot or spot groups on the cool secondary component, a lower limit for the differential rotation can be set. Following the procedure described in Hall & Busby (1990), we compute the corresponding period for f
1 and f
2, and adopt them as minimum (P
min
) and maximum (P
max
) periods. Assuming a solar type differential rotation, P
min
can be adopted as the equatorial rotation period. Then, the relative surface shear can be computed via P
max
−P
min
/P
min
= kf, where k is the differential rotation coefficient and f is a constant depending on the range of spot forming latitudes. Assuming that f varies between 0.5 and 0.7, which corresponds to 45 degrees of latitude range for spot forming, k varies between 0.14 and 0.10, which indicates an average
Increasing the number of precisely analysed solar type eclipsing binaries will provide a global look of the photometric properties of magnetic activity eclipsing binaries, and on the influence on light curves of differential rotation, which is one of the two key mechanisms responsible for magnetic activity in cool stars. Continuous photometric data provided by space telescopes is key to achieve this purpose.


 nueva página del texto (beta)


