


 nueva página del texto (beta)
 Inglés (pdf)
 Artículo en XML
 Referencias del artículo
 Enviar artículo por email
 Citado por SciELO
  Similares en
SciELO
Similares en
SciELO 
 Permalink
1. INTRODUCTION
In 1990, after a proposal made by Mahbub ul Haq and the not-yet Economics Nobel Prize winner Amartya Sen, the United Nations Development Programme (UNDP) introduced the Human Development Index (HDI) [UNDP, 1990]. The purpose of the index was to measure the development of a country based not only on its standard of living, but also on two other dimensions of human progress, health and education, since the indicator was meant to emphasize ends over means (Sen, 1985; 1987). Soon after its introduction, the HDI became the most widely cited measure of human development around the world. Since then, it is used to rank countries into four tiers: Very high, high, medium, and low human development. This classification allows countries to compare themselves with their peers, according to the different levels of development. Furthermore, that ranking is used for the allocation of foreign aid and even for international pricing purposes.
As reviewed by Klugman, Rodríguez, and Choi (2011), and Tan (2022), the HDI has received numerous criticisms through the decades1. Nevertheless, by defending the importance of keeping the index as simple as possible, UNDP has made relatively few changes to it over the years. The health indicator, I H as will be denoted here, has always been assessed by a country’s life expectancy at birth, and the only modifications that have been made over time are the minimum and maximum years used to standardize the index. On the other hand, both the indicators of income and education, I I and I E respectively, did experience several modifications over the years.
At the beginning, UNDP (1990) calculated the income index by simply using the logarithm (base ten) of each country’s real Gross Domestic Product (GDP), expressed in dollar terms per capita. That log function was used to reflect the diminishing importance of a country’s domestic product as it increases. A year later, however, UNDP (1991) replaced that income transformation with a more intricated formula but, after several critiques2, that functional form was replaced in 1999 with a natural logarithm transformation (UNDP, 1999). That function has been kept since then, although the argument of the function was later substituted (UNDP, 2010) with Gross National Income (GNI) per capita in Purchasing Power Parity terms (PPP). The main reason for that change was to account for the foreign transfers received by developing countries, as well as for their local cost of living.
The last component of the HDI, the education index, is the one that has changed the most. UNDP (1990) first estimated it using the countries’ adult literacy rate as a single variable. A year later, the mean years of school enrollment was added as a second factor, and UNDP (1991) estimated the corresponding index by averaging the first and second elements using a weight of two-thirds for the former and one-third for the latter. The most significant change came, however, two decades later. UNDP (2010) replaced those two variables with the mean years of schooling received by adults aged 25 and older, from now on denoted by M, and the expected years of education for children entering school, denoted by S. The average years of schooling was thought to be not only a good measure of a country’s stock of human capital, but also a variable that could discriminate better among countries. On the other hand, as we will see later, the rationale given for the use of the expected years of education for children was far more tenuous.
That same year, UNDP (2010) made another important modification in the HDI methodology. It discontinued the use of the arithmetic mean to aggregate the three human dimension indices. Instead, the composite index is now calculated using the geometric mean: HDI = (I H I E I I )1/3. The new procedure was chosen to decrease the level of substitutability among those three dimensions. Thus, a poor achievement in one dimension is not linearly compensated anymore by a higher achievement in another dimension. Rather, the geometric mean implies that a one percent decline in a component must be compensated with a one percent increase in another. Also, the geometric mean is less affected by extreme values in skewed distributions than the arithmetic mean.
But, oddly enough, in the case of the indicator for education, UNDP (2014) decided to discard the geometric mean and use instead the arithmetic mean. Since then, that indicator is simply estimated as I E = (m + s)/2 where, as described later, m and s are the normalizations of M and S. The reason given by UNDP for that unexpected change was the following:
Using the arithmetic mean of the two education indices allows perfect substitutability between expected years of schooling and mean years of schooling, which seems to be right given that many developing countries have low school attainment among adults but are very eager to achieve universal primary and secondary school enrollment among school-age children (UNDP, 2020b, p. 2).
However, as we show in this paper, the estimate for expected years of schooling is persistently overstated by some of the countries, taking advantage of the fact that there is no official methodology that must be followed to make that estimation. Consequently, in the case of some countries the eagerness to improve schooling rates for children does not necessarily translate into educational achievement. This unfortunate fact threatens the reliability of the index for education.
In this light, the main purpose of this paper is to suggest an adjustment to the estimation procedure that is used to calculate the indicator for education. We present a simple methodological change that rejects the perfect substitutability between actual and expected years of education, but still accounts for the efforts of developing countries to universalize primary and secondary schooling. As such, it continues to value both the past education of adults and the future education of children. This is accomplished by adopting a weighted geometric mean in which the weights are dynamic, changing from one year to the other, to reflect the extent to which the expected years of schooling forecasted for that country are materialized in the actual years of schooling.
The remainder of the paper is structured as follows. In the second section, we review the current methodology that is used to estimate the HDI. It is shown that there is a significant difference between the actual mean years of schooling received by adults, as registered at a particular time, and the number of years of education that a child of school entrance age is expected to receive. It is also noted that such an overestimation tends to be higher, in relative terms, among low-income countries. In the third section, we then describe how to estimate the indicator for education using a weighted geometric mean of the two educational components. The weights are calculated using the mean forecasting error found when contrasting the expected years of schooling, as stated by a country at a particular time, with the actual average years registered two decades later. The comparisons are made using all the 20-year windows for which there is data available. The estimations thus obtained are given for each of the countries considered in the 2020 HDI ranking. The final section discusses the results and proposes an improvement to the index.
2. THE HDI AND THE SCHOOL-LIFE EXPECTANCY ISSUE
We first review the procedure that is currently followed to estimate the HDI. Table 1 presents the HDI and its components for the highest-ranking country, Norway, and the lowest-ranking country, Niger, among the 189 countries considered by UNDP (2020a). The table also includes, for reasons to be given shortly, the HDI and its components for three other
Table 1 Components of the HDI for selected countries, 2020
| HDI rank | HDI | Life expectancy at birth (years) | Expected years of schooling (A) | Mean of years of schooling (B) | GNI per capita (2017 PPP $) | A/B |
|---|---|---|---|---|---|---|
| 1 Norway | 0.957 | 82.4 | 18.07 | 12.90 | 66,494 | 1.40 |
| 8 Australia | 0.944 | 83.4 | 21.95 | 12.72 | 48,085 | 1.73 |
| 90 Moldova | 0.750 | 71.9 | 11.53 | 11.71 | 13,664 | 0.99 |
| 182 Burkina Faso | 0.452 | 61.6 | 9.27 | 1.64 | 2,133 | 5.64 |
| 189 Niger | 0.394 | 62.4 | 6.47 | 2.08 | 1,201 | 3.11 |
Countries: Australia, Burkina Faso, and the Republic of Moldova.
Source: UNDP (2020a).
The case of Norway can be used as an example of how the index is calculated. According to the current methodology established by UNDP, the life expectancy at birth in each country must be normalized using 85 and 20 as upper and lower bounds, so that the Norwegian health index is:
On the other hand, the bounds for gross national income per capita (expressed in 2017 PPP dollars), are $75,000 and $100. Since the relevant variable is the natural logarithm of GNI per capita, then the Norwegian income index can be found to be:
Finally, the upper and lower bounds for the expected years of schooling are 18 and 0, while for the mean years of schooling are 15 and 0. In the case of Norway, the two gross values 18.07 and 12.90 can be normalized to obtain, respectively, 1 (since 18.07 > 18) and 12.9/15 = 0.86. Thus, the Norwegian education index is:
Using the values of the three indicators just found, Norway’s HDI can be then estimated calculating the geometric mean:
As shown in Table 1, that HDI for Norway, the highest-ranking country, distinguishes sharply from the Nigerien HDI. The other three countries in the table are not included to make further comparisons, however, but rather to contrast their own expected and mean years of schooling (columns A and B). The most striking instance corresponds to Burkina Faso, which presents the largest ratio of expected to actual years of schooling among the 189 countries. Its mean of years of schooling is currently 1.64, but the school-life expectancy for new entrants is 9.27 years. The opposite situation corresponds to the Republic of Moldova: It is the only country in the entire sample for which the current mean of years of schooling exceeds the expected value in 2020. Lastly, in the case of Australia, the school-life expectancy is 21.95 years, even though the current mean of schooling is 12.72, a difference of more than nine years. More strikingly, in the past ten years, Australia has stated a school-life expectancy always above 20 years, while its annual mean of years of schooling has never reached 13 years (UNDP, 2022).
Those three countries are the most conspicuous outliers in the case of expectations of schooling, but they are not alone: 100 out of the 189 countries ranked in the HDI present a ratio of expected to actual years of schooling equal to or above 1.5. Furthermore, as illustrated by the two histograms given in Figure 1, the samples for the actual mean years of schooling and the expected years of education show significant differences. The sample means are, respectively, 8.73 and 13.32. But that substantial difference in the means is not, however, the most distinctive feature of the two histograms. Their shapes are also quite contrasting. In the case of the actual mean years of schooling received by adults, the histogram is left-skewed, reflecting the higher education levels in the case of high and middle-income countries. On the other hand, the histogram for the expected years of schooling is bell-shaped. Indeed, one could handily reject the null hypothesis of a normal distribution in the first case, but certainly not in the second3. That striking bell-shaped feature might simply reflect, from the part of some of the countries, a decision of not disclosing their own expectations, but rather to declare values that are somewhat in conformity to the ones given by other countries in the past.
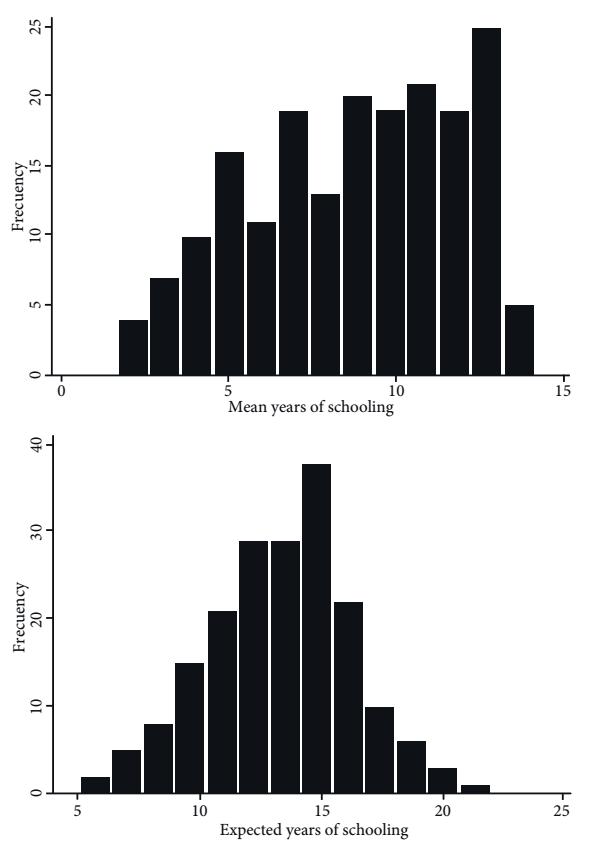
Source: Elaborated using data from UNDP (2020a).
Figure 1 Histograms of mean and expected years of schooling across countries, 2020
To that possible reason we can add the fact that expected years of schooling is a complicated indicator to estimate in the first place. Although the United Nations Educational Scientific and Cultural Organization (UNESCO) Institute for Statistics establishes in detail the methodology to calculate it (UNESCO, 2013), the task is far from trivial. The indicator should reflect the number of years a child of school entrance age is expected to spend at primary, secondary, and tertiary schools. Thus, the estimation must consider a good number of variables simultaneously, such as the future patterns of age-specific enrolment rates, the number of years that a child could spend on repetition, and the likelihood that a child could pursue different academic degrees. Those limitations of the index have been noted by several authors, such as Barakat (2012), and Barakat, Durham, and Guimarães (2013). Also, UNESCO (2013) recommends caution in its use, particularly when making cross-country comparisons.
It is important to stress that, notwithstanding the overestimation over the years that some countries could make of the expected years of education for their children, and the statistical difficulties that all countries must face when estimating that variable, we believe that its inclusion as a component of the HDI is eminently correct. By doing so, UNDP publicly recognizes the efforts of the developing countries that attempt to achieve universal primary and secondary school enrollments. However, we also believe that the assumption of perfect years of schooling for children is untenable. The next section offers an alternative method that decreases the level of substitutability between those two variables, and, even more importantly, recognizes the effort made by the countries whose expectations turn out to be more accurate with respect to the rest.
3. AN ADJUSTMENT TO THE HDI
To examine whether the indicator of the expected years of schooling is, on its face value, consistent with schooling achievement over time, an extensive set of historical data is required. UNDP (2022) provides a data center with the information needed to reproduce the HDI for all countries, from 1990 to 2019 (which is used for the 2020 ranking). Even though the average and the expected years of schooling were considered components of the indicator for education only until 2010, UNDP also provides the prior information based on UNESCO (2022).
As a first step to introduce an alternative to the HDI, for each country we split in eleven 20-year windows the dataset corresponding to the two components of education: 1990-2009, 1991-2010, …, 2000-2019. That particular 20-year cutoff is justified considering that a six-year-old child entering school in 1990, say, would be part of the group that was used to calculate the average years of education received by adults aged 25 and older in the year 2009, and the same would apply to the subsequent periods. However, it is quite important to remember in what follows that the value of M registered in 2009 did not correspond just to the average years of education that the children that entered school in 1990 ended up receiving, but rather to the average years of schooling received by all adults aged 25 or older as registered in 2009. Unfortunately, there is no data available for the average years of education received by each cohort in most countries. Thus, when UNDP treats M and S as perfect substitutes, it implicitly ignores, as we will do here, that accounting fact.
The second step in the new procedure is to compare, for each of the 189 countries considered in the 2020 HDI ranking, the expectation of years of schooling with the actual average that that was registered twenty years later. This comparison is made year after year to calculate the following mean forecasting “error”:
Where, as defined earlier, M represents the actual average years of schooling and S indicates the expected number of years. We use quotes in the word “error” because, as it has been clarified, S should not be considered to be, properly speaking, a forecast for M.
To illustrate the use of the equation above, consider the case of Afghanistan, which, following the alphabetic order, is the first in the list of countries considered in the 2020 HDI. In 1990 the estimated years of education for children entering school was 2.6, but the average years of schooling received by adults two decades later, in 2009, turned out to be 3.1. Thus, Afghanistan was more than right, since there was an underestimation of the average years of schooling two decades later in the order of 16.1%, given that (3.1 - 2.6)/3.1 = 0.161. Good forecasts were also made in the case of the next two windows, 1991-2010 and 1992-2011, but in the other eight subsequent cases the country increasingly overestimated the years of education for children. In 2000, for instance, the estimated value was 5.9, while in 2019 the actual average happened to be 3.9. Thus, the percentual error ended up being of the order of 50%: (3.9 - 5.9)/3.9 = -0.513. Consequently, it should not come as a surprise that the mean forecasting error, w, turned out to be around -18.3% for the case of Afghanistan4.
For Albania, the next country in the list, the mean forecasting error w was -7.9%. The reason being that, in each of the eleven periods, this country overestimated the years of schooling for children, although in all instances only by small percentages. On the other hand, and remarkable enough, Angola, the fifth country in the list, had a mean forecasting error (or, better said, success) of the order of 20.5%. Out of the 189 countries considered in the sample, only Angola and Djibouti underestimated consistently, during the eleven periods, the years of schooling that their children would end up having two decades later5.
Turning to the interpretation of the last equation once again, it should be noted that there are some countries for which there are less than the eleven 20-year windows of data that are common for the rest of countries. In those cases, the mean percentual errors must be estimated using only the available data and, of course, the average should change accordingly. A limit situation arises when a country did not register the expected years of education for children in the year 2000 or earlier. Antigua and Barbuda, Marshall Islands, Montenegro, and South Sudan fall in that category. In that case the mean error should be set equal to zero, as they were unable to state their own expectations.
We are now ready to define an adjusted indicator for education, AI E , for each country. The mean percentual error w is used as a component of the exponents that define the following weighted geometric mean:
Where, after the due normalizations, m is the country’s mean of years of schooling and s is the country’s expected years for children that are entering school. Note that a bona fide weighted geometric mean requires that the weights in this new equation not only should add to one, as is the case, but also that they should vary only from 0 to 1. This implies in turn that that w can only take values from -1 to 1. But the range of w must be restricted further, since the variable corresponding to the mere expectations (s) should not have a larger weight than the one that represents actual data (m); thus 0.5(1 + w) ≤ 0.5, and hence w must be less than or equal to zero.
As will be exemplified, most countries happen to have a mean forecasting error that fulfills the condition -1 ≤ w ≤ 0. However, there are a few, like Angola and Djibouti, that have such a good forecasting record that w is greater than 0. In that case, we set w = 0 and the adjusted indicator for education simply becomes the geometric mean of both variables. On the other hand, in the case of countries with a dismal forecasting record such that w < -1 (a yearly average error of more than 100%), we set w = -1 and the adjusted indicator simply becomes m, the actual average of years of education after normalization.
The key feature of the new methodology is that it internalizes in the HDI’s calculation the countries’ degree of achievement of the expected years of schooling. The higher the level of materialization, the higher the weight the formula puts on expected years of schooling. On the other hand, when a country persistently fails to implement its prediction, such that the expected years turn out to be an overestimation of actual years of education two decades later, this distortion is corrected by reducing the weight on expected years of schooling and reallocating that weight on the actual years of schooling.
Once AI E is estimated, the new adjusted HDI (AHDI) can be finally calculated using the (unweighted) geometric mean of the three indicators: AHDI = (I H AI E I I )1/3. As an example of how to compute the new index, we consider once again the case of Afghanistan. For that country the 2020 HDI equals 0.511, which is the geometric mean of I H = 0.689, I E = 0.414 and I I = 0.469. We now calculate AI E . Since in 2019 the data for Afghanistan’s education variables were M = 3.93 and S = 10.18, then, after dividing those values by 15 and 18, we obtain m = 0.262 and s = 0.565. On the other hand, as noted earlier, w = -0.183 in the case of that country. Plugging the last three values in the new equation, we can now find that AI E = 0.359. Consequently, Afghanistan’s adjusted HDI is AHDI = (0689 × 0.359 × 0.469)1/3 = 0.488.
The numerical procedure just presented is replicated in Table 2 for the other 188 countries considered by UNDP (2020a). Instead of the official HDI, our proposed AHDI is now used to rank all countries. The column named “Change” in that table displays the difference between the new rank and the original position in the 2020 HDI. The table also shows for each country the mean forecasting error, w, and the two alternative indicators for education: The weighted geometric mean AI E and the arithmetic mean I E .
Table 2 Adjusted HDI, 2020
| Country | AHDI | HDI | Change | w | AIE | IE | |
|---|---|---|---|---|---|---|---|
| Very high human development | |||||||
| 1 | Switzerland | 0.955 | 0.955 | 1 | -0.085 | 0.899 | 0.900 |
| 2 | Ireland | 0.950 | 0.955 | 0 | -0.137 | 0.908 | 0.922 |
| 3 | Norway | 0.950 | 0.957 | -1 | -0.237 | 0.911 | 0.930 |
| 4 | Germany | 0.947 | 0.947 | 2 | -0.112 | 0.943 | 0.943 |
| 5 | Hong Kong | 0.945 | 0.949 | -1 | -0.136 | 0.869 | 0.880 |
| 6 | Iceland | 0.939 | 0.949 | -2 | -0.348 | 0.897 | 0.926 |
| 7 | Singapore | 0.937 | 0.938 | 4 | -0.031 | 0.839 | 0.844 |
| 8 | Sweden | 0.936 | 0.945 | -1 | -0.288 | 0.891 | 0.918 |
| 9 | Denmark | 0.933 | 0.940 | 1 | -0.196 | 0.902 | 0.920 |
| 10 | Netherlands | 0.933 | 0.944 | -1 | -0.321 | 0.883 | 0.914 |
| 11 | Australia | 0.930 | 0.944 | -3 | -0.490 | 0.885 | 0.924 |
| 12 | Finland | 0.930 | 0.938 | 0 | -0.279 | 0.905 | 0.927 |
| 13 | United Kingdom | 0.930 | 0.932 | 2 | -0.152 | 0.920 | 0.927 |
| 14 | Canada | 0.929 | 0.929 | 2 | -0.276 | 0.893 | 0.894 |
| 15 | United States | 0.926 | 0.926 | 2 | -0.179 | 0.899 | 0.900 |
| 16 | New Zealand | 0.921 | 0.931 | -2 | -0.330 | 0.899 | 0.926 |
| 17 | Austria | 0.920 | 0.922 | 1 | -0.211 | 0.859 | 0.865 |
| 18 | Japan | 0.919 | 0.919 | 1 | -0.138 | 0.852 | 0.851 |
| 19 | Liechtenstein | 0.919 | 0.919 | 1 | -0.080 | 0.832 | 0.832 |
| 20 | Israel | 0.918 | 0.919 | -1 | -0.079 | 0.882 | 0.883 |
| 21 | Luxembourg | 0.916 | 0.916 | 2 | -0.011 | 0.806 | 0.806 |
| 22 | Belgium | 0.915 | 0.931 | -8 | -0.440 | 0.854 | 0.902 |
| 23 | Slovenia | 0.914 | 0.917 | -1 | -0.068 | 0.903 | 0.910 |
| 24 | Korea (Republic of) | 0.912 | 0.916 | -1 | -0.218 | 0.853 | 0.865 |
| 25 | Czechia | 0.895 | 0.900 | 2 | 0.000 | 0.890 | 0.890 |
| 26 | France | 0.894 | 0.901 | 0 | -0.354 | 0.797 | 0.817 |
| 27 | Estonia | 0.892 | 0.892 | 2 | -0.048 | 0.882 | 0.882 |
| 28 | United Arab Emirates | 0.890 | 0.890 | 3 | 0.005 a/ | 0.802 | 0.802 |
| 29 | Malta | 0.888 | 0.895 | -1 | -0.228 | 0.806 | 0.825 |
| 30 | Cyprus | 0.887 | 0.887 | 3 | 0.023a/ | 0.827 | 0.827 |
| 31 | Lithuania | 0.882 | 0.882 | 3 | -0.032 | 0.897 | 0.898 |
| 32 | Poland | 0.879 | 0.880 | 3 | -0.092 | 0.864 | 0.869 |
| 33 | Italy | 0.874 | 0.892 | -4 | -0.394 | 0.748 | 0.793 |
| 34 | Greece | 0.871 | 0.888 | -2 | -0.251 | 0.801 | 0.849 |
| 35 | Spain | 0.870 | 0.904 | -10 | -0.544 | 0.742 | 0.831 |
| 36 | Andorra | 0.868 | 0.868 | 0 | -0.031 | 0.719 | 0.720 |
| 37 | Latvia | 0.866 | 0.866 | 0 | 0.017a/ | 0.883 | 0.883 |
| 38 | Slovakia | 0.860 | 0.860 | 1 | 0.005a/ | 0.825 | 0.826 |
| 39 | Hungary | 0.854 | 0.854 | 1 | -0.058 | 0.819 | 0.821 |
| 40 | Croatia | 0.850 | 0.851 | 3 | -0.057 | 0.801 | 0.805 |
| 41 | Qatar | 0.847 | 0.848 | 4 | -0.331 | 0.655 | 0.659 |
| 42 | Saudi Arabia | 0.844 | 0.854 | -2 | -0.192 | 0.761 | 0.789 |
| 43 | Chile | 0.839 | 0.851 | 0 | -0.268 | 0.776 | 0.810 |
| 44 | Argentina | 0.829 | 0.845 | 2 | -0.311 | 0.808 | 0.855 |
| 45 | Montenegro | 0.829 | 0.829 | 4 | 0.000 c/ | 0.802 | 0.803 |
| 46 | Romania | 0.827 | 0.828 | 3 | -0.005 | 0.765 | 0.765 |
| 47 | Palau | 0.825 | 0.826 | 3 | -0.096 | 0.853 | 0.855 |
| 48 | Bahrain | 0.824 | 0.852 | -6 | -0.493 | 0.694 | 0.769 |
| 49 | Kazakhstan | 0.824 | 0.825 | 3 | -0.044 | 0.828 | 0.830 |
| 50 | Russian Federation | 0.824 | 0.824 | 4 | -0.035 | 0.823 | 0.823 |
| 51 | Belarus | 0.823 | 0.823 | 2 | -0.051 | 0.837 | 0.838 |
| 52 | Portugal | 0.823 | 0.864 | -13 | -0.649 | 0.662 | 0.768 |
| 53 | Brunei Darussalam | 0.820 | 0.838 | -6 | -0.426 | 0.658 | 0.702 |
| 54 | Bulgaria | 0.815 | 0.816 | 2 | -0.111 | 0.776 | 0.779 |
| 55 | Bahamas | 0.814 | 0.814 | 3 | -0.048 | 0.740 | 0.740 |
| 56 | Panama | 0.814 | 0.815 | 2 | -0.156 | 0.697 | 0.700 |
| 57 | Georgia | 0.812 | 0.812 | 4 | 0.081a/ | 0.862 | 0.862 |
| 58 | Oman | 0.810 | 0.813 | 2 | -0.056 | 0.711 | 0.718 |
| 59 | Malaysia | 0.809 | 0.810 | 3 | -0.052 | 0.723 | 0.726 |
| 60 | Barbados | 0.805 | 0.814 | -2 | -0.307 | 0.757 | 0.782 |
| 61 | Serbia | 0.804 | 0.806 | 3 | -0.184 | 0.775 | 0.783 |
| High human development | |||||||
| 62 | Trinidad and Tobago | 0.796 | 0.796 | 5 | -0.033 | 0.728 | 0.728 |
| 63 | Mauritius | 0.792 | 0.804 | 3 | -0.268 | 0.703 | 0.736 |
| 64 | Albania | 0.792 | 0.795 | 6 | -0.079 | 0.738 | 0.746 |
| 65 | Costa Rica | 0.790 | 0.810 | -3 | -0.268 | 0.675 | 0.726 |
| 65 | Seychelles | 0.790 | 0.796 | 2 | -0.239 | 0.709 | 0.726 |
| 67 | Turkey | 0.788 | 0.820 | -13 | -0.316 | 0.649 | 0.731 |
| 68 | Cuba | 0.783 | 0.783 | 2 | -0.336 | 0.788 | 0.790 |
| 69 | Sri Lanka | 0.781 | 0.782 | 3 | -0.103 | 0.742 | 0.746 |
| 70 | Iran | 0.780 | 0.783 | 0 | -0.108 | 0.746 | 0.756 |
| 71 | Uruguay | 0.778 | 0.817 | -16 | -0.547 | 0.659 | 0.765 |
| 72 | Antigua and Barbuda | 0.777 | 0.778 | 6 | 0.000c/ | 0.663 | 0.665 |
| 73 | Ukraine | 0.777 | 0.779 | 2 | -0.098 | 0.794 | 0.799 |
| 74 | Armenia | 0.776 | 0.776 | 7 | 0.048a/ | 0.740 | 0.740 |
| 75 | Bosnia and Herzegovina | 0.775 | 0.780 | -2 | -0.184 | 0.698 | 0.711 |
| 76 | North Macedonia | 0.770 | 0.774 | 6 | -0.168 | 0.694 | 0.704 |
| 77 | Mexico | 0.763 | 0.779 | -3 | -0.274 | 0.661 | 0.703 |
| 78 | Peru | 0.763 | 0.777 | 2 | -0.354 | 0.702 | 0.740 |
| 79 | Kuwait | 0.760 | 0.806 | -15 | -0.605 | 0.534 | 0.638 |
| 80 | Azerbaijan | 0.756 | 0.756 | 8 | 0.030a/ | 0.711 | 0.711 |
| 81 | Saint Kitts and Nevis | 0.756 | 0.779 | -6 | -0.571 | 0.614 | 0.673 |
| 82 | Thailand | 0.755 | 0.777 | -3 | -0.275 | 0.624 | 0.682 |
| 83 | Colombia | 0.750 | 0.767 | 0 | -0.294 | 0.638 | 0.682 |
| 84 | Moldova | 0.749 | 0.750 | 6 | 0.012a/ | 0.707 | 0.711 |
| 85 | China | 0.748 | 0.761 | 0 | -0.196 | 0.623 | 0.657 |
| 86 | Grenada | 0.741 | 0.779 | -12 | -0.570 | 0.662 | 0.770 |
| 87 | Fiji | 0.740 | 0.743 | 6 | -0.233 | 0.755 | 0.764 |
| 88 | Ecuador | 0.739 | 0.759 | -2 | -0.443 | 0.648 | 0.702 |
| 89 | Lebanon | 0.739 | 0.744 | 4 | -0.554 | 0.591 | 0.604 |
| 90 | Mongolia | 0.736 | 0.737 | 9 | 0.127a/ | 0.734 | 0.736 |
| 91 | Saint Lucia | 0.734 | 0.759 | -5 | -0.554 | 0.609 | 0.672 |
| 92 | Botswana | 0.732 | 0.735 | 8 | -0.180 | 0.668 | 0.676 |
| 93 | Jamaica | 0.731 | 0.734 | 8 | -0.214 | 0.680 | 0.689 |
| 94 | Jordan | 0.731 | 0.729 | 9 | -0.200 | 0.673 | 0.667 |
| 95 | Suriname | 0.731 | 0.738 | 4 | -0.320 | 0.654 | 0.675 |
| 96 | Algeria | 0.727 | 0.748 | -5 | -0.315 | 0.615 | 0.672 |
| 97 | Dominican Republic | 0.726 | 0.756 | -9 | -0.551 | 0.590 | 0.666 |
| 98 | Tonga | 0.723 | 0.725 | 6 | -0.242 | 0.768 | 0.775 |
| 99 | Dominica | 0.723 | 0.742 | -4 | -0.479 | 0.584 | 0.632 |
| 100 | Paraguay | 0.720 | 0.728 | 3 | -0.249 | 0.617 | 0.638 |
| 101 | Saint Vincent | 0.720 | 0.738 | -3 | -0.461 | 0.633 | 0.684 |
| 102 | Uzbekistan | 0.720 | 0.720 | 6 | 0.039a/ | 0.726 | 0.729 |
| 103 | Samoa | 0.716 | 0.715 | 8 | -0.132 | 0.714 | 0.713 |
| 104 | Turkmenistan | 0.715 | 0.715 | 7 | 0.010a/ | 0.653 | 0.653 |
| 105 | Philippines | 0.714 | 0.718 | 2 | -0.196 | 0.666 | 0.678 |
| 106 | Belize | 0.713 | 0.716 | 4 | -0.197 | 0.688 | 0.695 |
| 107 | Maldives | 0.713 | 0.740 | -12 | -0.513 | 0.512 | 0.573 |
| 108 | Brazil | 0.712 | 0.765 | -24 | -0.782 | 0.560 | 0.694 |
| 109 | Venezuela | 0.711 | 0.711 | 4 | -0.088 | 0.698 | 0.700 |
| 110 | South Africa | 0.705 | 0.709 | 4 | -0.259 | 0.713 | 0.724 |
| 111 | Marshall Islands | 0.704 | 0.704 | 6 | 0.000c/ | 0.707 | 0.707 |
| 112 | Indonesia | 0.703 | 0.718 | -5 | -0.310 | 0.610 | 0.650 |
| 113 | Palestine, State of | 0.702 | 0.708 | 2 | -0.176 | 0.663 | 0.678 |
| 114 | Bolivia | 0.701 | 0.718 | -7 | -0.447 | 0.648 | 0.695 |
| Medium human development | |||||||
| 115 | Kyrgyzstan | 0.698 | 0.697 | 5 | -0.045 | 0.731 | 0.730 |
| 116 | Viet Nam | 0.698 | 0.704 | 2 | -0.156 | 0.614 | 0.630 |
| 117 | Gabon | 0.688 | 0.703 | 2 | -0.506 | 0.612 | 0.650 |
| 118 | Tunisia | 0.686 | 0.740 | -23 | -0.671 | 0.527 | 0.661 |
| 119 | Egypt | 0.680 | 0.707 | -3 | -0.492 | 0.549 | 0.618 |
| 120 | Libya | 0.680 | 0.724 | -14 | -1.014 b/ | 0.507 | 0.610 |
| 121 | Guyana | 0.678 | 0.682 | 1 | -0.264 | 0.590 | 0.601 |
| 122 | Tajikistan | 0.667 | 0.668 | 3 | 0.007a/ | 0.681 | 0.682 |
| 123 | Iraq | 0.663 | 0.674 | 0 | -0.346 | 0.529 | 0.557 |
| 124 | Guatemala | 0.649 | 0.663 | 3 | -0.337 | 0.488 | 0.519 |
| 125 | El Salvador | 0.648 | 0.673 | -1 | -0.555 | 0.497 | 0.555 |
| 126 | Nicaragua | 0.639 | 0.660 | 2 | -0.397 | 0.519 | 0.573 |
| 127 | Morocco | 0.635 | 0.686 | -6 | -0.479 | 0.452 | 0.569 |
| 128 | India | 0.623 | 0.645 | 3 | -0.364 | 0.499 | 0.555 |
| 129 | Kiribati | 0.622 | 0.630 | 5 | -0.352 | 0.569 | 0.594 |
| 130 | Bangladesh | 0.620 | 0.632 | 3 | -0.157 | 0.499 | 0.529 |
| 131 | Honduras | 0.619 | 0.634 | 1 | -0.524 | 0.464 | 0.499 |
| 132 | Cabo Verde | 0.612 | 0.665 | -6 | -0.824 | 0.439 | 0.562 |
| 133 | Micronesia | 0.612 | 0.620 | 4 | -0.295 | 0.560 | 0.581 |
| 134 | Namibia | 0.608 | 0.646 | -4 | -0.777 | 0.488 | 0.584 |
| 135 | Ghana | 0.606 | 0.611 | 3 | -0.109 | 0.549 | 0.563 |
| 136 | Vanuatu | 0.593 | 0.609 | 4 | -0.417 | 0.518 | 0.561 |
| 137 | Eswatini | 0.589 | 0.611 | 1 | -0.512 | 0.500 | 0.557 |
| 138 | Sao Tome and Principe | 0.588 | 0.625 | -3 | -0.608 | 0.473 | 0.567 |
| 139 | Kenya | 0.584 | 0.601 | 4 | -0.378 | 0.490 | 0.534 |
| 140 | Lao | 0.581 | 0.613 | -3 | -0.456 | 0.409 | 0.481 |
| 141 | Equatorial Guinea | 0.579 | 0.592 | 4 | -0.356 | 0.436 | 0.467 |
| 142 | Zambia | 0.575 | 0.584 | 4 | -0.261 | 0.531 | 0.557 |
| 143 | Angola | 0.572 | 0.581 | 5 | 0.205a/ | 0.475 | 0.500 |
| 144 | Zimbabwe | 0.569 | 0.571 | 6 | -0.240 | 0.581 | 0.587 |
| 145 | Pakistan | 0.555 | 0.557 | 9 | -0.011 | 0.397 | 0.402 |
| 146 | Solomon Islands | 0.552 | 0.567 | 5 | -0.287 | 0.439 | 0.474 |
| 147 | Cambodia | 0.550 | 0.594 | -3 | -0.548 | 0.384 | 0.484 |
| Low human development | |||||||
| 148 | Congo | 0.546 | 0.574 | 1 | -0.095 | 0.466 | 0.543 |
| 149 | Cameroon | 0.545 | 0.563 | 4 | -0.292 | 0.497 | 0.547 |
| 150 | Myanmar | 0.545 | 0.583 | -2 | -0.574 | 0.379 | 0.464 |
| 151 | Syrian Arab Republic | 0.538 | 0.567 | 0 | -0.764 | 0.355 | 0.416 |
| 152 | Bhutan | 0.535 | 0.654 | -23 | -1.080b/ | 0.272 | 0.496 |
| 153 | Nigeria | 0.534 | 0.539 | 8 | -0.214 | 0.484 | 0.499 |
| 154 | Papua New Guinea | 0.534 | 0.555 | 2 | -0.229 | 0.392 | 0.439 |
| 155 | Côte d’Ivoire | 0.533 | 0.538 | 7 | -0.017 | 0.440 | 0.453 |
| 156 | Mauritania | 0.533 | 0.546 | 2 | -0.245 | 0.369 | 0.396 |
| 157 | Uganda | 0.531 | 0.544 | 2 | -0.225 | 0.487 | 0.523 |
| 158 | Tanzania | 0.528 | 0.529 | 5 | -0.001 | 0.428 | 0.429 |
| 159 | Djibouti | 0.522 | 0.524 | 7 | 0.309a/ | 0.321 | 0.325 |
| 160 | Madagascar | 0.520 | 0.528 | 4 | -0.199 | 0.464 | 0.486 |
| 161 | Nepal | 0.520 | 0.602 | -18 | -0.985 | 0.336 | 0.521 |
| 162 | Timor-Leste | 0.519 | 0.606 | -21 | -1.042b/ | 0.320 | 0.510 |
| 163 | Comoros | 0.506 | 0.554 | -7 | -0.752 | 0.365 | 0.482 |
| 164 | Lesotho | 0.505 | 0.527 | 1 | -0.606 | 0.469 | 0.532 |
| 165 | Rwanda | 0.494 | 0.543 | -5 | -0.580 | 0.345 | 0.458 |
| 166 | Haiti | 0.492 | 0.510 | 4 | -0.468 | 0.411 | 0.456 |
| 167 | Afghanistan | 0.488 | 0.511 | 2 | -0.183 | 0.359 | 0.414 |
| 168 | Sudan | 0.486 | 0.510 | 3 | -0.380 | 0.299 | 0.345 |
| 169 | Congo | 0.478 | 0.480 | 6 | -0.649 | 0.489 | 0.496 |
| 170 | Eritrea | 0.458 | 0.459 | 10 | -0.026 | 0.269 | 0.269 |
| 171 | Benin | 0.456 | 0.545 | -13 | -0.811 | 0.281 | 0.478 |
| 172 | Ethiopia | 0.455 | 0.485 | 1 | -0.185 | 0.281 | 0.341 |
| 173 | Togo | 0.454 | 0.515 | -6 | -0.819 | 0.353 | 0.517 |
| 174 | Senegal | 0.450 | 0.512 | -6 | -0.759 | 0.234 | 0.345 |
| 175 | Gambia | 0.445 | 0.496 | -3 | -0.693 | 0.293 | 0.406 |
| 176 | Liberia | 0.436 | 0.480 | -1 | -1.019b/ | 0.320 | 0.426 |
| 177 | South Sudan | 0.432 | 0.433 | 8 | 0.000c/ | 0.307 | 0.307 |
| 178 | Malawi | 0.426 | 0.483 | -4 | -0.938 | 0.322 | 0.470 |
| 179 | Mozambique | 0.420 | 0.456 | 2 | -0.374 | 0.308 | 0.395 |
| 180 | Guinea-Bissau | 0.417 | 0.480 | -5 | -0.705 | 0.272 | 0.414 |
| 181 | Guinea | 0.414 | 0.477 | -3 | -0.573 | 0.231 | 0.354 |
| 182 | Yemen | 0.399 | 0.470 | -3 | -1.607b/ | 0.213 | 0.350 |
| 183 | Sierra Leone | 0.398 | 0.452 | -1 | -0.712 | 0.278 | 0.406 |
| 184 | Central African Republic | 0.390 | 0.397 | 4 | -0.200 | 0.333 | 0.353 |
| 185 | Mali | 0.389 | 0.434 | -1 | -0.442 | 0.206 | 0.286 |
| 186 | Burundi | 0.375 | 0.433 | -1 | -0.598 | 0.270 | 0.417 |
| 187 | Niger | 0.355 | 0.394 | 2 | -0.420 | 0.183 | 0.249 |
| 188 | Chad | 0.346 | 0.398 | -1 | -0.734 | 0.189 | 0.288 |
| 189 | Burkina Faso | 0.319 | 0.452 | -7 | -1.059b/ | 0.110 | 0.312 |
Notes: a/ In the calculation of the adjusted indicator for education, w is set equal to 0. b/ In the calculation of the adjusted indicator for education, w is set equal to -1. c/ Due to lack of data, w is set equal to 0.
Source: Own estimation using data from UNDP (2020a; 2022).
The rankings that are obtained using the adjusted HDI and the official 2020 HDI make for interesting comparisons. In the case of the highest-ranking countries there are minor changes: Switzerland is now at the top, while Norway ties with Ireland in the second place. Burkina Faso, on the other hand, replaces Niger and becomes the lowest-ranking country, while the latest country jumps up two places. The next interesting fact concerns the four tiers used by UNDP to group countries: Very high, high, medium, and low human development. Originally, there were 66 countries in the very high human development group (HDI ≥ 0.8), but now the number is reduced to 61 in Table 2.
On the other hand, among the low human development group (HDI < 0.55) the number of countries is increased from 33 to 42 once the AHDI is considered. The most striking comparisons correspond, however, to specific countries. For instance, the official HDI for Brazil is 0.765, which places it in the 84th position among 189 countries, but its adjusted HDI is 0.712, which makes Brazil to plummet 24 places to the 108th position in the new ranking. This is so because Brazil’s mean forecasting error is w = -0.782, given that it has consistently overestimated the years of schooling for children through the decades. That in turn makes the weight of its m, the actual mean of years of schooling, to be almost 90 percent. That country is not alone in the case of changes in the ranking, there are other thirteen countries that also suffer a drop of at least ten positions: Bhutan (-23), Tunisia (-23), Timor-Leste (-21), Nepal (-18), Uruguay (-16), Kuwait (-15), Libya (-14), Benin (-13), Portugal (-13), Turkey (-13), Grenada (-12), Maldives (-12) and Spain (-10).
On the other hand, countries for which the estimated years of schooling happened to be close to the mean that was registered two decades later, certainly improve their ranking in our adjusted HDI. Such is notoriously the case of Eritrea (10), Jordan (9), Mongolia (9), Pakistan (9), Azerbaijan (8), Botswana (8), Jamaica (8), Nigeria (8), Samoa (8), South Sudan (8), Armenia (7), Côte d’Ivoire (7), Djibouti (7) and Turkmenistan (7). Thus, by adopting the weighted geometric mean that we propose, the adjusted HDI would account for the countries’ true level of implementation of the expected years of schooling over time -and would do that without adding unnecessary complexity to the calculations.
We believe that a methodological change of this nature is needed, since, following Sen’s concept of capabilities, the HDI should provide a measure of the extent to which people experience different lives due to distinctive levels of access to valuable functioning, such as the entrance to different levels of education.
Before concluding this section, we note that the methodological adjustment proposed here also helps to ameliorate the score inflation that the HDI has suffered over the decades. In the year 2020, for instance, the range of values of the HDI was (0.394, 0.957), while the range in the case of the AHDI is (0.319, 0.955). Two reasons explain that difference: The geometric mean is always less or equal than the arithmetic mean, and the AHDI penalizes the overestimation of the years of schooling for children entering school. For those two same reasons, it should be expected that for most countries AHDI ( HDI. Although that it is not necessarily always the case, as Jordan, Kyrgyzstan and Samoa exemplify in Table 2.
A final note to be made is that, for reasons given earlier, it would be useful to replace the indicator S with a new estimate, more comprehensive, that would include not only the expected years of schooling for children that are entering school, but also, in general, the average years of schooling for all adults aged 25 and older that each country is expected to have two decades later. By doing so, the comparison of current and future values of M would be straightforward and, consequently, the advances in education made by each country would be more easily quantified.
4. CONCLUSION
The controversial aspects of the HDI are not a novelty. The UNDP indicator has been subjected to praise and criticism since its conception. The methodological changes that were made in 2010 represented a welcome improvement, particularly the adoption of the geometric mean for the aggregate index. However, the use of the arithmetic mean to calculate the indicator for education, and the uncritical use, as one of its components, of the expected years of education for children entering school, might lead to three unintended effects: 1) in the case of some countries, the HDI might be magnified without reason; 2) countries with similar levels of development could be ranked far away from each other due to different schooling expectations; 3) the UNDP classification of the countries into four tiers of development could be compromised, since the HDI might artificially narrow the gap between some of them.
Among those three shortcomings, the last one is the most worrisome. In order to classify countries by their level of development, UNDP correctly focuses not only on national income per capita, but also on life expectancy at birth and the indicator of education mentioned earlier. But, as shown in this paper, the uncritical use of this last component can compromise the robustness of the HDI, and hence the ranking of countries into four tiers: Very high, high, medium, and low human development. This classification is important not only because countries can compare themselves with others, but also, in the case of the low human development group, it allows them to eventually receive foreign aid.
To address those distortions, we present in this paper an AHDI that could prove to be useful to ameliorate those problems. It is based on a weighted geometric mean that is calculated using the forecasting error that each country makes when estimating the expected years of schooling that will take place twenty years later. As shown before, using the HDI there are 66 countries in the very high human development group, while the number is reduced to 61 when using the AHDI. In contrast, the number of countries in the low human development group increases from 33 to 42 once the AHDI is considered.
Aside from making more robust the HDI, the methodological change that we recommend here could have a second use. It may help to follow the countries’ distinct levels of concrete commitment in the implementation of children’s education over time.

