Introduction
The central Mexican Pacific (CMP) constitutes a marine convergence zone that is mainly influenced by the water masses of the California Current (CC) and Mexican Coastal Current (MCC) (Lavín and Marinone 2003, López-Sandoval et al. 2009b). Changes in temperature, primary productivity, and light attenuation can influence the biological attributes of marine regions (Espinosa-Carreón and Valdez-Holguín 2007, Ribas-Ribas et al. 2011, Speers et al. 2016). Particulate organic and inorganic carbon (POC and PIC, respectively) are both indicators of CO2production, and variations in their content can alter the air-sea flux of CO2at the surface and carbon cycle in the water column (Gafar et al. 2019, Hopkins et al. 2019). Variations in energy flow, temperature, water quality, and carbon availability can affect biodiversity, coastal ecosystems, and ecosystem services (IPCC 2002). Moreover, the convergence of 2 biogeographical regions (Spalding et al. 2007) in the CMP highlights spatiotemporal transitions in the area from both oceanographic and biological perspectives.
Seasonal, annual, and interannual environmental conditions are influenced by mesoscale processes, such as El Niño/Southern Oscillation (ENSO) events and oceanographic patterns, especially over transition areas like the CMP (Maul et al. 1984, Brodeur et al. 2003, Ballance et al. 2006, Palacios et al. 2006, Robertson and Cramer 2009). This affects species richness and community composition as well as oceanographic processes like upwelling (Harley et al. 2006, Carpenter et al. 2008).
ENSO events are the primary source of interannual variation in the CMP (Lavín and Marinone 2003), and the organisms present within this transition zone have adapted to annual cyclical changes in their environment (Green and Fisher 2004). However, anomalous changes in environmental conditions can negatively affect their growth (e.g., reduced carbonate assimilation by calcifying organisms like corals) and reproduction (e.g., reduced fecundity in various fish species; Brander 2010, Wild et al. 2011, Rodríguez-Troncoso et al. 2016). Therefore, the recent changes in the intensity and periodicity of ENSO events may threaten the organisms of the CMP (Palacios et al. 2006). These unexpected changes often occur over short time periods (i.e., a few months), which are insufficient for organisms to adequately respond. In particular, important life cycle stages (e.g., breeding, feeding, and growth) can be severely affected by sudden environmental change (Donelson et al. 2010).
In the CMP, the warm phase of ENSO (El Niño) is characterized by the intrusion of warm southern waters from the central Pacific that increase sea surface temperature and deepen the thermocline and nutricline, followed by a reduction in primary productivity in shallow, coastal waters (McPhaden and Zhang 2002, Páez-Osuna et al. 2016). Regional variation coupled with the recently enhanced ENSO effects have generated a zone of oceanographic instability that affects resident species (Magaña-Rueda et al. 1997, Reyes-Coca and Troncoso-Gaytán 2001, Lee and McPhaden 2010). Within the Gulf of California (GC), oceanographic variability and ENSO effects have been well documented (Alvarez-Borrego et al. 1979, Álvarez-Borrego and Lara-Lara 1991, Lavín and Marinone 2003, Espinosa-Carreón and Valdez-Holguín 2007, Ledesma-Vázquez et al. 2009, Mercado-Santana et al. 2017); however, these phenomena remain understudied in areas outside the GC, such as the CMP (Filonov et al. 2000, López-Sandoval et al. 2009b), even when these areas harbor species of both commercial and scientific interest (Moncayo-Estrada et al. 2006).
Currently, no recent studies have described changes in the oceanographic conditions of the CMP, which are increasing in both intensity and frequency due to climate change (IPCC 2002, di Lorenzo et al. 2010, Lee and McPhaden 2010). Understanding how these changes occur within the CMP is important to evaluate their effects on resident species. Therefore, the aim of this study was to describe the variation in 6 environmental variables within the CMP over a 7-year period, which included 2 intense ENSO events.
Materials and methods
Study area
The CMP comprises the coasts of Michoacán, Colima, Jalisco, and Nayarit. The study area (17-23° N, 108-102° W) covered 48,846.48 km2of oceanic and coastal zones. The CMP is characterized by a narrow continental shelf (~100 km) that further narrows to the south and by depths >2,000 m throughout the region, with the deepest areas reaching 5,000 m. In the northern portion of the study area off Nayarit and Jalisco, the shelf is shallow (<200 m), whereas in the southern area off Colima and Michoacán, the shelf is narrow (<10 km) with deep waters near the coast. Finally, this area includes 3 insular systems, Marias Islands, Isabel Island, and Marietas Islands, which are located on the continental platform of Nayarit in the northern CMP (Reyes-Bonilla 2003).
The CMP is influenced nearly year-round by northwesterly winds (Fiedler and Talley 2006, Pantoja et al. 2012) that increase the number of eddies and meanders, which in turn promote an increase in productivity near the coast (Lavín et al. 2006). In the summer, the CMP is influenced by the poleward MCC, which is characterized by high temperature and nutrient-poor water (Badan-Dangon 1998, Fiedler and Talley 2006). During winter, the CMP is influenced by the CC, which is characterized by cold water with high nutrient and oxygen concentrations (Cepeda-Morales et al. 2009). In addition, the cyclonic season in the CMP generates rainfall from June to October (García-Oliva et al. 1991, 2002).
Data collection
To characterize the temporal oceanographic variation in the CMP, variables that have a major influence on the distribution of resident species were evaluated. These variables were sea surface temperature (SST), primary productivity (PP), chlorophyll concentration (Chl), and water clarity based on the diffuse attenuation coefficient (K490). In addition, the availability of both particulate inorganic carbon (PIC) and particulate organic carbon (POC) were included, as these determine the distribution of zones with high CO2concentrations, which in turn affect the zooplankton distributions throughout the water column (Gafar et al. 2019, Hopkins et al. 2019).
The numerical values of the oceanographic variables for the period 2010 to 2017 were obtained through the ERDDAP platform of the National Oceanic and Atmospheric Administration (NOAA; Simons and Mendelssohn 2012, https://coastwatch.pfeg.noaa.gov/erddap/index.html). Data corresponding to the aforementioned variables collected by the Aqua/MODIS sensor with monthly periodicity and a minimum pixel value of 0.025° latitude were used in the analyses. An atmospheric correction was applied to the data to obtain a measurement of the outflow radiance of the water. These radiance values were processed for each of the environmental variables using the OC3M algorithm developed by the National Aeronautics and Space Administration (NASA). Prior to the analyses, all oceanographic variables were standardized to a pixel resolution of 0.08 × 0.08 latitude degrees (8.45 km2, 5,625.00 pixels per image) and to mean monthly values (total data sets = 94). Finally, the monthly Multivariate ENSO Index (MEI) was obtained from the NOAA physical sciences laboratory (Wolter and Timlin 2011) and used to perform the statistical procedures described below.
Data analyses
As the data did not comply with the assumptions of parametric statistics, nonparametric tests were used. To compare temporal variation among the variables, 2 Friedman tests (nonparametric repeated-measures analysis of variance) were conducted for each variable using 2 sources of primary variation: month-to-month for intrannual variation and year-to-year for interannual variation. To determine the differences between months and years, ana posteriorinonparametric Tukey test was performed. A comparison of anomalies standardized to the mean was conducted based on the monthly average value of each variable and the corresponding yearly average to identify differences with respect to the general trend of each variable.
The variables were standardized to zero mean and were used to establish the relationships between the variables based on nonparametric Spearman correlations, the monthly values of each oceanographic measurement, and the monthly MEI values. In addition, a cross-correlation test was performed to identify the lag between the highest value of each oceanographic variable and the MEI. Finally, a spectral analysis was performed to determine the frequency of variation of the time series corresponding to the 6 variables. All data analyses and graphics were performed using the packages ‘stats’ (statistical analysis) and ‘ggplot2’ and ‘gplots’ (graphing) (R Core Team 2021).
Results
Temporal characterization and anomaly analysis
Sea surface temperature
The mean SST was 28 °C (SD = 2.08, Fig. 1a), with maximum and minimum monthly values of 31.19 °C in July 2014 and 23.34 °C in February 2011, respectively (Fig. 1a). Differences among monthly SST were observed in all months (Table 1) except in February and March, which showed the lowest values (Fig. 2a). The results showed that the region is characterized by a cold season from December to May and a warm season from July to November.
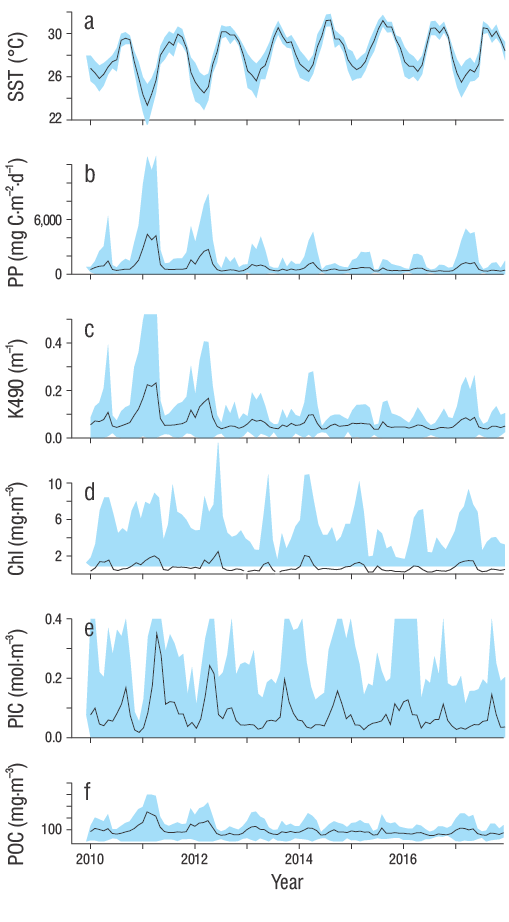
Figure 1. Mean monthly values of 6 oceanographic variables from 2010 to 2017 in the central Mexican Pacific. Blue shade represents standard deviation values. (a) Sea surface temperature (SST, °C), (b) primary productivity (PP, mg C·m−2·d−1), (c) diffuse attenuation coefficient (K490, m-1), (d) chlorophyll concentration (Chl, mg·m−3), (e) particulate inorganic carbon (PIC, mol·m−3), and (f) particulate organic carbon (POC, mg·m−3).
Table 1. Friedman test results showing interannual and monthly differences SST: sea surface temperature; PP: primary productivity; K490: diffuse attenuation coefficient; Chl: chlorophyll concentration; PIC: particulate inorganic carbon concentration; and POC: particulate organic carbon concentration.
| SST | PP | K490 | ||||||
| Factor | Friedman χ² | Pvalue | Friedman χ² | Pvalue | Friedman χ² | Pvalue | ||
| Months | 38.361 | <0.001 | 44.720 | <0.001 | 46.889 | <0.001 | ||
| Year | 79.840 | <0.002 | 60.231 | <0.001 | 59.212 | <0.001 | ||
| Chl | PIC | POC | ||||||
| Factor | Friedman χ² | Pvalue | Friedman χ² | Pvalue | Friedman χ² | Pvalue | ||
| Months | 23.750 | <0.001 | 18.303 | 0.010 | 43.667 | <0.001 | ||
| Year | 36.667 | <0.001 | 23.374 | 0.010 | 58.000 | <0.001 | ||
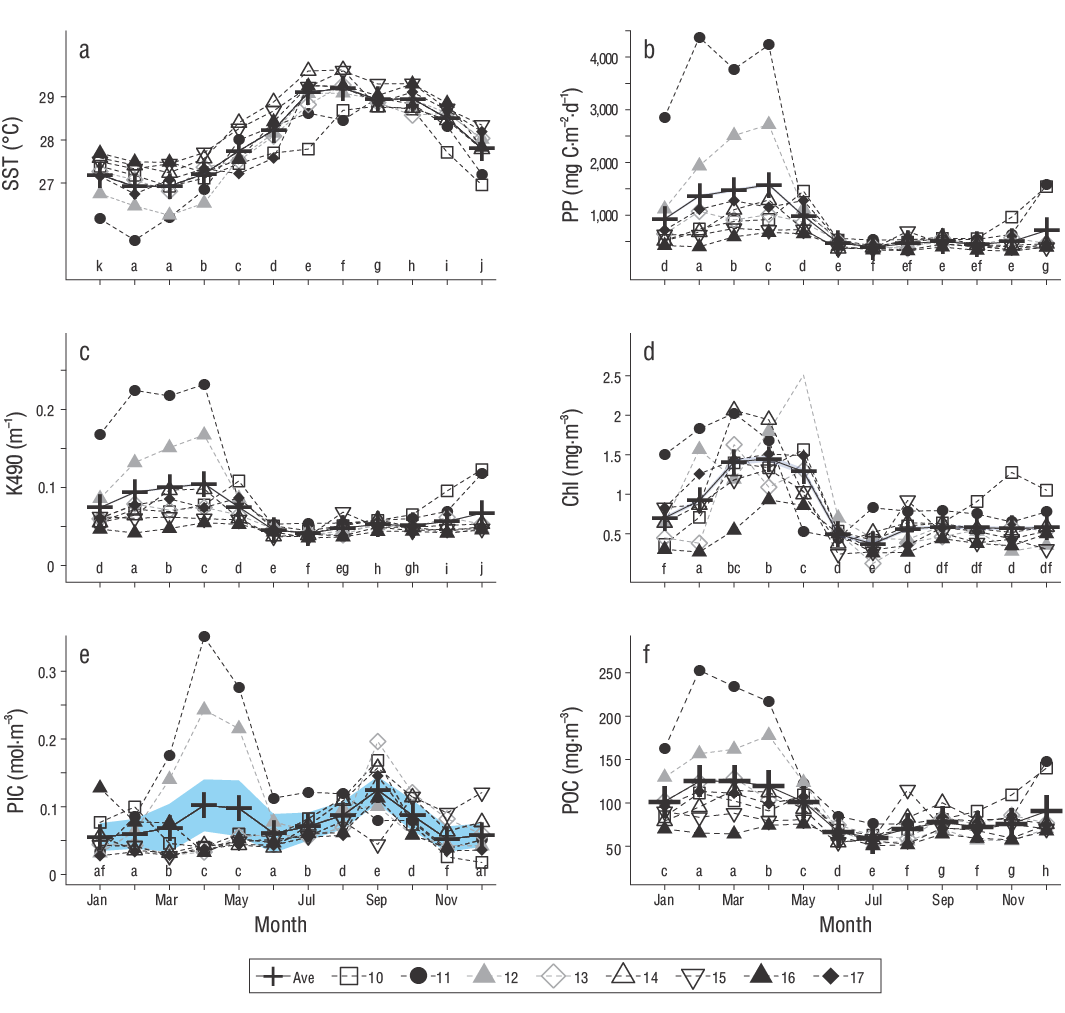
Figure 2. Monthly mean values of 6 oceanographic variables from 2010 to 2017 in the central Mexican Pacific. Blue shade represents standard error values. (a) Sea surface temperature (SST, °C), (b) primary productivity (PP, mg C·m−2·d−1), (c) diffuse attenuation coefficient (K490, m-1), (d) chlorophyll concentration (Chl, mg·m−3), (e) particulate inorganic carbon (PIC, mol·m−3), (f) Particulate organic carbon (POC, mg·m−3). Ave: monthly average value of the variable constructed from the years of observations. Names and months with the same letter are similar according to Tukey a posteriori tests.
Differences were also observed among years (Table 1), with 2011 and 2015 being the coldest and warmest years, respectively (Fig. 3a). Cold years (defined as having an average value lower than the average value of all years) corresponded to 2010-2013, whereas warm years (defined as having an average value higher than the average value of all years) were 2014 and 2015 (Fig. 3a). The analysis of the annual averages with respect to the average SST value for each year indicated that 2010-2012 exhibited the highest proportion of negative variation based on the average monthly values. In contrast, 2014-2016 exhibited the highest proportion of positive variation in SST based on the average monthly values (Fig. 2a).
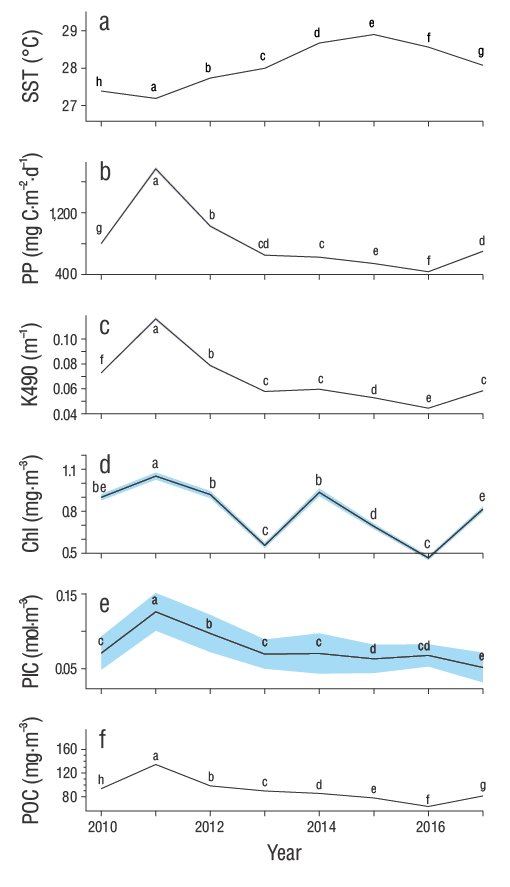
Figure 3. Mean annual values of 6 oceanographic variables from 2010 to 2017 in the central Mexican Pacific. Blue shade represents standard error values. (a) Sea surface temperature (SST, °C), (b) primary productivity (PP, mg C·m−2·d−1), (c) diffuse attenuation coefficient (K490, m-1), (d) chlorophyll concentration (Chl, mg·m−3), (e) particulate inorganic carbon (PIC, mol·m−3), (f) particulate organic carbon (POC, mg·m−3). Names and years with the same letter are similar according to Tukey a posteriori tests.
Primary productivity
The average PP value in the study area was 818.41 mg C·m−2·d−1(SD = 2,511.62), with the highest value observed in February 2011 (4,375.07 mg C·m−2·d−1) and the lowest value observed in November 2016 (319.28 mg C·m−2·d−1) (Fig. 1b). The monthly pattern highlighted an increase in PP during February 2011 that was 5 times greater than the overall average (Fig. 1b). PP showed differences among months, with the highest and lowest values corresponding to January-May and June-December, respectively (Fig. 2b).
When comparing differences among years, 2011 showed the highest PP concentration (1,630.00 mg C·m−2·d−1), which was twice the average of all years. The a posteriori tests revealed significant differences among all years except for 2013, 2014, and 2017 (Fig. 3b). For this variable, the years with the highest proportion of positive monthly anomalies with respect to the mean for all years corresponded to the period of 2010-2013 (Fig. 2b), whereas 2016 predominantly exhibited negative anomalies.
Diffuse attenuation coefficient
Overall, the mean K490 value in the study area was 0.060 m−1(SD = 0.120). The highest and lowest K490 values were observed in April 2011 (0.232 m−1) and July 2012 (0.035 m−1) (Fig. 1c). Monthly comparisons resulted in significant differences (Table 1) and revealed 2 periods: one from January to May with values above the monthly average for all years and the other from June to December with values below the monthly average for all years (Table 1, Fig. 2c).
Differences among years were also observed, with 2010-2012 exhibiting values higher than the total average (Fig. 3c). The largest positive anomalies in K490 were observed from 2010 to 2013 (Fig. 2c). In addition, the negative anomalies in K490 were found closer to the total average than were the positive K490 anomalies, with 2016 exhibiting the greatest negative anomaly value.
Chlorophyll concentration
The mean Chl concentration in the study area was 0.793 mg Chl·m−3(SD = 4.300), with the highest and lowest values observed in May 2012 (2.507 mg Chl·m−3) and June 2013 (0.124 mg Chl·m−3), respectively (Fig. 1d). Monthly comparisons revealed 2 periods: one from February to May characterized by high Chl concentrations and the other from June to December characterized by a decrease in the Chl concentration (Fig. 2d, Table 1). Differences in the Chl concentration among years were less marked than those observed among months, and differences across years were mainly found in 2010, 2011, 2012, and 2014, all of which exhibited the highest mean Chl concentrations (Fig. 3d). The positive Chl anomalies were observed during 2010-2013, whereas the greatest negative Chl anomalies were observed in 2016 (Fig. 2d).
Concentration of particulate inorganic carbon
The mean PIC concentration in the study area was 0.077 mol·m−3(SD = 0.260), with the highest and lowest concentrations observed in April 2011 (0.035 mol·m−3) and December 2012 (0.017 mol·m−3), respectively (Fig. 1e). Pairwise comparisons resulted in significant differences among monthly PIC concentrations. Two peaks were observed each year: one from August to October and the other from April to May (Fig. 2e).
Annual differences were mainly explained by 2011 and 2012, which showed the highest PIC concentrations, and by 2017, which showed the lowest PIC concentrations (Fig. 3e). As with the other variables, the greatest positive anomalies were observed from 2010 to 2013, although no particular pattern was observed with negative monthly anomalies over the study period (Fig. 2e).
Concentration of particulate organic carbon
The mean POC concentration in the study area was 90.52 mg·m−3(SD = 94.38), with February 2011 exhibiting the highest value (252.92 mg·m−3) and July 2016 exhibiting the lowest value (50.78 mg·m−3). Among all years, 2011 and 2012 showed the widest ranges between maximum and minimum monthly values (Fig. 1f). In addition, significant differences were present among months, with higher and lower POC concentrations observed from January to May and June to December, respectively (Fig. 2f). However, no significant differences were observed among the months with either the highest or lowest POC concentrations.
In contrast, significant differences were also observed among years, with 2011 and 2016 showing the highest and lowest POC concentrations, respectively. Overall, the highest POC concentrations were observed from 2010 to 2012, whereas the lowest POC concentrations were observed from 2013 to 2017 (Fig. 3f). Positive POC anomalies were present in 2011 and 2012, whereas 2016 was characterized by negative anomalies (Fig. 2f).
Multivariate El Niño/Southern Oscillation Index
Our analyses indicated that the MEI varied among and within years. From August 2010 to March 2011, the MEI values were lower than 1.5 SD. Thus, this period can be considered a cold phase of an ENSO event (La Niña). In contrast, from May 2015 to May 2016, the MEI values were higher than 1.5 SD, which indicate that this period of time constituted a warm phase of an ENSO event (El Niño). When comparing both the cold and warm phases, the El Niño years exhibited higher variations in both time and MEI values than those of the La Niña years (Fig. 4).
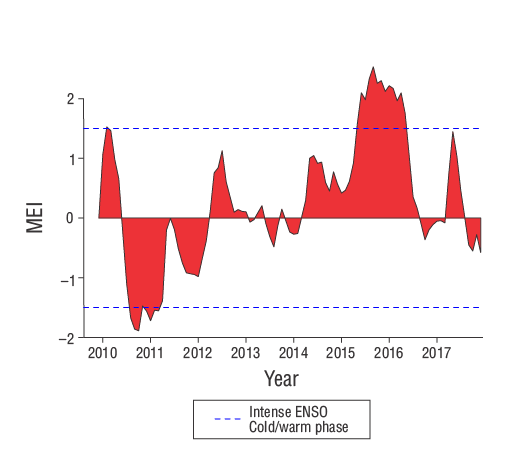
Figure 4. Multivariate El Niño/Southern Oscillation (ENSO) Index (MEI) values and their intensity during 2010-2017 (data from Wolter and Timlin 2011).
Relationships among variables
Among all variables, the highest correlations were observed between SST and PP, followed by the correlations between K490 and Chl and K490 and POC (Fig. 5). Both the MEI and PIC showed the lowest correlations with the other variables (Fig. 5). The cross-correlation analysis of SST with MEI revealed a time lag of 3 months between the highest MEI values and the highest SST values (r= 0.041, Table 2). Moreover, the highest MEI values were associated with time lags greater than 3 months in all comparisons (Table 2).
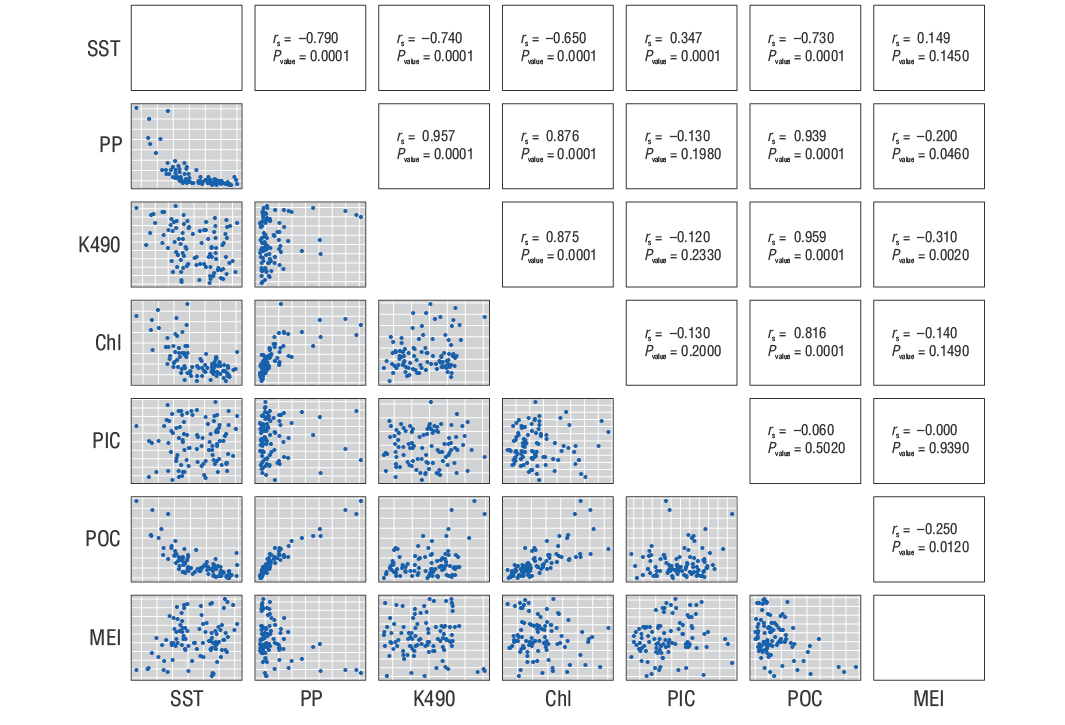
Figure 5. Correlogram of the environmental variables and Multivariate El Niño/Southern Oscillation Index (MEI). The top right shows the results and significance of the Spearman correlations. The lower left shows the correlation diagrams between the variables. SST: sea surface temperature; PP: primary productivity; K490: diffuse attenuation coefficient; Chl: chlorophyll concentration; PIC: particulate inorganic carbon concentration; and POC: particulate organic carbon concentration.
Table 2. Temporal cross-correlation analysis. The first value represents the time lag (months), and the second value represents the correlation value between the higher average values of 6 oceanographic variables. SST: sea surface temperature; PP: primary productivity; K490: diffuse attenuation coefficient; Chl: chlorophyll concentration; PIC: particulate inorganic carbon concentration; POC: particulate organic carbon concentration; MEI: Multivariate El Niño/Southern Oscillation Index.
| PP | K490 | Chl | PIC | POC | MEI | |
| SST | 0.00, -0.69 | 0.00, -0.70 | -1.00, -0.66 | -4.00, 0.38 | 0.00, -0.74 | -4.00, 0.41 |
| PP | 0.00, 0.98 | 0.00, 0.75 | -2.00, 0.61 | 0.00, 0.94 | 4.00, 0.54 | |
| K490 | 0.00, 0.77 | -2.00, 0.56 | 0.00, 0.96 | 3.00, -0.57 | ||
| Chl | -4.00, 0.37 | 0.00, 0.76 | 5.00, -0.48 | |||
| PIC | 2.00, 0.54 | 7.00, -0.40 | ||||
| POC | 4.00, -0.58 |
Spectral analysis
The spectral analysis revealed that the main frequency influencing the variables in this study was 0.0833333. The inverse of this frequency (1/0.0833333) represents a period of 12, which in this study implies an annual cycle represented by 12 months (Fig. 6). In this context, temperature and PIC had the highest and lowest values of the spectrum, respectively.
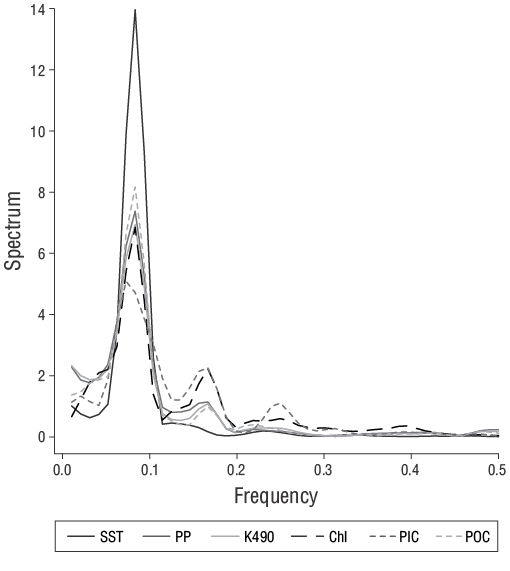
Figure 6. Spectral analysis of the standardized environmental variables used in this study for the central Mexican Pacific. SST: Sea surface temperature; PP: primary productivity; K490: diffuse attenuation coefficient; Chl: chlorophyll concentration; PIC: particulate inorganic carbon; POC: particulate organic carbon.
Discussion
SST, POC, K490, and Chl are essential variables to the dynamics of coastal and pelagic ecosystems (Palacios et al. 2006, Escalante et al. 2013, Audzijonyte et al. 2020). Unlike SST, which shows little variability based on the distance from the coast, PP, Chl, K490, and POC values increase toward the coast (Zeitzschel 1969, Mercado-Santana et al. 2017). SST is not the only variable that affects environmental conditions, local processes, such as land runoff during the rainy season, coastal upwelling, and human activities, can also modify the environment (Zamudio et al. 2001, García-Oliva et al. 2002). Therefore, other processes beyond SST also contribute to oceanographic environmental variability, especially in coastal areas such as the CMP. In this study, the anomalies were consistent over the months and years in that the greatest anomalies were present during the same period (February-March) each year. During this period in 2011, the CMP was affected by the intense effects of a cold ENSO phase.
Given that the correlations between the variables depend on the characteristics of the water masses that converge in the area during cold (December to May) and warm (June to November) seasons, the CC has a more notable influence on the study area during winter (Palacios et al. 2006), whereas the MCC has a greater influence during summer (Collins et al. 1997). The convergence of these currents in the CMP affects the oceanographic conditions present throughout the year. Our results showed that in months with low-temperature values, the mean values of PP, POC, Chl, and K490 increased, and the greatest Chl concentration was present during the cold season in 2011, which agrees with previous observations of the area (Cepeda-Morales et al. 2017). The presence of the CC, which is characterized by high oxygen concentrations (Cepeda-Morales et al. 2013), coincided with an increase in PP, POC, Chl, and K490 during the cold season from December to May (Collins et al. 1997). In addition, intensified northwesterly winds (López-Sandoval et al. 2009a, b) promote upwelling events in the coastal area during this season. Cold and oxygen-rich water coupled with upwelling promotes microalgae blooms (Anderson et al. 2002, Cepeda-Morales et al. 2009, Cortés-Lara et al. 2012), which increase PP and Chl values in the coastal area during the cold ENSO phase. The increase in the periodicity of ENSO may further extend the cold season with increased nutrient availability and turbidity in the CMP.
During the years included in this study (2010-2017), an El Niño event occurred (2015-2016) during which the influence of the MCC increased in the CMP. This current was characterized by higher temperatures than those of the CC and severely hypoxic waters (Cepeda-Morales et al. 2013). These characteristics, combined with the diminished intensity of the northwesterly winds in the area during the same months (López-Sandoval et al. 2009b), suppressed upwelling events. As oxygen and nutrients are essential for the growth of photosynthetic microorganisms that generate up to 90% of the Chl and biomass in the CMP (Cepeda-Morales et al. 2009), the biological processes in the region may have been severely compromised during this intense and extended warm ENSO phase. The time lags between the variables considered in this study and the effects of El Niño events have been extensively studied, and the results of this study agree with the lag of 1-3 months that was described by Kumar in 2003, which has been observed since 1950. However, this phenomenon has increased in periodicity and intensity as of late, which may be affecting the annual cycle of oceanographic variation in the CMP and the variables in this study. The lag observed in this study was not only found in SST but also in the cross-correlation analysis, in which we observed that with respect to the other variables, the effect of the 2015-2016 El Niño event was also detected months after the highest values of this MEI were present.
Unlike the other physicochemical variables, PIC showed no differences between the cold and warm seasons. However, PIC exhibited 2 periods of increase based on monthly measurements. The first period occurred from April to May and was related to the influence of the CC and the resuspension of seafloor material by upwelling events in the coastal zone. The second period, which was stronger than the first, was observed from August to October and was a consequence of the intense rainy season that resulted in the runoff of terrigenous materials via different rivers (the Ameca River, Grande de Santiago River, and Armeria River) and brackish water lagoons (Marismas Nacionales). During this period, PIC increased primarily during September (Figs. 1e, 2e).
Overall, the cold seasons observed in 2010 and 2011 in the CMP were related to a La Niña event. As such, this cold season coincided with the most abrupt changes in the other variables considered in this study. The interannual variation in SST during this period reflected a change of 6 °C in only 6 months, which was greater than the temperature difference observed over the same period in the other years considered in this study (i.e., 4 °C). While low La Niña MEI values were recorded in September 2010, the effects of this phenomena were observed 4 months later (January-February) in the CMP. This apparent lack of relationship between the MEI and the more extreme values can be attributed to the time it takes severe La Niña and El Niño events to influence the region. During 2015-2016, an increase in temperature was observed due to the strong and extended El Niño event, which further intensified the characteristics of the warm-water period. The effects of this event were observed after 6 months and were characterized by the lowest PP, Chl, K490, POC, and PIC values.
The intraannual variability in this study was consistent with that of previous studies of the GC. However, these studies also acknowledge that the variability of the CMP is particularly high compared to that of the rest of the gulf (Mercado-Santana et al. 2017). The PP values in Mexican seas indicate that a highly productive period occurs within the area covered by this study during the cold season, which is only surpassed by the high productivity of the northern GC (Sosa-Ávalos et al. 2017). Additionally, the CMP shows great environmental variability between the cold and warm periods throughout the year (Mercado-Santana et al. 2017, Sosa-Ávalos et al. 2017). This study shows that the main cycle of variation for the 6 oceanographic variables evaluated corresponds to 12 months, which further supports the importance and influence of currents on the CMP and its biological resources. Indeed, the CMP is considered a temporary convergence zone for 2 marine currents. The natural oceanographic variability of the CMP combined with the increasingly intense and long-lasting effects of ENSO events augment the existing oceanographic variation within the CMP region.


 texto en


