1. Introduction
Projecting the future climate condition of a given location is an issue of importance for communities, political systems, and environmental scientists. The climate analogue approach can be used to provide this vital information. Identifying spatial and temporal analogues allows us to identify biota and harvest species that are most susceptible to climate change (Leibing et al., 2013; Nakaegawa et al., 2017). This method also provides insight into how present climate conditions in target regions compare to future or past conditions in other areas (e.g., Williams et al., 2007; Ramírez-Villegas et al., 2011) and it has been applied in Central America (Pinzón et al., 2017), Russia (Nakaegawa et al., 2019a), Japan (Ishizaki et al., 2012), Australia (Nakaegawa et al., 2017), and at a global scale (Arnbjerg-Nielsen et al., 2015; Soteriades et al., 2017). Cabré et al. (2014) stated that “[Los Andes] produce distinctive features in the South American climate, particularly at low levels. The presence of a low-level jet along the eastern slopes of the central Andes as well as the existence of a region of maximum frequency of winter cyclogenesis over eastern South America, are examples of the topographic influence on the continental climate”. Hibino et al. (2015) obtained probabilistic scatterings of climate analogues by integrating uncertainties derived from sea surface temperature (SST) projections, climate models themselves, and inherent variability.
Western South America comprises a broad range of climate conditions, including tropical, dry, temperate, and cold climate regimes. Locally, forcing (e.g., orographic precipitation [Nakaegawa et al., 2019b]) occurs off the west coast of southern South America and influences the southern Andes. The Andes may affect future climate changes in western America, although future precipitation at the end of this century is projected to increase during the wet season and to decrease in the dry season over most of South America (Kitoh et al., 2011). The breadth of the Andean mountain range is < 200 km at subtropical latitudes and increases to 400 km in the south. This gives rise to a raised tableland that disturbs the climatological behavior in South America, including tropical, subtropical, and extratropical landscapes. West of the Andes, seasonal precipitation is controlled among the SST of the Pacific Ocean, by two other factors that define it (Solman, 2013). In this area, hydro-climatic conditions are further influenced by surface-air temperature (SAT) differences between the mainland and oceans. The Atlantic and Pacific oceans are the most important determinants of climate variability in South America (Ramos da Silva and Hass, 2016), with precipitation appearing to be the leading hydro-climatological component (e.g., Nakaegawa et al., 2014a; Kusunoki et al., 2019). Similarly, heterogeneous demographic group migration is most strongly influenced by exposure to monthly SAT shocks, relative to monthly precipitation shocks and regular changes in the climate over longer time periods (Thiede et al., 2016).
In the last three years, El Niño, the Pacific Decadal Oscillation, and the highest SAT measures ever recorded have occurred in South America. These events have affected agriculture and food security in Latin America and have led to economic and social impacts (Martínez et al., 2017). Pugh et al. (2016) estimated that a significant proportion of the existing global areas for growing wheat, maize, and rice are vulnerable to climate change. Giorgi (2006) suggested that some regions may be particularly susceptible even to subtle effects of reduced precipitation and increased variation in precipitation (Nakaegawa et al., 2014b, c). Furthermore, wild species are vulnerable even to minor changes in climate (Mora et al., 2013).
Drastic economic impacts observed in some countries can be directly attributable to climate change (Fábrega et al., 2013). The extent of climate change impacts in western South America point to the ways in which local-scale future climates may fluctuate under global climate change. We identified climate analogues by identifying cities where the current climate was similar to that of the projected future climate of another target city. Future climate analogues for six western South American capital cities were identified using the non-parametric method of Hibino et al. (2015)). Simulations of the Meteorological Research Institute-Atmospheric General Circulation Model (MRI-AGCM [Mizuta et al., 2012]) were performed for future (n = 24) and current (n = 6) climates to reproduce uncertainties in climate projections.
2. Materials and methods
2.1 Climate analogues
Six-hundred-year modeled data and a novel methodological approach are applied to assess climate analogues at a monthly mean timescale in a probabilistic manner. We used the root mean square difference of monthly mean SAT and precipitation data between current and projected future climates in Eqs. (1), (2), and (3) to compute similarity scores. Similarity scores for climate analogues account for uncertainties in climate projections. Climate similarity across years was evaluated by relating the monthly time series of SAT and precipitation for each sample (city).
To evaluate future changes in precipitation and SAT, in addition to uncertainties in climate projections for target cities, the similarity between a climate analogue city (with geographical location l) and the projected future climate in a given target city (with geographical location l target ) was calculated using the root mean square deviation (RMSD) as follows:
where q is an index of an ensemble of current climate variables
across years (1-25) and months (from i = 1 to
µ = 12). Brackets
where j is an index of ensemble variables of future climate (1 - 600). Thus, similarity scores for precipitation and SAT were calculated as follows:
where Ω, the nominator, specifies the number of times during which the condition inside the bracket is satisfied. This accounts for the relative degree of similarity given climate projection uncertainties. Scores were averaged over 25 samples of current climate, and the total similarity score was calculated from the SAT and precipitation scores as S = S T × S P . A similarity score therefore reflects the consistency of a climate analogue with projections for the target city.
2.2 Current observations
The current observation period is selected to be equivalent to the length of current climate simulations (1979-2003). Due to constraints in the observation dataset (Mitchell and Jones, 2005) climate analogues were identified at a 0.5º horizontal resolution. Cities themselves were not explicitly represented, but rather a 0.5º grid-box value representing the effect of urban areas on climate was applied over the cities. These grid-boxes were used to remove bias in the AGCM simulations.
2.3 Ensemble climate simulations
Experimental variables of future climate (n = 24) comprised three convection schemes (the Yoshimura scheme [YS, Yoshimura et al., 2015], the Arakawa-Schubert scheme [AS, Randall and Pan, 1993], and the Kain-Fritsch scheme [KF, Kain and Fritsch, 1993]), two initial conditions, and four SST spatial patterns. Each variable included a 25-year integration period. Therefore, we produced a total of 600 years of climate projections. The YS uses a linear interpolation between two convective updrafts, which allows for unequivocal classification of cloud groupings, and further has the benefit of layer-by-layer variable calculation. The AS assumes a layered atmosphere with a cumulus cloud sheet occupying a minor portion and considers updraft flux and the properties of dry, cold air located above clouds. The KF uses a cloud model to regulate the interchange of mass between clouds and their environs as a function of the opposition of dissimilar mixtures of clear and overcast air.
All current and future climate projections using AGCMs inherently include model biases. We prepared unbiased future climate projections by applying the Δ method to the climate simulations. We recognized climate analogue cities as those where the current climatic conditions most closely resembled the projected previous 25-year twenty-first century climatic conditions in each target city using a global search and two variables (monthly mean SAT and precipitation). We then introduced a variation factor, or pattern-scaling factor, to obtain unbiased data about the future climate. Future monthly discrepancies in SAT (T) and precipitation (P) were obtained using Eqs. (4) and (5), respectively, as follows:
where obs denotes the current observation data, and Mp and Mf are the future general circulation models, respectively. We only applied current model results using the Δ method and did not include these results in the calculations of similarity scores, as described above.
2.4 Emission scenarios
We ran future climate simulations for the final 25 years of the twenty-first century (2075-2099) using scenario A1B of the Intergovernmental Panel on Climate Change (IPCC, 2000) from the Special Report on Emissions Scenarios (SRES) in the MRI-AGCM3.2H model. The horizontal resolution of this model was approximately 60 km. Relative to the current 25-year period (1979-2003), global mean SST is projected to increase by 2.17 ºC in the final 25 years of the twenty-first century. The SRES is widely used by the IPCC Fifth Assessment Report Working Group II. Although another scenario, Representative Concentration Pathway 6.0 W m-2 (RCP 6.0) is used by Working Group I, these scenarios have similar predicted increases in SAT, i.e., a change of 1.4-3.1 ºC is predicted by RCP 6.0. The estimated global mean SAT according to SRES A1B is 2.8 ºC, whereas that according to RPC 6.0 is not yet published but is assumed to be 2.3 ºC. However, local-scale changes are expected to vary among regions, and differences among local-scale changes should be greater than that of the global mean change in SAT. Therefore, the results from this study may be used in place of RCP 6.0 values in the IPCC Fifth Assessment Reports.
2.5 Target city selection
The six target capital cities in western South America were selected based on population size (Table I, Fig. 1). The future climate analogue period was the same as that used in the future climate simulations (i.e., 2075-2099). We first projected the future climate of these six capital cities, and then computed similarity scores between pairs of cities and locations around the globe. Locations with maximum similarity scores, both globally and within the Americas, were selected.
Table I Six target capital cities in western South America for which climate analogues were determined.*
| Capital city | Country | Latitude | Longitude | Elevation (masl) | Population of the capital city** |
| Caracas | Venezuela | 10.51 | -66.92 | 934.13 | 2.67 million |
| Bogotá | Colombia | 4.60 | -74.08 | 2605.21 | 7.18 million |
| Quito | Ecuador | -0.21 | -78.50 | 2819.54 | 2.78 million |
| Lima | Peru | -12.05 | -77.03 | 160.94 | 9.75 million |
| La Paz | Bolivia | -16.50 | -68.13 | 3651.43 | 2.72 million |
| Santiago | Chile | -33.44 | -70.65 | 569.82 | 6.26 million |
*City locations are shown in Figure 1.
**Population estimates were obtained from: http://www.ine.gov.ve/ (Caracas), https://www.dane.gov.co (Bogotá), https://www.ecuadorencifras.gob.ec/estadisticas/ (Quito), https://www.inei.gob.pe/ (Lima), https://www.ine.gob.bo (La Paz), and https://www.ine.cl (Santiago).
3. Results and discussion
3.1 Global search
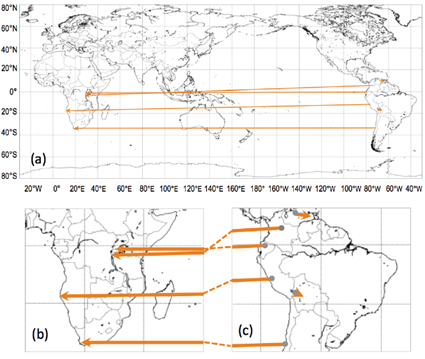
A robust climate analogue method should prioritize compactness and distance over connectedness; analogues can only achieve their purpose with a suitable level of differentiation. Therefore, global searches ensure correct, complete assessments of climate analogues. Spatially, analogues use past climates to inform potential future conditions that may result elsewhere from climate change. The best climate analogue cities for the six target cities, based on a global search, are shown in Figure 2. All analogues of target cities had similarity scores of 0.1-0.3. Of the six analogues, four were located in central and southern Africa, whereas the remaining two were located in South America. The results of regional and global search results are shown in Table II.

Fig. 2 Optimal climate analogue cities for the six target capitals based on a global search: (a) global distribution and enlarged views for (b) Africa and (c) South America. The starting point and arrowhead of each vector represent a target capital and its climate analogue city, respectively. The similarity scores of the six target cities ranged from 0.1 to 0.3.
Table II Climate analogue cities identified using a global search.*
| Target | Analogue (global) | |
| City | City | Country |
| Caracas | Barcelona | Venezuela |
| Bogotá | Bujumbura | Burundi |
| Quito | Kigali | Rwanda |
| Lima | Namibe | Angola |
| La Paz | Oruro | Bolivia |
| Santiago | Cape Town | South Africa |
*See Figure 2 for geographical locations. Note that analogue cities were represented by 0.5º grid boxes.
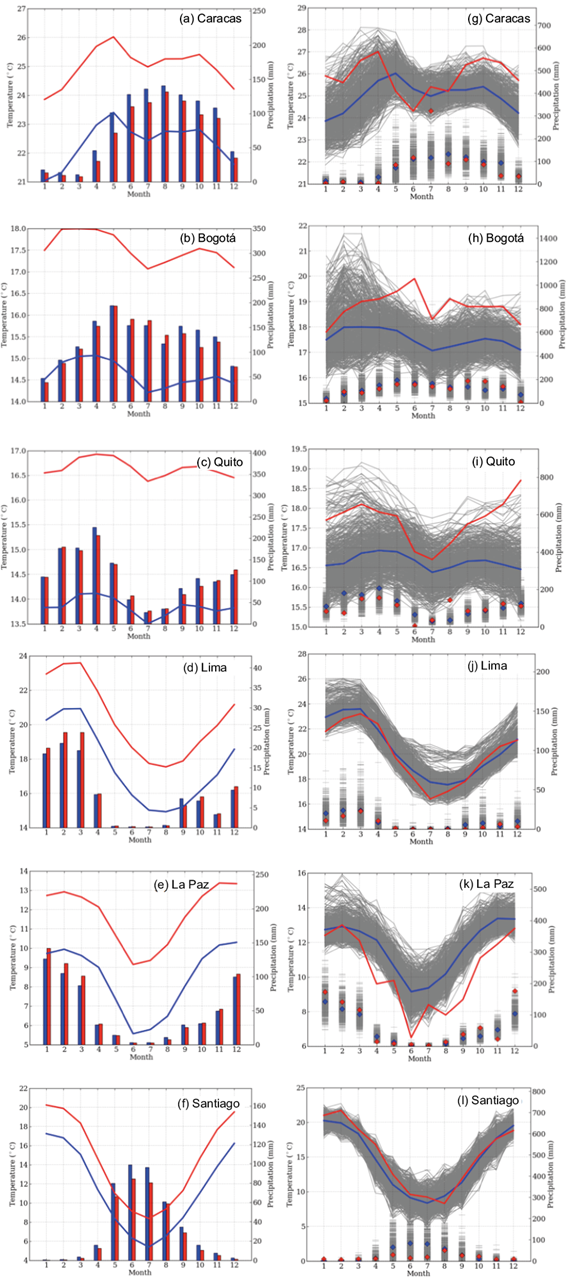
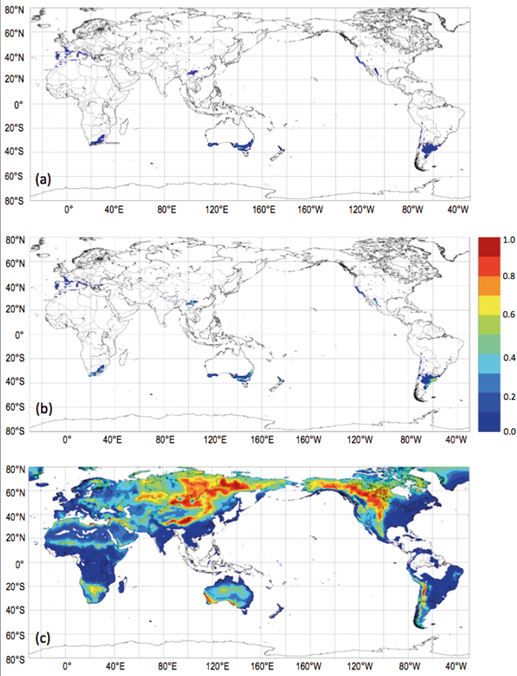
The climate analogue for La Paz, Bolivia, is located in Oruro, Bolivia. The maximum annual change (representing the difference between future and current SAT) in La Paz was 3.0 ºC with the maximum monthly changes expected in June (Fig. 3e). The greatest increase in precipitation in Oruro occurs from January to March and from October to December (Fig. 3k). Total, SAT, and precipitation similarity scores for Santiago, Chile were 0.401, 0.794, and 0.928, respectively (Fig. 4a-c), and the best climate analogue city was Cape Town, South Africa. Other candidate climate analogue regions were located in Australia and South America (Fig. 4a). The future SAT in Santiago was projected to increase by 2.5 ºC, and precipitation was expected to decrease (Fig. 3f, l). Given that climate analogues should share seasonal cycles and comparable SATs in future climate scenarios (Fig. 4b), high SAT similarity scores for analogues of Santiago were limited to a small area of southeastern South Africa. High precipitation similarity scores were well-distributed globally and found for locations in South Africa, Eastern Europe, Siberia, western North America, and western South America (Fig. 4c).

Fig. 3 Climatological monthly mean values of surface air temperature and precipitation for (a and g) Caracas, (b and h) Bogotá, (c and i) Quito, (d and j) Lima, (e and k) La Paz, and (f and l) Santiago. Blue lines and symbols represent the future climatological monthly mean values in the target city, and red represents values for the climate analogue city in 1979. The gray shading represents the 600 realizations of the future climate in the target city produced using multi-ensemble simulations with the MRI-AGCM3.2H model.

Fig. 4 Geographical distribution of normalized (a) integrated similarity scores and similarity scores for (b) surface air temperature and (c) precipitation for climate analogue regions of Santiago, Chile. Scores were normalized based on the highest scores obtained (0.401, 0.794, and 0.928, respectively).
Low similarity scores for the two analogue cities located in South America (Barcelona in Venezuela, and Oruro in Bolivia) were found. These two cities are the climate analogues of Caracas in Venezuela and La Paz in Bolivia, respectively (Fig. 3a, e, g, k). La Paz may experience a unique climate throughout the final 25 years of the twenty-first century (Williams et al., 2007; Nakaegawa et al., 2017; Pinzón et al., 2017) given that the integrated similarity scores, SAT, and maximum precipitation scores were low at 0.027, 0.194, and 0.459, respectively (Table III, Fig. 3e, k). Within central Africa, the cities of Bujumbura, Burundi and Kigali, Rwanda were identified as analogues of the target cities of Bogotá, Colombia and Quito, Ecuador (Figs. 2a and 3b, c, h, i). Quito had the second worst maximum integrated of 0.031, while Bogotá has a high maximum precipitation score of 1.000. Finally, the climate analogue of the target city Lima, Peru is Namibe, Angola. All analogues situated in the southern hemisphere were found at similar latitudes to the target cities.
Table III Maximum integrated similarity scores, maximum surface-air temperature, and maximum precipitation scores for each target city in the global search.
| Target city | Maximum scores | ||
| Integrated | SAT | Precipitation | |
| Caracas | 0.094 | 0.737 | 0.837 |
| Bogotá | 0.196 | 0.594 | 1.000 |
| Quito | 0.031 | 0.255 | 0.394 |
| Lima | 0.165 | 0.499 | 0.970 |
| La Paz | 0.027 | 0.194 | 0.459 |
| Santiago | 0.401 | 0.794 | 0.928 |
SAT: surface-air temperature.
3.2 Intra-Latin America search
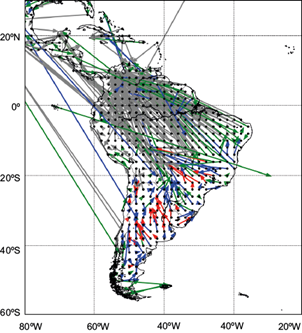
Climate analogues identified in the search restricted to Latin America are depicted in Figure 5. The majority of the target cities are located close to the equator or near predicted future hotspots. Target and analogue cities that appear close together differ greatly in elevation (Table I). The majority of the target cities are located at high elevations with SATs that are correspondingly low relative to lower-elevation cities. Cities that are in close geographic proximity may therefore differ greatly in SAT but share similar seasonal patterns.

Fig. 5 Best climate analogue cities for all 0.5º grid points based on a search confined to the Americas. The starting point and arrowhead of each vector represent a target capital and its climate analogue city, respectively. The color of each arrow indicates the locations’ similarity score: gray = 0.0-0.1, green = 0.1-0.3, blue = 0.3-0.5, and red = 0.5-1.0.
The method applied in this study allowed us to identify analogue cities by evaluating all grid points using integrated similarity scores. The Latin American analogue for Bogotá is located in central Colombia, while those for both Quito and Lima are located in northeastern Latin America, and the analogue of Santiago is located at 70 ºW, 32 ºS. The integrated similarity scores for these four target cities were lower in the intra-Latin America search than in the global search.
3.3 Temporal evolution of analogue city locations
Non-zero integrated similarity scores were distributed in distinct areas on some continents in the global search. Although the changes in SAT and precipitation over years were linear, changes along climate analogue vectors (i.e., geographical change) were not necessarily linear. Vectors were placed lengthwise from the target to the analogue city whenever the vector fell entirely on land (Fig. 5). Elevation changes along the target-analogue vectors were never constant in terms of slope or projected seasonal changes in SAT and precipitation. Thus, lengthwise interpolation could lead to mis-identified analogue cities. The climate analogue method applied here identified analogue cities after projecting the future climate of the target cities using the pattern scaling method for targeted global SAT rise. We do not suggest that the time evolution of the Latin American climate analogues can be approximated as a dividing point on the arrows shown in Figures 2 and 5. Although climate zones were distributed according to latitude as a first-order approximation, they were only defined for land areas.
3.4 Inappropriate climate analogue cities
The analogue cities with the best integrated scores for La Paz and Quito should not be practically considered as analogues because of their low integrated similarity scores (0.090). Both of these target cities should instead be considered as places that will experience entirely novel climates (Williams et al., 2007). However, we note that the best SAT and precipitation scores were reasonable (Table III), and therefore the analogues of these cities can still be used when no other information is available. Analogue locations based on SAT and precipitation scores can be used for specific purposes such as flood prevention or heat wave projections.
4. Conclusions
Climate analogues for six western South American capital cities were identified using a non-parametric climate analogue method and the MRI-AGCM3.2H model under the SRES A1B scenario. For the analysis, two different initial conditions, multi-ensemble simulations, three convection schemes, and four SST datasets were included (Nakaegawa et al., 2017). These datasets may have affected uncertainties in the climate analogues to varying degrees. The method applied in this study identifies likely climate analogues by conceptualizing SAT and precipitation as a time series. Although there are many approaches to identify climate analogues over various time scales, our method used an annual seasonal cycle. The majority of future analogue cities were at lower latitudes than their respective target cities. A global search identified two analogue cities in central South America and the remaining four in central and southern Africa. Projected seasonal variations in surface air temperature and precipitation in Santiago, Chile are similar to the current climate in Cape Town, South Africa, and the climate analogue for La Paz, Bolivia, is found in Oruro, Bolivia. In general, all analogues of target cities had similarity scores of 0.1-0.3. Of the six analogues, four were located in central and southern Africa, whereas the remaining two were located in South America. In the global search, Santiago had the best-matching climate analogue city in the seven cities; La Paz and Quito had the worst and second worst ones, and even the analogue cities with highest score are considered as inappropriate. All climate analogue cities were classified with respect to uncertainties in future climate projections. An analogue search confined to Latin America had lower integrated similarity scores compared to the global search but provided more virtual feelings of future climate of the target cities because populations in western South America have much more knowledge about the climates in South America than those of other regions of the globe.
The latest future climate projections under the Shared Socioeconomic Pathways (SSP)/RCP-based scenario are becoming available, although the results in this study were obtained under the SRES A1B and the updates of the climate analogues are an urgent task. A new target of long-term surface air temperature under the Paris Agreement is to keep the global average increase in surface air temperature below 2 ºC with respect to preindustrial levels, as well as making efforts to limit the increase to 1.5 ºC with the aim of achieving sustainable development in the world. This new target is lower than the projected global average surface air temperature under the SRES A1B, suggesting that future climates under this target are more similar to those of this study. Climate analogues under this new target may have higher scores than those in this study.
Climate analogue is a primitive approach to impact assessments of climate changes and adaptations against impacts, and therefore useful in their early stage. The non-parametric method used in this study can provide uncertainties in climate analogues as well as the best climate analogue city. Such information about uncertainties is essential for decision-making by policy makers and stake holders.


 nueva página del texto (beta)


