1. Introduction
The Indian summer monsoon season (June-September) is a vast weather event that is crucial to the 1.39 billion people who live in the country. India receives approximately 80% of its rainfall during the summer monsoon months. The amount of rainfall varies from year to year during the Indian summer monsoon season. Several studies have been reported on the deficit and excess of rainfall during the monsoon season over the Indian region (Pal and al-Tabbaa, 2010; Gadgil et al., 2019; Mishra et al., 2020). El Niño and La Niña are opposite phases of the El Niño-Southern Oscillation (ENSO) cycle (Sahu et al., 2022), which is the result of fluctuations in temperature between the ocean and atmosphere in the east-central equatorial Pacific Ocean. El Niño is the warm phase and La Niña is the cold phase of ENSO (Alexander et al., 2014; Guha et al., 2017).
ENSO was identified as an important predictor for the Indian summer monsoon (June to September) in the early 1900s. A clear indication of the weakening of the ENSO and Indian summer monsoon relationship has been observed since the 1970s. A clear restoration between ENSO and the Indian summer monsoon relationship was found in 1999-2000 (Kumar and Kamra, 2012; Yang and Huang, 2022). The two opposite phases (El Niño and La Niña) play an important role during the Indian summer monsoon (Gadgil et al., 2019). ENSO occurs due to changes in sea surface temperature (SST) and wind patterns. The El Niño phase is a climate pattern that describes the unusual warming of surface waters in the eastern tropical Pacific Ocean. The warming of the tropical Pacific Ocean weakens the southeast trade winds flowing to the Inter-Tropical Convergence Zone over India. These winds are the main driving force for the weakening of the Indian summer monsoon. Hence, El Niño events are associated with a weak monsoon with lower rainfall than the average value. La Niña causes the opposite effect to El Niño, which is responsible for flood monsoons and rainfall above normal values (Gadgil et al., 2019). ENSO is one of the main factors driving lightning and rainfall during the Indian summer monsoon (Kamra and Athira, 2016). The strength of El Niño and La Niña events during the Indian summer monsoon plays an important role in lightning and rainfall (Ahmad and Ghosh, 2017; Guha et al., 2017; Tinmaker et al., 2017). Williams (1992) reported that the lightning flash rate varies with surface temperature; in particular, the interannual flash rate increases with the warm phase of ENSO. Guha et al. (2017) reported a 56% increase in the flash count in 2010 with respect to 2009 in northeast India. Their study revealed that the rapid transition during the middle of the year of El Niño (2009) into the early months of the next La Niña year (2010) is due to the modification in various local meteorological and cloud microphysical parameters that helped to increase the flash count in year 2010. Saha et al. (2017) found that the increase/decrease in the lightning flash count is due to an increase/decrease in convection during El Niño/La Niña, which has a direct relation with the warming (cooling) of the atmosphere to change the patterns of regional climate over South/Southeast Asia. Ahmad and Ghosh (2017) reported that during the El Niño years (2004-2005 and 2009-2010) the total flash count increased by 10 and 18%, whereas during the La Niña years (2010-2011 and 2011-2012) the total flash count decreased by 19 and 28%, respectively over the Indian region. The Indian Ocean Dipole (IOD) also plays an important role in the teleconnection between the Indian summer monsoon and El Nino Southern Oscillation (ENSO). The year-to-year variation in the Indian summer monsoon rainfall is considered to be related to the tropical Indian Ocean associated with the IOD (Behera and Ratnam, 2018; Cherchi et al., 2021).
The intensity and frequency of lightning and the severity of tropical thunderstorm clouds are closely related to deep convection. The supply of heat and moisture in the lower atmosphere with changes in atmospheric circulations are strongly linked to the El Niño and La Niña events during the Indian summer monsoon season (Subrahmanyam and Wang, 2011; Saha et al., 2017; Tinmaker et al., 2017). The maximum land surface temperature is a good indicator of energy partitioning at the land surface and atmosphere boundary (Parasnis and Goyal, 1990). It also provides energy distribution into sensible heat and latent heat flux, thus contributing to the most important parameters in the physical process, such as total heat flux (Chate et al., 2017; Li et al., 2020a). Total heat flux (sensible heat flux + latent heat flux) plays a vital role during El Niño/La Niña years with high/low lightning activity (Chate et al., 2017; Tinmaker et al., 2017, 2021a). The surface maximum temperature, which depends upon the amount of radiant energy, is converted into sensible heat flux, which plays an important role in triggering the deep convection for the formation of thunderstorm clouds during El Niño events (Tinmaker et al., 2021a). On the contrary, the low insolation with shallow convection plays an important role during La Niña events (Tinmaker et al., 2021b). The Bowen ratio (ratio of sensible heat flux to latent heat flux) indicates the available energy flux, hence it is important in determining the microclimate and regional climate (Chate et al., 2017; Tinmaker et al., 2017, 2021a, b). The Bowen ratio plays an important role in the energy circulation in the atmosphere by the transportation of momentum, heat flux, and moisture from the boundary layer to the free atmosphere. The vertical transport of momentum, heat flux, and moisture helps in the development of convective clouds (Zheng, 2019). The high/low values of the Bowen ratio are strongly related to El Niño/La Niña during the Indian summer monsoon season (Tinmaker et al., 2017, 2021a, b). The aerosol optical depth (AOD) is one of the most important parameters related to aerosols, which describes the extinction of light over the vertical column of the atmosphere and is directly related to the aerosol climate forcing (Devara et al., 2019). The aerosols in the atmosphere are emitted from both natural (dust particles, volcanic ash, sea salt) and anthropogenic sources (fossil fuel, black carbon, biomass burning). Aerosols play an important role in episodic events through atmospheric warming/cooling, which may lead to droughts/floods over the Indian region (Lau et al., 2009; Manoj et al., 2012; Devara et al., 2019).
The phases and strengths of El Niño and La Niña phenomena are linked to the Niño 3.4 index, which typically uses a five-month running mean, and El Niño or La Niña are defined when the SSTs exceed by ±0.4 ºC for a period of six months or more (Tinmaker et al., 2017). The tropical disturbances formed over the Indian seas (Bay of Bengal [BoB] and Arabian Sea [AS]) are known as low-pressure systems (LPS). The deep convection and LPS develop in the tropics when SSTs cross 28 ºC during the monsoon season (Jaswal et al., 2012; Tinmaker et al., 2014; Praveen et al., 2015). They contribute significantly to monsoon rainfall patterns in India (Krishnamurthy and Ajayamohan, 2010). These synoptic-scale tropical disturbances forming periodically in the quasi-stationary monsoon trough during the Indian summer monsoon from June to September (JJAS) are considered to be the main rain-bearing systems that produce more rainfall (Tinmaker et al., 2014). During the Indian summer monsoon season, a break in monsoon (dry period) occurs, and it is defined as a standardized rainfall anomaly over central India which is seen to be less than -0.5 mm for at least four consecutive days (Rajeevan et al., 2010). The break monsoon over the rest of India has positive anomalies of rainfall over the foothills of the Himalayan and southeastern peninsula (Rajeevan et al., 2010; Pai et al., 2016; Rao et al., 2016). Mandke et al. (2007) studied the active/break days by analyzing precipitation anomalies over the area of CI, which is considered an Indian core region for summer monsoon. The contrast in differential land-ocean heating triggers the monsoon development (Chate et al., 2017; Tinmaker et al., 2017). The main objective of the present research is to study the lightning-rainfall relationship and its association with different weather parameters during El Niño (drought) and La Niña (flood) events in the Indian summer monsoon for the study period 1998-2014 over central India.
2. Study region, data and methodology
2.1 Study region
Central India (CI) (21º-25º N, 73º-80º E) represents the monsoon core region (Mandke et al., 2007). The CI region is shown in Figure 1. The frequency of extreme rainfall events (daily rainfall ≥ 150 mm) over CI has increased by about 75% during the period 1950-2015 (Roxy et al., 2017). The variability of rainfall is thus characterized by “active” periods with high rainfall over CI for monsoon troughs over northern plains and “break” periods with weak or no rainfall over CI with high rainfall over northern India and monsoon troughs over the foothills of the Himalaya (Abhilash et al., 2014). Low-pressure systems are responsible for up to 60% of the summer monsoon rainfall over CI (Praveen et al., 2015; Sørland and Sorteberg, 2016) while producing around 40% of the summer monsoon rainfall over the country (Hunt and Fletcher, 2019). Much of the monsoon rainfall over CI stays associated with LPS developing over the north Bay of Bengal and moving onto the subcontinent along a west-north-westerly track (Sørland and Sorteberg, 2016; Guha et al., 2017; Patwardhan et al., 2020).
Figure 2 shows the yearly variation of the number of monsoon break days and a number of low-pressure systems that occurred during the Indian summer monsoon in the course of the study period (1998-2014). It is seen from the overall study that the increase in the number of monsoon break days and decrease in the number of low-pressure systems plays an important role during El Niño years with high lightning activity and low rainfall, indicating the drought years during the Indian summer monsoon (Mandke et al., 2007; Tinmaker et al., 2014; Pai et al., 2016). The increase in the number of LPS and decrease in the number of monsoon break days that occurred in La Niña years with low lightning activity and excess rainfall denotes the flood years during the Indian summer monsoon over central India (Tinmaker et al., 2014; Praveen et al., 2015).
2.2 Data and methodology
The Lightning Imaging Sensor (LIS) is a satellite-borne instrument that detects lightning flashes over the Earth’s surface (Christian et al., 1999; Bond et al., 2002). It is deployed onboard the Tropical Rainfall Measuring Mission (TRMM) satellite as part of the National Aeronautics and Space Administration’s (NASA) Earth Observing System (EOS). The LIS is designed with higher sensitivity and spatial accuracy than the optical transient detector (OTD). It detects lightning flashes with storm-scale (spatial) resolution (4 to 7 km) over a large region (600 × 600 km) of the Earth’s surface. The TRMM satellite was launched on November 28, 1997, reaching an altitude of 350 km. After August 2021, it was boosted from an average altitude of about 350 km to 400 km. The higher altitude gives a correspondingly larger field of view for each sensor pixel and the swath. Also, the LIS detection threshold settings remained unchanged after the boost to a higher altitude, which increased the total flash counts but not the flash rates (Cecil et al., 2014). The inclination of the orbit is 35º, which allows the LIS to observe lightning activity in the tropical regions of the globe with a detection efficiency of 90% and a negligible regional bias (Boccippio et al., 2000) for the flash count with a detection efficiency of 93 ± 4 and 73 ± 11% during night and day, respectively. The monthly mean lightning flash count grid data (0.5º × 0.5º) during the Indian monsoon season (June 1 to September 30) for a 17-year period (1998-2014) over CI were retrieved from the LIS-TRMM satellite data (Tinmaker et al. 2014, 2022; Chate et al., 2017). The monthly mean rainfall data over CI for the study period was obtained from the Indian Institute of Tropical Meteorology (IITM). The monthly mean SST data for the AS (8º-20º N, 68º-80º E) and the BoB (8º-20º N, 80º-98º E) for the study period were extracted from the Climatic Data Center of the National Oceanic and Atmospheric Administration (NOAA). The mean surface maximum temperature data over CI for the study period were retrieved from NOAA’s archives. The monthly mean aerosol optical depth (AOD) at 550 nm (over 0.5º × 0.5º) for the period 2000-2014 and the monthly mean total heat flux (sensible heat flux and latent heat flux) for the study period (1998-2014) over CI were retrieved from the Moderate Resolution Imaging Spectroradiometer (MODIS) onboard the Terra satellite. The Bowen ratio was calculated from the retrieved fluxes. The LPS and the number of break days were obtained from daily weather reports of the India Meteorological Department (IMD) for the study period. Data for the Niño 3.4 index for the study period was retrieved from the Climate Prediction Center (NOAA). The Niño 3.4 index identifies the ENSO warm and La Niña cold episodes, which are a three-month running mean of SST anomalies in the Niño 3.4 region (5º N-5º S, 120º-170º W). The warm and cold episodes based on a threshold of ±0.5º C for the Niño 3.4 index were obtained from the National Weather Service for Climate Prediction Centers for the study period. In the present study, the El Niño years (2002, 2004, 2006, 2009, and 2014), La Niña years (1998, 1999, 2007, 2010, and 2011), and normal years (2000, 2001, 2003, 2005, 2008, 2012, 2013) were retrieved from studies by Gouda et al. (2017) and Kutta et al. (2018). The total number of break days and LPS that occurred during the monsoon season for the period 1998-2014 over CI is shown in Figure 2.
To evaluate the dependence of lightning-rainfall in El Niño and La Niña events and its association with different meteorological parameters during the Indian summer monsoon season over CI, the Pearson correlation coefficient (given below) has been calculated.
The Pearson correlation coefficient between two variables (series) x and y, usually denoted by r(x, y) or r, is a numerical measure of a linear relationship between them. The Pearson correlation coefficient is given as if (x i , y i ), i = 1, 2, 3…n are n pairs of observation on variable x and y, where x̅ and y̅ are the mean of x and y. Then, the Pearson’s coefficient between x and y, denoted by r, is defined as the ratio:
The value of r always lies between +1 and -1. When values of r > 0 (positive correlation), as the value of one variable increases, so does the value of the other variable, whereas in values of r < 0 (negative correlation), when the value of one variable increases the other variable decreases. When the values of r are between -0.1 to -0.3, -0.3 to -0.5 and -0.5 to -1.0, they indicate weak, moderate, and strong negative correlation coefficients, respectively. On the other hand, when the values of r lie between 0.1 to 0.3, 0.3 to 0.5, and 0.5 to 1.0, they refer to weak, moderate, and strong positive correlation coefficients, respectively.
The hypothesis for Pearson’s correlation coefficient is to examine whether or not a correlation exists between two variables. To solve this uncertainty of the results for two variables, a t-test is carried out, which is given below:
In the t-test formula, x̅ 1 and x̅ 2 are the means of the two variables being compared, µ1 and µ2 hypothesize the difference between the population of variables, σ 1 and σ 2 are the standard deviations of the two variables, and n 1 and n 2 are the number of observations.
3. Results
Figure 3a-c describes the mean value of flash counts, rainfall, Bowen ratio, surface maximum temperature, AOD, SST, and Niño 3.4 index during El Niño, La Niña and normal years over CI during the Indian summer monsoon (June-September) for the study period (1998-2014). The increase/decrease percentage of lightning and rainfall and their association with different weather parameters during the El Niño and La Niña years with respect to normal years during the Indian summer monsoon over CI is shown in Table I. It can be seen from Figure 3a-c and Table I that the flash count, Bowen ratio, surface maximum temperature, total heat flux, AOD, SST, and Niño 3.4 index are increased by 36, 62, 19, 12, 46, 4.7%, and 0.30 ºC (warmer), whereas the rainfall is decreased by 15% during El Niño years with respect to normal years. The flash count, Bowen ratio, surface maximum temperature, and AOD are found to be decreased by 15, 11, 3.5, and 11.1% during La Niña years, whereas the rainfall, total heat flux, SST, and Niño 3.4 index are found to be increased by 2.4, 1.72, 0.36%, and -0.68 ºC (cooler) during La Niña years with respect to normal years. The major finding of the obtained results during the study period is described in the following subsection.
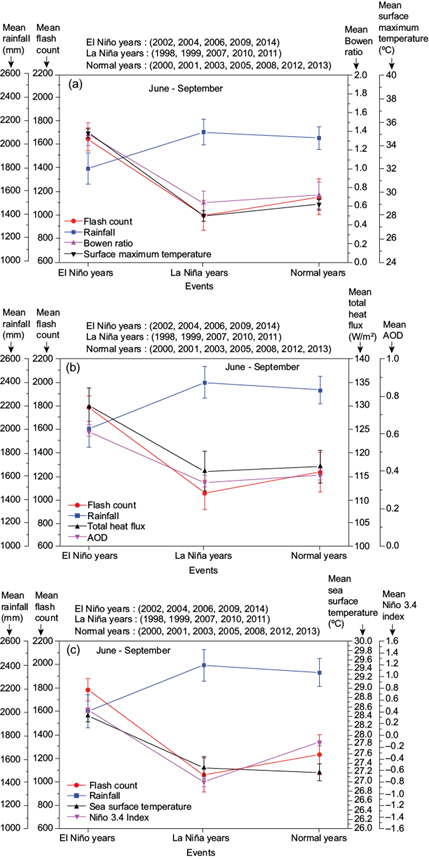
Fig. 3 Variation of the mean value of parameters: (a) flash count, rainfall, Bowen ratio, and surface maximum temperature, (b) flash count, rainfall, AOD, and total heat flux, and (c) flash count, rainfall, SST, and Niño 3.4 Index] during the El Niño, La Niña and Normal years during the Indian summer monsoon season in the course of the study period (1998-2014) over CI.
Table I Percentage increase/decrease of flash count and rainfall with different weather parameters during El Niño years and La Niña years with respect to normal years during the Indian summer monsoon season (June-September) for the study period (1998-2014) over CI.
| Parameters | El Niño years | La Niña years |
| Flash count | 36% increase with respect to normal years | 15% decrease with respect to normal years |
| Rainfall | 15% decrease with respect to normal years | 2.4 increase with respect to normal years |
| Bowen ratio | 62% increase with respect to normal years | 11% decrease with respect to normal years |
| Surface maximum temperature | 19% increase with respect to normal years | 3.5% decrease with respect to normal years |
| Total heat flux | 12% increase with respect to normal years | 1.72% increase with respect to normal years |
| AOD | 46% increase with respect to normal years | 11.1% decrease with respect to normal years |
| SST | 4.7% increase with respect to normal years | 0.36% increase with respect to normal years |
| Niño 3.4 index | 0.30 ºC (warmer) with respect to normal years | -0.68 ºC (cooler) with respect to normal years |
3.1 Lightning-rainfall relationship and its association with different weather parameters during the El Niño and La Niña events during the Indian summer monsoon over central India
The lightning-rainfall relationship and its association with different weather parameters play an important role during the El Niño and La Niña events during the Indian summer monsoon over CI. The strength of El Niño/La Niña events indicates the drought/flood situation through the weakening/strengthening of the monsoon rainfall occurring during the Indian summer monsoon over CI for the study period (1998-2014). Figure 4 shows the annual mean flash count, rainfall, Bowen ratio, and surface maximum temperature over CI for the study period. It can be seen from Figure 4 that the flash count, Bowen ratio, and surface maximum temperature are found to be higher during El Niño years as compared to La Niña years. The rainfall is found to decrease/increase during El Niño/La Niña years, whereas the flash count, Bowen ratio, and surface maximum temperature decrease during La Niña years. The high Bowen ratio during El Niño years is mainly due to the high sensible heat flux, which is the major source of heat energy delivered to the atmosphere (Dalal et al., 2012; Tyagi et al., 2014; Tyagi and Satyanarayana, 2015). During El Niño years, the increase in the number of monsoon break days with an increase in surface maximum temperature and the high Bowen ratio correspond to stronger sensible heat flux and a high lifting condensation level (LCL), which produces more buoyancy, leading to boundary layer growth and instability in the atmosphere. This is essential for the development of thunderstorm clouds with high lightning activity and less rainfall during the El Niño years, i.e., drought monsoon years (Parasnis and Goyal, 1990; Balaji et al., 2017; Thomas et al., 2018; Chen et al., 2019; Shi et al., 2019; Li et al., 2020b; Liu et al., 2020; Tinmaker et al., 2022; Sahu and Tyagi, 2022).
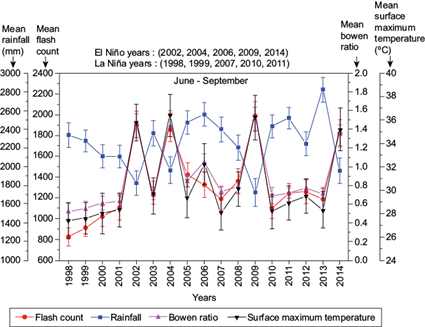
Fig. 4 Annual variation of mean rainfall, flash count, Bowen ratio, and surface maximum temperature during the Indian summer monsoon season in the course of the study period (1998-2014) over CI.
Praveen et al. (2015) found that the rainfall linked to LPS accounts for 60% of monsoonal precipitation during the La Niña years. The low Bowen ratio (less than 1) with a decrease in sensible heat flux and an increase in latent heat flux, low surface maximum temperature, moderate updraft speed, shallow convection, an increase in the number of LPS, less ice and graupel particle formation in the mixed phase region, a slow charging mechanism, and low cloud electrification, lead to less lightning activity with high rainfall during La Niña years, i.e., flood monsoon years (Virts and Houze, 2016; Guha et al., 2017; Morwal et al., 2017; Tinmaker et al., 2021a, b, 2022). The statistical analysis shows that the correlation coefficients of flash counts with Bowen ratio are 0.90618 and -0.72291 during El Niño and La Niña years, respectively, whereas flash counts and surface maximum temperature are 0.832 and -0.86007, respectively, in the same time period. Correlation coefficients between rainfall and Bowen ratio are -0.81312 and -0.8737, whereas they are -0.8763 and -0.86485 between rainfall and surface maximum temperature in El Niño and La Niña years, respectively, during the study period, being significant at 0.05% level, as shown in Figure 5a-d.
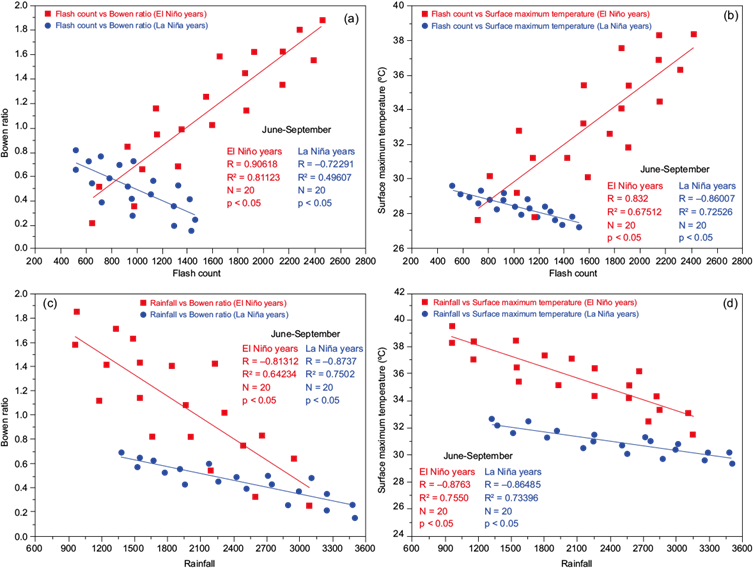
Fig. 5 Correlation coefficient between (a) flash count and Bowen Ratio, (b) flash count and surface maximum temperature, (c) rainfall and Bowen ratio, and (d) rainfall and maximum surface temperature for El Niño and La Niña years during the Indian summer monsoon season in the course of the study period (1998-2014) over CI.
Figure 6 shows the annual mean rainfall, flash count, AOD, and total heat flux during the monsoon season for the study period (1998-2014) over CI. Total heat flux plays an important role in converting convective available potential energy (CAPE) into kinetic energy, which accelerates upward with strong updrafts to form deep convective clouds that further help to develop thunderstorm clouds with high lightning activity (Yano et al., 2005; Yuan and Qie, 2005; Chaudhuri, 2008, 2010; Satori et al., 2009; Chaudhuri et al., 2013, 2020; Zheng and Rosenfeld, 2015; Chate et al., 2017; Takahashi et al., 2023). The aerosols that serve as cloud condensation nuclei (CCN) and ice nuclei (IN) can modify the microphysical structure and behavior of convective storms by altering the cloud droplet size distribution (Devara et al., 2019). During El Niño years, this increase affects the initial size distribution of cloud droplets and ice crystals, resulting in the production of more small cloud droplets, which have difficulty forming raindrops due to low collision-coalescence efficiency, thereby inhibiting the warm rain process. These small cloud droplets are transported above the freezing level by a stronger updraft, which increases the supercooled water content in a thunderstorm, significantly enhancing the ice-phase process. The freezing process releases more latent heat to develop convection, allowing more ice particles to participate in the electrification process of collision-coalescence and charge separation, thereby enhancing lightning activity with reduced rainfall during El Niño years (Berdeklis and List, 2001; Yuan et al., 2011; Guo et al. 2016; Shi et al., 2018, 2019; Zhao et al., 2020; Sreenath et al., 2021; Tinmaker et al., 2022).
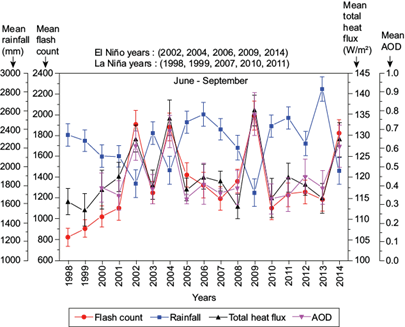
Fig. 6 Annual variation of mean rainfall, flash count, total heat flux, and AOD during the Indian summer monsoon season in the course of the study period (1998-2014) over CI.
During the La Niña years, the increase in total heat flux is due to the increase in latent heat flux and reduction in sensible heat flux. The high water vapor content available in an air column rises upward, and condensation of moisture, with more release of latent energy and convergence of moisture produces high rainfall (Liu et al., 2020; Goswami, 2021). The higher AODs during the monsoon are mainly due to the hygroscopic growth of water-soluble aerosols and the transport of large-size aerosols, such as dust and sea salt particles with favorable wind conditions (Ramachandran and Kedia, 2013). The excess rainfall with low lightning activity during the active phase of the monsoon season in La Niña years is responsible for the aerosol washout, which results in a decrease in aerosol loading of natural and anthropogenic particles (Chate et al., 2003; Rosenfeld et al., 2008; Lau et al., 2009; Srivastava et al., 2011; Tinmaker et al., 2017, 2022; Zhu et al., 2021; Gautam et al., 2022). The statistical analysis shows that the correlation coefficients of flash counts with AOD are 0.81704 and -0.83611 in El Niño and La Niña years, whereas the correlation coefficients between flash count and total heat flux are 0.91333 and -0.73358, respectively, in El Niño and La Niña years during the period of study (1998-2014). The correlation coefficients between rainfall and AOD are -0.69507 and -0.67925 in El Niño and La Niña years, whereas the correlation coefficients between rainfall and total heat flux are -0.8669 and 0.8591, respectively, for El Niño and La Niña years during the period of study, being significant at 0.05% level, as shown in Figure 7a-d.
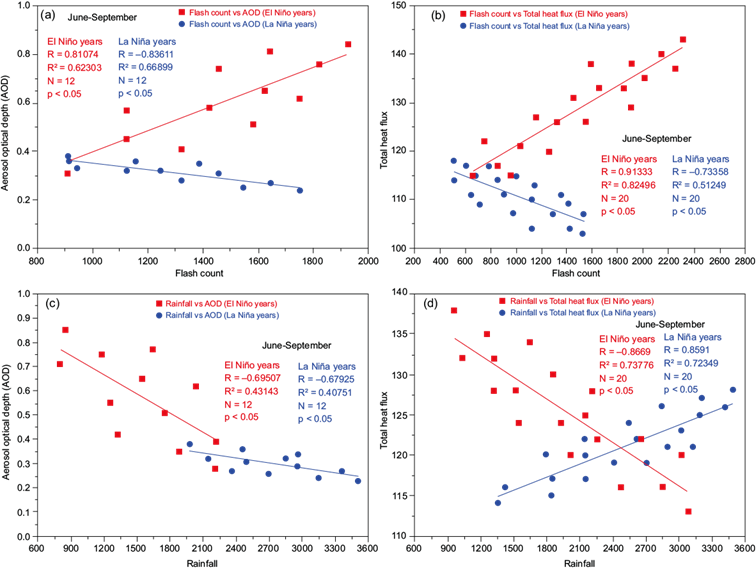
Fig. 7 Correlation coefficient of (a) flash count and AOD, (b) flash count and total heat flux, (c) rainfall and AOD, and (d) rainfall and total heat flux for El Niño and La Niña years during the Indian summer monsoon in the course of the study period (1998-2014) over CI.
Figure 8 shows the annual variation of rainfall, flash count, SST, and Niño3.4 index for the period of 17 years (1998-2014) during the Indian summer monsoon. SST is a crucial parameter that plays an important role in air-sea interaction and has a strong relationship with instability (Kotroni and Lagouvardos, 2016; Tyagi et al., 2022). Zhang (1993) reported that deep convection develops above warm water with sea surface temperatures > 26 ºC. Tropical storms and deep convection have a direct link to the transportation of heat flux, moisture, and momentum in the atmosphere (Williams, 1992; Kandalgaonkar et al., 2010; Tinmaker et al., 2014; Miglietta et al., 2017; Zeng and Zhang, 2020). During an El Niño year, the warmer SST (27.5 ºC) enhances sensible and latent heat fluxes from the sea surface towards the adjacent air mass, increasing the temperature at the lower atmosphere and inducing a steeper environmental lapse rate, which, in combination with cool air aloft (which helps to enhance convection and hence high lightning activity) reduces the amount of rainfall during El Niño years (Kandalgaonkar et al., 2002; Tinmaker et al., 2014; Kotroni and Lagouvardos, 2016). The high positive anomalies of the Niño 3.4 index are strongly associated with El Niño, the warm phase of ENSO characterized by an increase in the average SSTs in the eastern Pacific Ocean and a higher air pressure in the western Pacific Ocean than in the eastern Pacific Ocean (Sreenath et al., 2021). A positive Niño 3.4 index also leads to high lightning activity during the El Niño year of the Indian summer monsoon. The positive value of Niño 3.4 index with an increase in break days and a decrease in LPS during the monsoon season indicates a higher flash count with reduced rainfall during the El Niño year of the Indian summer monsoon over CI (Manohar et al., 1999; Tinmaker et al., 2017, 2021a, b).
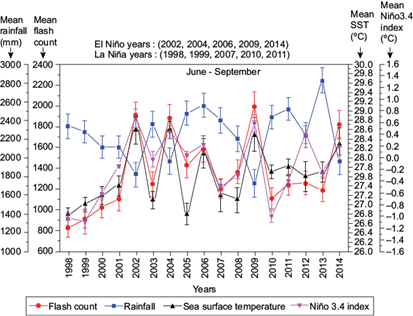
Fig. 8 Annual variation of mean rainfall, flash count, SST, and Niño3.4 Index during the Indian summer monsoon season in the course of the study period (1998-2014) over CI.
The warmer SST and high latent heat flux help to sustain deep and intense convection, which is the major source for the vortex cores seeding the monsoon low-pressure systems (Tinmaker et al., 2014; Praveen et al., 2015; Samanta et al., 2018). During the La Niña year, the increase in the number of LPS, high latent heat flux, and high relative humidity helps the hygroscopic growth of water-soluble aerosols leads to the formation of large cloud coverage in the lower layers of the atmosphere (Ramachandran and Kedia, 2009, 2013). During the active monsoon period, the reduction in sensible heat flux, increase in latent heat flux and high relative humidity, weak updraft speed, low ice particle formation, slow charging mechanism, and low cloud electrification leads to low lightning activity with high rainfall during La Niña years (Rosenfeld et al., 2008; Srivastava et al., 2011; Tinmaker et al., 2014, 2021a, b; Sun et al., 2021). The statistical analysis shows that the correlation coefficients of flash counts with SST are 0.8914 and -0.90223 in El Niño and La Niña years, whereas the correlation coefficients between flash count and Niño 3.4 index are 0.78287 and -0.80179, respectively, in El Niño and La Niña during the period of study (1998-2014). The correlation coefficient between rainfall and SST are -0.7809 and 0.9325 in El Niño and La Niña years, whereas the correlation coefficients between rainfall and Niño 3.4 index are -0.82358 and 0.94423, respectively, for El Niño and La Niña years during the period of study (1998-2014), being significant at 0.05% level as shown in Figure 9a-d.
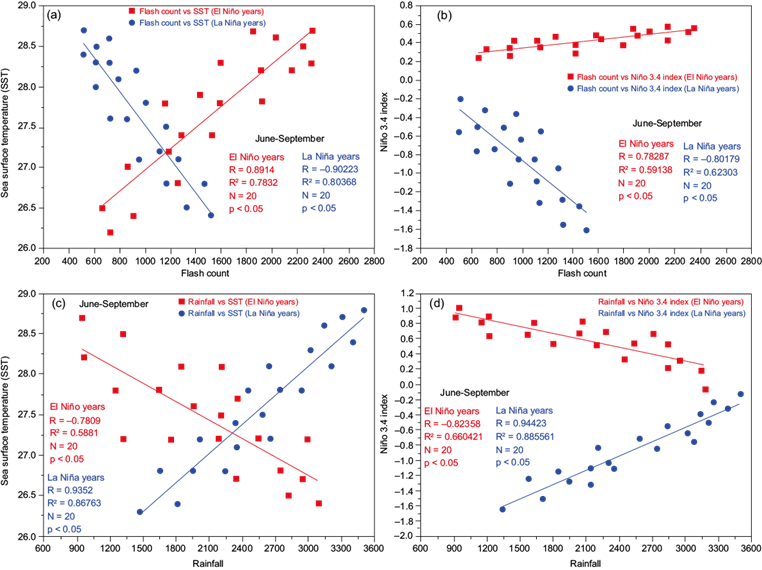
Fig. 9 Correlation coefficient of (a) flash count and SST, (b) flash count and Niño3.4 Index during El Niño and La Niña years, (c) rainfall and SST, and (d) rainfall and Niño3.4 Index for El Niño and La Niña years during the Indian summer monsoon season in the course of the study period (1998-2014) over CI.
4. Discussion
The major significant results described in the earlier section show that the positive correlation coefficients of flash counts with Bowen ratio and maximum surface temperature during El Niño years are due to strong surface heating, high sensible heat flux, high LCL, strong updraft speed, and moisture contents in the lower atmosphere. The high Bowen ratio leads to the development of deep convective clouds with high lightning activity (Tinmaker et al., 2017, 2022). The negative correlation of rainfall with Bowen ratio and surface maximum temperature indicates that during El Niño years, the sensible heat flux increases with an increase in the number of monsoon break days and a decrease in the number of LPS (Tinmaker et al., 2014, 2017). The negative correlation coefficients of flash counts with Bowen ratio and surface maximum temperature and rainfall with Bowen ratio and surface maximum temperature during La Niña years are due to low insolation, low Bowen ratio, low LCL, increase in latent heat flux with decrease in sensible heat flux, decrease in the number of monsoon break days, increase in the number of LPS, high relative humidity, moderate updraft, low formation of ice and graupel particles in the mixed phase region with slow charge separation and low cloud electrification, which leads to low lightning activity with high rainfall during La Niña year over CI (Thomas et al., 2018; Tinmaker et al., 2017, 2021a, b, 2022). The positive correlation coefficients of flash counts with AOD and total heat flux during the El Niño years are mainly due to an increase in the concentration of CCN that enhances cloud amount and suppresses collision/coalescence and rainfall. The smaller cloud droplets get transported above the freezing level with a strong updraft and release more latent heat with deep convection. This favors the formation of ice-graupel particles via a non-inductive charging mechanism, leading to increased cloud electrification that produces high lightning activity during El Niño years. The lightning flash increases on account of the rise in the total heat flux (Chate et al., 2017). The negative correlation coefficients of rainfall with AOD and total heat flux during El Niño years are due to higher AOD results in the production of more small cloud droplets and reduced collision efficiencies, which can delay the formation of raindrops and suppresses the collision-coalescence which leads to a reduction in precipitation. The high concentration of CCN, with a stronger updraft in the mixed phase region, forms more large ice particles. The strong updraft, which leads to the formation of ice crystal and graupel particles due to the non-inductive charging mechanism, enhances cloud electrification with high lightning activity and reduces rainfall during the El Niño year over CI (Lau et al., 2009; Fasullo, 2012; Matsui et al., 2016; Chate et al., 2017; Tinmaker et al., 2022). It is also seen from the obtained result that there is a negative correlation between flash counts with AOD and total heat flux, whereas there is a negative correlation between rainfall with AOD and a positive correlation between rainfall and total heat flux during La Niña years. During the La Niña year, the increase in total heat flux is due to an increase in latent heat flux. The high water vapor content available in an air column is lighter in weight, and with strong buoyancy, it produces stronger upward motion, which condenses more moisture due to latent heat energy. This convergence of moisture produces high rainfall with low lightning activity during the La Niña year (Liu et al., 2020; Goswami, 2021). The positive correlation coefficients of flash counts with SST and Niño3.4 index indicate the development of deep convection and high vertical development of thunderstorm clouds, which leads to higher lightning activity during the El Niño years over CI (Kandalgaonkar et al., 2002, 2010; Tinmaker et al., 2014, 2017). The positive relationship between rainfall and SST, and rainfall and Niño3.4 index during La Niña years is mainly due to an increase in the number of LPS formation, a moderate updraft, low insolation, high relative humidity, and large cloud coverage during the active phase of the monsoon season. These factors lead to an increase in rainfall with low lightning activity during the La Niña years over CI (Trenberth and Shea 2005; Niu and Li, 2012; Tinmaker et al., 2017).
These results show that there is a strong correlation between the lightning-rainfall relationship and its association with different weather parameters during the El Niño years (drought monsoon) and La Niña years (flooding monsoon) in the Indian summer monsoon over central India for the study period (1998-2014). The obtained results support the hypothesis that the impact of El Niño and La Niña plays an important role during the Indian summer monsoon over CI. It also supports the strength of El Niño and La Niña during the Indian summer monsoon, which plays an important role in lightning and rainfall.
5. Conclusion
In the present study, we have discussed the lightning-rainfall relationship in El Niño (drought) and La Niña (flood) events during the Indian summer monsoon over CI for the study period (1998-2014). The main highlights of the present study are given below:
The results show that the flash count, Bowen ratio, surface maximum temperature, total heat flux, AOD, SST, and Niño 3.4 index are increased by 36, 62, 19, 12, 46, 4.7%, and 0.30 ºC (warmer), whereas the rainfall is decreased by 15% during El Niño years with respect to normal years. The flash count, Bowen ratio, surface maximum temperature, and AOD decrease by 15, 11, 3.5, and 11.1% during La Nina years, whereas the rainfall, total heat flux, SST, and Niño 3.4 index increase by 2.4, 1.72, 0.36%, and -0.68 ºC (cooler) during La Niña years with respect to normal years.
The increase in flash count during the El Niño years over CI during the Indian summer monsoon season is due to an increase in surface maximum temperature and a high Bowen ratio. The consequent high sensible heat flux and high LCL lead to deep convection and the formation of high vertical convective clouds, which produce high lightning activity and reduced rainfall. The higher AOD results in the increased production of small cloud droplets, which reduces collision efficiencies. The stronger updraft helps to form large ice particles in the mixed phase region, which enhances cloud electrification and hence high lightning activity with a reduction in rainfall during the El Niño years. However, during the La Niña years, the increase in rainfall during the active phase of the monsoon season is responsible for the aerosol washout, which results in low lightning activity.
The higher SST during the El Niño years enhances the sensible and latent heat fluxes, increasing the lower troposphere’s temperature. The steep environmental lapse rate and cool air aloft result in strong convection and hence high lightning activity during El Niño year over CI. The positive Niño 3.4 index specifies the warmer conditions of the east-central tropical Pacific coastal region for the formation of El Niño events, which strongly impact the Indian summer monsoon by reducing rainfall over CI. During the La Niña years, a decrease in flash counts is due to low insolation, low Bowen ratio, and an increase in latent heat flux with a decrease in sensible heat flux. These factors lead to high rainfall with low lightning activity. The increase in the number of LPS with a decrease in monsoon break days leads to a decrease in flash counts with an increase in rainfall. The negative Niño 3.4 index indicates the cooling of the east-central tropical Pacific coastal region during La Niña events, which shows an increase in rainfall during the Indian summer monsoon over CI.
Data availability
The data for the lightning flash count grid (0.5º × 0.5º) during Indian monsoon season (June 1 to September 30) for the 17-year study period (1998 to 2014) over Central India (CI) were retrieved from the Lightning Imaging Sensor (LIS) onboard the Tropical Rainfall Measuring Mission (TRMM) satellite data website (https://lightning.nsstc.nasa.gov/nlisib/nlissearch.html) (Tinmaker et al. 2014, 2021a, b, 2022; Chate et al., 2017). The monthly mean rainfall data, which is publicly available, were obtained from the Indian Institute of Tropical Meteorology (IITM) website (ftp://www.tropmet.res.in/pub/data/rain/iitm-regionrf.txt) during the study period (1998-2014) over CI. The monthly mean SST data for the AS (8º-20º N, 68º-80º E) and the BoB (8º-20º N, 80º-98º E) for the study period (1998-2014) were extracted from the Climatic Data Center of the National Oceanic and Atmospheric Administration (NOAA) website (https://psl.noaa.gov/cgi-bin/data/timeseries/timeseries1.pl). The mean surface maximum temperature data was retrieved from the NOAA website (https://psl.noaa.gov/data/gridded/data.cpc.globaltemp.html) during the study period (1998-2014) over CI. The monthly mean aerosol optical depth (AOD) at 550 nm (0.5º × 0.5º) for the period 2000-2014 and the monthly mean total heat flux (sensible heat flux and latent heat flux) for the period 1998-2014 were retrieved from the Moderate Resolution Imaging Spectroradiometer (MODIS) Terra satellite website (https://disc.sci.gsfc.nasa.gov/giovanni/) over CI. The Bowen ratio was calculated from the retrieved fluxes. The low-pressure systems (LPS) and the number of break days were obtained from daily weather reports of the India Meteorological Department (IMD) during the study period (1998-2014). The warm and cold episodes based on a threshold of ±0.5 ºC for the Niño 3.4 index were obtained from the National Weather Service for Climate Prediction Centers (https://www.cpc.ncep.noaa.gov/data/indices/) during the study period (1998-2014). The data for El Niño and La Niña years were obtained from the National Weather Service for Climate Prediction Centers (https://ggweather.com/enso/oni.htm) during the study period (1998-2014). In the present study, the El Niño years (2002, 2004, 2006, 2009, and 2014), La Niña years (1998, 1999, 2007, 2010, and 2011), and normal years (2000, 2001, 2003, 2005, 2008, 2012, 2013) were adopted from the studies by Gouda et al. (2017) and Kutta et al. (2018).


 nueva página del texto (beta)


