1. Introduction
In recent years, numerous investigations have been carried out over the world focusing on indoor air pollution since the importance of the lifetime (> 80% of the total) spent by people at home and workplaces in modern urban areas (Baya et al., 2004; Ohura et al., 2009) has increased, especially during the Covid-19 pandemic period. Indeed, the poor air quality of interiors is a source of both acute and chronic health problems; hence, the determination of indoor air chemical composition is crucial to protect public health (Romagnoli et al., 2014). According to the last report of the World Health Statistics published in 2021, nearly 4.3 million deaths per year are caused by indoor pollution (WHO, 2021).
Previous studies scrutinized concentrations of volatile organic compounds (VOCs) in a paint factory, gauging associated health risks. Hazard quotients (HQs) were also established to evaluate potential health impacts. Benzene, n-nonane, trichloroethylene, and tetrachloroethylene surpassed the safe levels throughout the paint production. Additionally, xylene, ethylbenzene, and toluene frequently surpassed the permissible limits, except in specific areas such as the laboratory (Ghobakhloo et al., 2023). Furthermore, several studies emphasized the carcinogenic potential of substances such as benzene and ethylbenzene, notably prevalent in automobile manufacturing settings, including diverse workshops. This conclusion was based on the estimated lifetime cancer risk (LCR) exceeding the set thresholds established by the US-EPA (Khoshakhlagh et al., 2023a). These findings underscore the need for stringent control measures and heightened safety protocols in the factory to mitigate health hazards.
The sensitivity analysis scrutinized essential variables affecting the estimated risks associated with exposure to formaldehyde at work. The concentration of formaldehyde stood out as the primary factor influencing both cancer-related and non-cancer-related risks. Exposure duration and frequency also played significant roles in carcinogenic risk, while exposure time was pivotal for non-cancer-related risk. Body weight showed minimal influence on risk levels. This investigation emphasizes the crucial role of regulating formaldehyde concentrations to minimize health risks for employees who are exposed to it (Khoshakhlagh et al., 2023b).
Among the organic compound families, polycyclic aromatic hydrocarbons (PAHs) represent a significant concern due to their potential carcinogenic and mutagenic effects on human health. PAHs primarily result from incomplete combustion or pyrolysis of organic matter, including petroleum, biomass, wood, coal, and tobacco (Yassaa and Cecinato, 2005; Khedidji et al., 2013). Extensive research has focused on various aspects of PAHs, encompassing their partitioning between gas and particle phases, spatial and temporal patterns, size distribution, and associated health risks (Kim et al., 2013; Cecinato et al., 2014a; Wu et al., 2014; Wei et al., 2015). PAHs occur in the atmosphere as complex mixtures of congeners with different molecular weights. Lighter PAHs (with two-three aromatic rings) predominantly exist in the vapor phase, while higher molecular weight PAHs (four-six rings) tend to adsorb onto particulate matter (PM) (Sarti et al., 2017).
Another class of concern is polychlorobiphenyls (PCBs), which are semi-volatile and primarily exist in the gas phase. Their toxicity, persistence, and potential carcinogenic/mutagenic effects have raised significant apprehension (Yenisoy-Karakaş et al., 2012). Despite substantial research into PAHs and PCBs in outdoor air, studies examining their presence in indoor environments are notably lacking when compared to the extensive literature. In Algeria, while there has been some exploration of PAHs presence in outdoor settled dust, considerable gaps remain, especially concerning suspended particulates (PM10). Moreover, there is a lack of information regarding indoor air quality within factories.
This paper presents the findings of an investigation conducted within an Algerian painting factory, where the materials used in manufacturing processes and their by-products were expected to potentially deteriorate air quality and endanger the workers’ health. The study focused on analyzing n-alkanes, PAHs, and highly polar organic compounds (HPOC), including phthalate esters and heterocyclic compounds containing nitrogen and oxygen. The targeted substances were anticipated to assess the pollution levels within the factory premises and the corresponding exposure of workers to toxicants and elucidate the sources of pollution. Such insights are instrumental in endeavors to enhance air quality. Additionally, this study sheds light on the contributions of manufacturing processes in releasing and dispersing organic contaminants into the air.
2. Experimental
2.1 Sampling site and locations
The National Company of Paintings (ENAP) is an Algerian public company whose core activity is the production of organic coatings, including paints, varnishes, resins, adhesives, and emulsion driers. ENAP is comprised of six manufacturing plants deployed in Oued Smar and Cheraga (Algiers), Lakhdaria, Oran, Sig (Mascara), and Souk-Ahras. The Lakhdaria unit (subject of this study) is considered the biggest in the country, reaching a production capacity of 125 000 t in paintings and 57 000 t in semi-finished products (resins, emulsions, and drying agents). The estate is spread over an area of 8 ha and employs around 340 workers. The ENAP estate is located at about 72 km southeast of Algiers, approximately 5 km outside the city of Lakhdaria (36º 37’ 00’’ N, 03º 35’ 00’’ E) and 45 km west of the Bouira province capital.
The sampling site was situated at an altitude of 203 masl and ~50 m from the National Algerian Highway. Figure 1 provides a view of the ENAP factory with the sampling points across the premises.
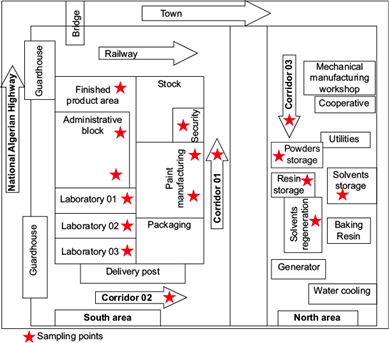
Fig. 1 Map of sampling locations inside the National Company of Paintings (ENAP) estate in Lakhdaria.
Our study consisted of the chemical characterization of gaseous and particulate organics affecting the atmosphere in the ENAP premises. As shown in Table SI in the supplementary material, the five locations were premise interiors, namely: i) laboratory (LABO); ii) workshop of paint production (PROD); iii) corridor of the production workshop (CORR); iv) workshop of stocked raw materials (RAWM), and v) offices (OFFC). Though close to each other, the locations were well physically separated to represent distinct micro-environmental contours where workers used to operate.
2.2 Sample collection
Suspended PM was collected every working day between April and May 2014, except for weekends during which the production process was stopped. The collection was operated at medium volume conditions (flow rate = 1.26 m3 h-1) and restricted to the PM10 fraction (i.e., particles with an aerodynamic diameter less than 10 μm) by using a particle size selective inlet. Samples were enriched onto pure quartz fiber filters. Each collection started at 08:00 LT and lasted 24 h.
Vapor compounds were enriched from air using Analyst-2 type passive sampling cartridges (purchased from Marbaglass, Rome, Italy) that were positioned ~5 m above ground. This kind of diffusive sampler operates at a virtual flow rate of 18.5 mL min-1, quite independently of the PAHs compound (Bertoni et al., 2001). The cartridge exposure lasted five months, starting in October 2014 and ending in February 2015.
After collection, quartz filters and diffusive samplers were sealed in polyethylene boxes, wrapped with aluminum foils, and stored in a freezer at a low temperature (-16 ºC) until chemical processing. Filter and cartridge blanks were co-located in the field with operating collection devices to account for possible contamination during sample handling, preparation, and chemical analysis.
The PM10 concentration in air was determined gravimetrically through weighting filters with a microbalance (Ohaus EX125) with a precision of 10 μg after 48 h conditioning at constant temperature (22 ºC) and humidity (45% RH). Finally, the filters were stored at −20 ºC until chemical processing.
2.3 Analytical procedures
First, chemical characterization of the particulate bound fraction (PBF) was performed using a protocol extensively described elsewhere (Khedidji et al., 2017a; Romagnoli et al., 2019; Gheriani et al., 2022). Briefly, prior to the solvent extraction filters were fortified with a mixture of internal standards; they were: for n-alkanes, perdeuterated tetradecane (C14D30), hexadecane (C16D34), eicosane (C20D42), tetracosane (C24D50), and triacontane (C30D62); for PAHs, acenaphthene-D10, phenanthrene-D10, fluoranthene-D10, benz[a]anthracene-D12, benzo[a]pyrene-D12, dibenz[a,h]anthracene-D14, and dibenzo[a,i]pyrene-D14; for HPOCs, nicotine-D4, cocaine-D3, caffeine-13C3, di-n-propylphthalate DPrPE, and dicyclohexylphthalate DcHxPr. These compounds were added at known concentrations to samples before extraction and analysis to help assess the efficiency of the extraction and analysis processes. By comparing the amount of added standards to the amount recovered, analysts can determine the analytical recovery efficiency; they are added at a constant concentration to both calibration standards and samples. The ratio of the analyte’s signal to the internal standard’s signal is used to calculate the concentration of the analyte in the sample.
As for the sample treatment, the organic fraction was recovered by means of an accelerated solvent extractor (ASE-150, Dionex, Thermo Scientific, Rodano MI, Italy) using a mixture of acetone, n-hexane, and toluene (60:30:10 in volume; 10 mL, four times, 18 min each) as solvent. Neutral alumina (for column chromatography, 3.0 g, partly deactivated with 2.5% of water [Carlo Erba Reagenti, Rodano MI, Italy]) was employed to clean up and fractionate the sample extracts. For this purpose, the extracts were reduced close to dryness at room temperature under a gentle flow of nitrogen, transferred to the top of the alumina column, and eluted by means of trimethylpentane (TMP, 10 mL), TMP/dichloromethane (80:20, 10 mL) and dichloromethane/acetone (50:50, 12 mL), in sequence. Three fractions of raising polarity were collected, the first one containing n-alkanes and non-polar aliphatic hydrocarbons, the second including PAHs, and the third one HPOCs. The three eluates were reduced to dryness and back dissolved with toluene (the 2nd fraction) or chloroform.
The procedure adopted for the gaseous bound fraction (GBF) followed the protocol established by Bertoni et al. (2001). Each sample (i.e., the adsorbing graphitized carbon lodged in the diffusive cartridge) was transferred into a borosilicate vessel, fortified with a mixture of internal standards containing naphthalene-D8, 2-methylnaphthalene-D8, fluorene-D10, phenanthrene-D10, anthracene-D10, pyrene-D10, and chrysene-D12, and finally extracted with toluene (2 mL).
Instrumental analyses were carried out by means of a Trace GC Ultra gas chromatograph equipped with an AS-2000 auto-sampler and coupled with a Trace DSQ quadrupole mass spectrometer (Thermo, Rodano MI, Italy). Chemical determinations were performed by using a DB5-MS type column (L = 30 m, i.d. = 250 µm, film thickness = 0.25 µm [CPS Analytica, Milan, Italy]).
Distinct oven temperature programs were applied for GC analyses, namely (a) for PAHs, n-alkanes, and PCBs fractions, starting temperature =70 ºC (1.25 min), +20 ºC/min to 200 ºC (2 min), +10 ºC/min up to 280 ºC (10 min), +5 ºC/min to 290 ºC (15 min); and (b) for HPOCs: starting temperature = 70 ºC (1.25 min); +15 ºC min-1 to 175 ºC (2 min), +5 ºC min-1 to 280 ºC (10 min); +5 ºC min-1 up to 285 ºC (18 min). In both cases, helium (0.8 mL min-1) was adopted as carrier gas, and injection was operated in split-less mode (1.2 min).
The mass spectrometer system was run in electron impact, selected ion monitoring mode (ion source energy=70 eV; three or four diagnostic ion traces per analyte), and the GC/MS data were acquired by means of dedicated software (Excalibur, Thermo).
2.4 Quality assurance of the analytical method
Before sample collection, quartz filters were backed in a furnace (450 ºC, 4 h) to remove organic impurities and were stored at 40-50% relative humidity over 48 h, weighted and sealed individually in polyethylene holders until use. The instrument was calibrated, and blanks were analyzed before each sample series to ensure accuracy. Field blanks were treated using the same conditions and procedures as the samples to act as a control against potential contamination. Samples were analyzed in triplicate, and peak areas were normalized to corresponding reference compounds. Perdeuterated congeners spiked into samples just before solvent extraction served as these references. Calibration curves for the targeted compounds were established using eight standard mixture solutions. Each mixture, injected three times for various polarity fractions, covered concentrations ranging from 25 to 0.1 ng μL-1 for each target compound, with a constant internal standard content of 1.0 ng μL-1. The replicates showed relative standard deviations ranging from 4 to 10% for all analytes, meeting set quality criteria. Calibration curves, covering a concentration range of 0.01 to 4.0 ng mL-1, exhibited strong linearity with coefficients of determination (R2) exceeding 0.978, indicating a robust linear relationship between concentration and response. Method sensitivity, expressed as the limit of quantification (LOQ), was determined to be superior to 0.060 ng sample-1 for BaA and 0.427 ng sample-1 for IcdP. These values denote the lowest reliable quantifiable concentrations for these compounds using this analytical method. Overall, this methodology employed stringent calibration, quality control measures, and sensitivity assessments, ensuring precise and reliable quantification of target compounds in the samples.
3. Results and discussion
3.1 PM 10 mass concentrations
Table I shows the mean atmospheric concentrations of PM10 as a whole and those of particulate compounds, namely n-alkanes, PAHs, and polar substances, as well as those of gaseous PCBs and PAHs, observed at the five locations inside the factory. Figure 2 shows the PM10 mass concentration patterns.
Table I Mean suspended particle concentrations (PM10) and component loads at the study locations.
| Site | PROD | LABO | OFFC | CORR | RAWM |
| PM10 (µg m-3) | 46.7 | 55.8 | 42.0 | 58.8 | 95.2 |
| ∑ PAHs (gaseous, ng m-3) | 2 329 | 1 946 | 1 797 | 1 507 | 834 |
| ∑ PAHs (particulate, ng m-3) | 34.7 | 16.3 | 7.0 | 15.4 | 12.8 |
| ∑ alkanes (particulate, ng m-3) | 484 | 477 | 201 | 306 | 114 |
| ∑ HPOC (particulate, ng m-3) | 424 | 185 | 147 | 240 | 156 |
| PCBs (gaseous, ng m-3) | 0.6 | 42.4 | 10.9 | 3.2 | 1.1 |
PROD: workshop of paint production; LABO: laboratory; CORR: corridor of the production workshop; RAWM: workshop of stocked raw materials; OFFC: offices; PAHs: polycyclic aromatic hydrocarbons; HPOC: highly polar organics; PCBs: polychlorobiphenyls.
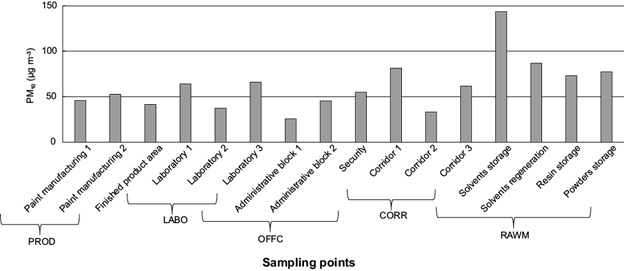
Fig. 2 PM10 concentrations (µg m-3) measured in different micro-environments inside the National Company of Paintings (ENAP).
According to Table I, the mean PM10 concentration reached ~47 µg m-3 in PROD, 56 µg m-3 in LABO, 42 µg m-3 in OFFC, 59 µg m-3 in CORR, and 95 µg m-3 in RAWM. In RAWM, the PM10 rates ranged from 73 to 144 µg m-3, exceeding 2-5 times those recorded elsewhere. The maximum observed at RAWM probably depended on limited air ventilation, on primary materials accumulated there (i.e., fillers, pigments, binders, and solvents used in the manufacture of paints), and on fine particles insoluble in the suspension medium (Can et al., 2015). Among the PM10 concentration rates, only 10 exceeded the limit value of 50 µg m-3 set by the Algerian legislation (PDRA-ED, 2006) and the European normative (EP/EC, 2008).
3.2 Occurrence and composition of particle-bound fraction (PBF)
3.2.1 n-Alkanes
Total n-alkanes (comprised of 21 homologs from tetradecane [C14] to tetratriacontane [C34]) associated with PM10 fraction ranged between 114 (in the raw materials room) and 484 ng m-3 (in the production area). Similar trends were observed at all sampling sites. C21 and C22 were the most abundant homologs during the whole period of investigation, while C14, C15, and C30-C34 were the poorest ones (Fig. 3).
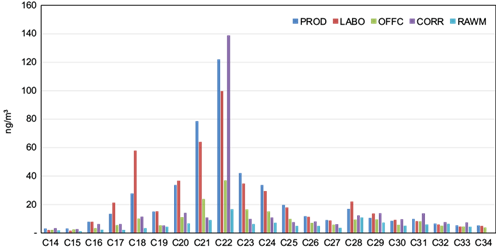
Fig. 3 n -Alkanes distributions in particulate atmospheric deposition collected in different microenvironments in the National Company of Paintings (ENAP) and inside the building (ng m-3).
This pattern was indicative of anthropogenic emissions prevailing vs. natural sources, as confirmed by the values (~1.2) of the n-alkane Carbon Preference Index (CPI), calculated as the sum of the concentrations of odd carbon number alkanes divided by the sum of the even carbon number alkanes concentrations (Alves et al., 2014; Gheriani et al., 2022). The formula we applied was:
3.2.2 Polycyclic aromatic hydrocarbons (PAHs)
The concentrations of 26 PAHs (i.e., parent compounds and methyl-derivatives from phenanthrene to dibenzopyrenes) in the paint manufacturing plant are shown in Figure 4. Total PAHs associated with PM10 ranged from ~7.0 to ~35 ng m-3. An important spatial gradient was observed, with high concentrations in the production room and low concentrations in the office, which was situated in a relatively clean atmosphere. Besides, total PAHs reached 15.4, 12.8, and 16.3 ng m-3 in the corridor, raw materials, and laboratory rooms, respectively. While the raw material and corridor rooms were close to the production area, PAHs exposure inside the laboratory was low; on the other hand, the special profile of PAHs seemed to indicate that this location was affected by peculiar pollution sources; in particular, dibenzopyrenes (DBPs) reached their maximum in the laboratory, while they were almost absent in the office. Indeed, all the paintings, methods, and operations were tested there, which could characterize this microenvironment within the factory.
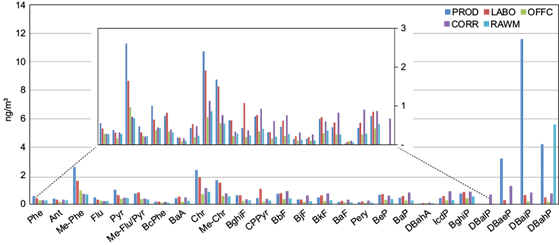
Fig. 4 Distributions of individual PAHs in particulate atmospheric deposition collected in different microenvironments in the National Company of Paintings (ENAP) and inside the building (ng m-3).
To enhance the significance of our findings, we compared the concentrations of PAHs within our paint manufacturing plant with those observed elsewhere in Algeria and all over the world. The levels of PAHs (07-35 ng m-3) in this study were clearly higher than those reported in several Algerian locales, such as the industrial zone of Rouiba-Réghaia (Ladji et al., 2009), industrial sites in Bouira province (Khedidji et al., 2017a), Bourouba city (Rabhi et al., 2018), and the coastal area in Bou Ismaïl (Khedidji et al., 2020), as well as in other locations of the world such as Hamadan city in western Iran (Nadali et al., 2021) and German states (Fromme et al., 2023). They were of the same order of magnitude as those recorded in Ketu, Nigeria (Alani et al., 2021), and Shahryar City in Iran (Kermani et al., 2023). However, they were lower than concentrations documented in the industrial center of Hassi-Messaoud (Yassaa and Cecinato, 2005) and the urban area of Touggourt (Gheriani et al., 2022), the town of Santiago Coachochitlán in the State of Mexico (Valle-Hernández et al., 2021) and Ardabil city in northwestern Iran (Rostami et al., 2019).
Benzo(a)pyrene is often selected as the primary indicator for the entire PAHs group and serves as a marker for overall exposure to suspended particulate carcinogens, consequently reflecting associated health risks. In our study, the average concentration of BaP ranged from 0.26 to 0.83 ng m-3. The BaP average at the indoor site exceeded previously reported averages elsewhere in Algeria, such as industrial sites in Bouira (0.03-0.27 ng m-3) (Khedidji et al., 2017), Bourouba city (0.12-0.42 ng m-3) (Rabhi et al., 2018), and the industrial zone of Rouiba-Réghaia (0.04-0.29 ng m-3) (Ladji et al., 2009). It was also clearly higher compared to those reported at Hamadan city in western Iran (0.001-0.007 ng m-3) (Nadali et al., 2021), German states (0.052-0.065 ng m-3) (Fromme et al., 2023), and Ketu, Nigeria (0.06- 0.08 ng m-3) (Alani et al., 2021). Moreover, levels of BaP in ENAP were lower than those recorded in the urban area of Touggourt (0.83-2.24 ng m-3) (Gheriani et al., 2022) and the town of Santiago Coachochitlán in the State of Mexico (6.5-15.9 ng m-3) (Valle-Hernández et al., 2021).
3.2.3 Highly-polar organic compounds (HPOCs)
The total contents of polar contaminants (comprising five heterocyclic compounds, six phthalate esters, and three nitrogen- and oxygen-containing compounds) ranged from 147 ng m-3 in the office room up to 424 ng m-3 inside the paint production zone, following a trend similar to n-alkanes. Among highly polar compounds, nicotine was predominant in all interiors, particularly in the production room and corridor, where it accounted for 98 and 96%, respectively, of the total of polar substances (Fig. 5). This behavior was influenced by the huge tobacco smoking during work time (more in the production zone and in corridors than elsewhere), and also by the higher temperature indoors compared to outdoors. This occurred despite the concentrations determined in the air, which could be somehow underestimated due to nicotine volatility (Eatough et al., 1989; Morawska and Zhang, 2002).
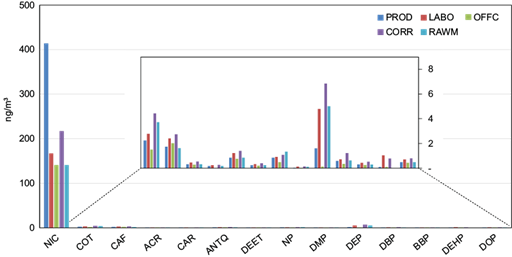
Fig. 5 Distributions of individual polar compounds in particulate atmospheric deposition collected in different microenvironments in the National Company of Paintings (ENAP) and inside the building (ng m-3).
Levels of nicotine in the production area (141- 414 ng m-3) were clearly higher than previously reported in some industrial sites at the Bouira province (9.5-137 ng m-3), the industrial zone of Rouiba-Réghaia (9.4-16.8 ng m-3), San Francisco, USA (0.41-7.2 ng m-3), Birmingham, UK (0.54- 5.9 ng m-3), Msida, Malta (7.6-81.5 ng m-3) (Khedidji et al., 2013; Ladji et al., 2014; Aquilina et al., 2021), and exhibited the same magnitude and variability that was observed in European countries such as Germany (0.03-0.97 μg m-3) and Portugal (0.04-0.56 μg m-3) (Henderson et al., 2023). However, they were lower than those recorded in Barcelona (1.15 μg m-3), Baltimore (1.42 μg m-3), Toronto (2.74 μg m-3), and Romania (11.1 μg m-3) (Torrey et al., 2015; Zhang et al., 2015; Feliu, et al., 2020; Henderson et al., 2023).
The paint production zone was also characterized by much higher concentrations of phthalate esters (PAEs) (10 ng m-3) than those reached in the office (~1.0 ng m-3). Among the six phthalates investigated, diethyl homologue (DEP) was the most important at all times, though it is more volatile than dibutyl and diethylhexyl congeners. Especially in the corridor, concentrations of PAEs could be influenced by additional emission sources like plastics, detergent bases, and aerosol sprays used for cleaning (Tran and Kannan, 2015). It is worth mentioning that PAEs are gaining concern as endocrine disruptors and toxic; besides, their combustion by-products have toxic properties (Gao and Wen, 2016).
3.2.4 Polychlorobiphenyls (PCBs)
PCBs coexist in the atmosphere as vapors and are adsorbed onto atmospheric particles (Gregoris et al., 2014). In this study, PCBs could be investigated only in the vapor phase due to the minimum concentrations (<0.1 ng m-3) reached by these compounds in airborne particulates. Indeed, in ambient air, PCBs exhibited a marked preference for the gaseous phase except for the most chlorinated homologs (> Cl8), and only congeners from Cl3- to Cl6-CBs were detected in this study. Despite the method applied to collect and measure PCBs allowed drawing only semi-quantitative information, large differences between the five locations were found.
The average concentration of gaseous PCBs was ~0.6 ng m-3 in PROD, ~42 ng m-3 in LABO, ~11 ng m-3 in OFFC, ~3.2 ng m-3 in CORR, and ~11 ng m-3 in RAWM. The maximum concentrations were observed in the laboratory, which was roughly 13 and four times more polluted than corridors and offices, respectively.
The results found in this study exceeded those reported in other Algerian cities such as the suburban coastal zone of Bou Ismail (~0.03-0.07 ng m-3), Baraki (0.10-0.15 ng m-3) (Moussaoui et al., 2012) and the industrial cement plant in Sour el Ghozlane (~0.02 ng m-3) (Khedidji et al., 2017b). They were also much higher than in the European cities of Brescia (Colombo et al., 2013) and Madrid (Barbas et al., 2018), but of the same order of magnitude as in the heavily industrialized region of Kocaeli city in Turkey (4.2-6.1 ng m-3) (Cetin et al., 2018).
3.2.5 Gaseous PAHs
Figure 6 shows mean indoor concentrations of individual gaseous PAHs (GBF, expressed in ng m-3) in the five interiors investigated. The sum of non-alkylated and methyl substitute gaseous PAHs reached ~2329 ng m-3 in PROD, ~1946 ng m-3 in LABO, ~1797 ng m-3 in OFFC, ~1507 ng m-3 in CORR, and ~834 ng m-3 in RAWM. Hence, gaseous PAHs were much more abundant than the particulate ones at all locations of the factory premises.
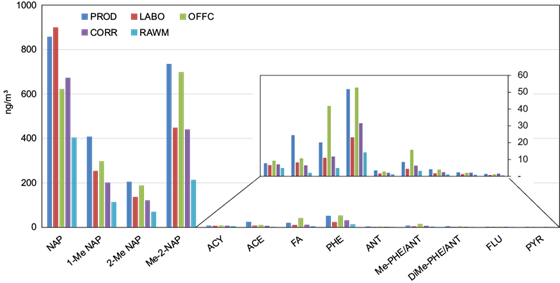
Fig. 6 Distributions of individual PAHs in gaseous atmospheric deposition collected in different microenvironments in the National Company of Paintings (ENAP) and inside the building (ng m-3).
Total PAHs at PROD were significantly higher compared to the other sites. Hence, paint manufacturing was suspected to be an important source of gaseous PAHs because of the use of several solvents, thinners, varnishes, and adhesives in this workshop. Low PAH concentrations were measured in the raw materials workshop, presumably due to the contents of materials used there, which were characterized by particulate rather than by vapors (see section 3.1.). Another interesting finding was that PAHs concentrations measured in the office were higher than in the corridor, in accordance with odors perceived during the delivery of the samples, because the small office room suffered from insufficient ventilation, unlike LABO and COR.
Nap, 1-Me Nap, 2-Me Nap, and Me-2-Nap were the principal PAHs occurring among the 13 ones measured in the gas phase, accounting for 42, 15, 8, and 29% of the total, respectively. Naphthalene and their methylated derivatives are released by primary sources and react with OH radicals and NOx to produce secondary organic aerosols (SOA) (Chen et al., 2016). Further, several studies have simulated the gas-phase chemistry and particle-phase organic aerosol formation starting from naphthalene and alkyl naphthalene emission (Lu et al., 2005; Kautzman et al., 2010; Nishino et al., 2012).
Our study found the volatile Nap with mean concentrations of 691 ng m-3 and a range of 404-900 ng m-3. Similar results were reported in a comprehensive compilation of measurement results performed by German states (Fromme et al., 2023) and Ardabil city in northwestern Iran (Rostami, et al., 2019). However, they were clearly higher than previously reported at the residence area in Algiers (173- 265 ng m-3) (Khedidji et al., 2013) and Hamadan city in western Iran (1.85-40.0 ng m-3) (Nadali et al., 2021).
3.3 PAHs distribution according to aromatic rings
Figure 7 shows the percentage distribution of PAHs according to the aromatic ring number in gaseous and particulate phases. The six-ring congeners accounted for 65% of total PAHs in PROD, 61% in RAWM, and 49% in COR, and were the most abundant species of the particulate phase, followed by four-ring compounds, which accounted for 51% of the total in LABO and 48% in OFFC. On the other hand, the gaseous phase was dominated by two-ring PAHs, ranging from 93% in OFFC to 97% in LABO. Besides, in the gas phase, two-ring PAHs exceeded the three- and four-ring homologs by factors up to 31 and 44, respectively. Instead, when particulate PAH percentage profiles were compared, the six-ring group was, on average, six, five, and four times higher, respectively, than the three-ring group in PROD, RAWM, and CORR. Besides, four-ring PAHs were twice as many as three-ring PAHs.
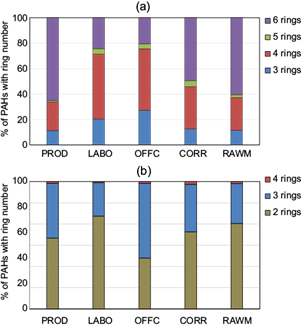
Fig. 7 Benzene ring number distribution of (a) gaseous and (b) particulate phase PAHs measured in five sites located inside the National Company of Paintings (ENAP).
In conclusion, high molecular weight (HMW) PAHs (i.e., the five- and six-rings ones) were relatively rich in the particulate phase, whereas low molecular weight (LMW) PAHs (two rings) were predominant in the gas phase, similarly to the behavior of organic fuel burning (Tobiszewski and Namieśnik, 2012). In particular, four-ring PAHs have been related to coal combustion (Li et al., 2016; Hu et al., 2019). The important concentrations of two-ring PAHs in the gas phase could depend on the high temperature inside the premise, which promoted volatilization vs. adsorption on soot. In addition, the important occurrence of semi-volatile PAHs (four rings) as particulate could depend on the total relative abundance in the air and phase partition (Pandey et al., 2011).
3.4 Diagnostic ratios (DRs) of gaseous and particulate PAHs
The emission percentage profile associated with PAHs sources such as industrial processes, petrol and diesel oil combustion, coal and wood burning (Mostert et al., 2010) depends on the mechanisms leading to PAHs release/formation. For instance, low molecular weight PAHs are usually produced during low-temperature processes. These PAHs are multi-alkylated, and molecules contain fewer aromatic rings than pyrogenic PAHs (Zhang et al., 2008); besides, they can already occur in the fuels. On the other hand, high molecular weight PAHs are released by high-temperature processes, such as fuel engine combustion. In order to determine the major sources of gaseous and particulate PAHs in five locations, we proceeded to calculate the concentration ratios of PAHs pairs (Khedidji et al., 2013, 2020; Balducci et al., 2014; Cecinato et al., 2014b).
Among the diagnostic ratios (DRs) commonly examined for source identification, our concern was focused on the following ones: Phe/(Phe +Ant); Flu/(Flu + Pyr); BaA/(BaA + Chr) BeP/(BeP + BaP); IcdP/(IcdP + BghiP), and alkylate PAHs/parent PAHs (Table II).
Table II Diagnostic ratios calculated for gas and particle phase air samples in this study.
| Ratios* | Phases | PROD | LABO | OFFC | CORR | RAWM |
| Ant/(Phe + Ant) | Particle | 0.41 | 0.43 | 0.37 | 0.53 | 0.51 |
| Gas | 0.06 | 0.07 | 0.05 | 0.06 | 0.08 | |
| Flu/(Flu + Pyr) | Particle | 0.32 | 0.33 | 0.37 | 0.33 | 0.35 |
| Gas | 0.62 | 0.64 | 0.65 | 0.58 | 0.62 | |
| Alkylate PAHs/parent PAHs | Particle (chr/me-chr) | 1.43 | 1.27 | 1.29 | 1.48 | 1.57 |
| Gas (Nap/Me-Nap) | 0.64 | 1.07 | 0.53 | 0.88 | 1.02 | |
| BeP/(BeP + BaP) | Particle | 0.60 | 0.55 | 0.54 | 0.42 | 0.58 |
| Gas | n.d. | n.d. | n.d. | n.d. | n.d. | |
| BaA/(BaA + Chr) | Particle | 0.15 | 0.22 | 0.21 | 0.30 | 0.21 |
| Gas | n.d. | n.d. | n.d. | n.d. | n.d. | |
| IcdP/(BghiP + IcdP) | Particle | 0.37 | 0.40 | 0.38 | 0.51 | 0.35 |
| Gas | n.d. | n.d. | n.d. | n.d. | n.d. |
*For the abbreviations in this column, please refer to the list of compound abbreviations at the end of the main text.
PROD: workshop of paint production; LABO: laboratory; CORR: corridor of the production workshop; RAWM: workshop of stocked raw materials; OFFC: offices; PAHs: polycyclic aromatic hydrocarbons; n.d.: not detected.
According to the DRs rates, no significant differences were found between the five environments investigated inside the premise. The Ant/(Phe + Ant) ratio ranged from 0.05 to 0.08 for the gas phase and from 0.37 to 0.53 for the particulate phase. Distinct values have been documented (rates < 0.1 or > 0.1, respectively) to distinguish petrochemical emissions (e.g. lubricant oils and petrol-derived fuels) from solid fuel exhausts (coal) (Tobiszewski and Namieśnik, 2012).
Furthermore, the parent/alkylated PAHs ratio is considered an index of petrogenic source contribution because alkylated PAHs in petroleum products are more abundant than parent PAHs (Zakaria et al., 2002; Dobbins et al., 2006). The Nap/Me-Nap ratio was calculated for the gas phase and the Chr/Me-Chr ratio for the particulate phase. Values of Nap/Me-Nap calculated at PROD, OFFC, and CORR (0.5-0.9) and, to a lesser extent, those at the laboratory (1.1) and raw material workshop (1.0) put into evidence the contribution of petrogenic sources for gaseous PAHs, while the Chr/Me-Chr ratio (1.0 to 1.6) confirmed that particulate PAHs originated overall from pyrogenic processes.
In the atmosphere, BaP degrades faster than its isomer BeP (Khedidji et al., 2013; Rabhi et al., 2018), and both exist overall as particulates (Liu et al., 2015; Magnusson et al., 2016), so their concentration ratio is an index of particulate emission aging. BeP/(BaP + BeP) ratio values are ~0.5 in fresh emissions (Ladji et al., 2014). This situation occurred all the time through the paint premise, where the ratio ranged from 0.42 to 0.60.
According to the set of PAHs DRs proposed by Kavouras et al. (1998), the DRs analysis was conducted on the basis of Flu/(Flu + Pyr), BaA/(BaA + Chr), BeP/(BeP + BaP) and IcdP/(IcdP + BghiP) ratios, to compare the non-smoking and tobacco smoking zones inside the factory. Particulate PAHs found in interiors appeared to originate mostly from tobacco smoking. In fact, the Flu/(Flu + Pyr) ratio ranged from 0.32 to 0.37 and was similar to 0.34 determined in cigarette smoke (Table II); similarly, the BaA/(BaA + Chr) ratio ranged from 0.15 to 0.30 (0.19 in cigarette smoke). BeP/(BeP + BaP) ranged from 0.42 to 0.60 and IcdP/(IcdP + BghiP) from 0.35 to 0.51, i.e., values very close to 0.64 and 0.34, respectively, consistent with tobacco smoking. These results confirm the results relative to nicotine, which was very rich in the PM10 samples.
3.5 Unveiling sources and correlations of PAHs through principal component analysis
The principal component analysis (PCA) was performed to gain insights into the nature of the PAHs source in both phases and highlight links among compounds. PCA was carried out using IBM’s statistical software SPSS 25.0 and the Varimax rotated factor matrix method with Kaiser normalization, based on the orthogonal rotation criterion maximizing the variance of the squared elements in the column of factors matrix. Variables with similar characteristics were grouped into specific factors, which indicated possible correlations between pollutants (Li et al., 2016).
The results of the PCA (i.e., loading plot of 18 particulate PAHs, 13 gaseous PAHs, and PCBs) are shown in Figure 8. In the loading plot (Fig. 8a), Phe, Me-Phe, Pyr and Flu, Chr, Me-Chr, Me-Flu/Pyr, and BghiF lie at the bottom on the right side, while HMW-PAHs (including BaP, BbjkaF, Pery and IcdP) are located mainly at the top on the left side; hence, LMW- and HMW-PAHs were sequentially separated, confirming the influence of distinct emission sources. However, a handful of PAHs, like CPPyr, Ant, and BghiP showed important differences in the scattering pattern. Two- and three-ring PAHs (2Me-Na, Me-2-Nap, Acy, Phe, Ant, and diMe-Phe/Ant) only belonged to one group (Fig. 8b).
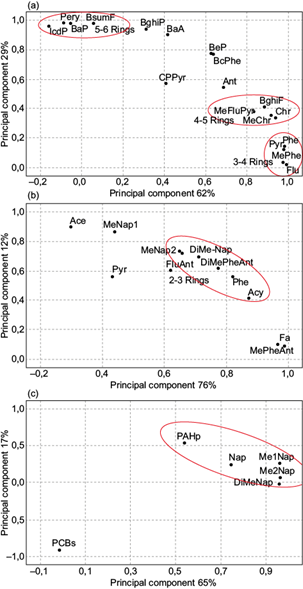
Fig. 8 Principal component analysis as loading plot of (a) 18 particulate PAHs; (b) 13 gaseous PAHs; (c) naphthalene, NAPH methylated derivatives, total particulate PAHs and PCBs, measured inside the National Company of Paintings (ENAP).
Figure 8c shows the loadings plot of naphthalene, its methylated derivatives, total particulate PAHs, and PCBs for each factor extracted by PCA. Naphthalene and methyl derivatives in this score plot are grouped with particulate PAHs, while PCBs are clearly separated. This seems to suggest that an important portion of the particulate PAHs may be a secondary organic aerosol, which is formed by the oxidation of LMW-PAHs (Birgul and Tasdemir, 2015). By contrast, PCBs originated from a distinct emission source.
The factor analysis results are presented in Table III. Two factors were sufficient to explain most of the data variance. Factor 1 could explain up to 62.5 and 76.5% of the total variance for particulate and gaseous PAHs (with strong loading of Phe, Me-Phe, Flu, Pyr, Me-Flu/Pyr, Chr, Me-Chr, BghiF and DBsumP, and 2Me-Nap, Acy, Fa, Phe, Me-Phe/Ant and DiMe-Phe/Ant, respectively). According to Li et al. (2013), Chr, Me-Chr, BkF, and BbF are associated with petroleum combustion, whereas Phe, Flu, and Pyr are related to vehicular emission. On the other hand, Kulkarni and Venkataraman (2000) and Park et al. (2002) reported that Flu and Py also originated from incineration sources, while 2Me-Nap, Acy, and Fa (Table IV) are associated with pyrogenic sources with different combustion temperatures (Liu et al., 2015). Hence, PCA confirms what was reported in section 3.4 regarding the occurrence of pyrogenic emissions in LABO and RAWM.
Table III Factor loadings of particulates PAHs in the PCA analysis.
| PAHs (particles)* | PC component 1 | PC component 2 |
| Phe | 0.979 | 0.141 |
| Ant | 0.685 | 0.545 |
| MePhe | 0.973 | 0.033 |
| Flu | 0.988 | 0.018 |
| Pyr | 0.976 | 0.122 |
| MeFluPyr | 0.833 | 0.381 |
| BcPhe | 0.637 | 0.769 |
| BaA | 0.416 | 0.901 |
| Chr | 0.940 | 0.340 |
| MeChr | 0.915 | 0.355 |
| BghiF | 0.882 | 0.409 |
| CPPyr | 0.407 | 0.571 |
| BsumF | 0.056 | 0.978 |
| Pery | -0.088 | 0.982 |
| BeP | 0.626 | 0.775 |
| BaP | -0.054 | 0.98 |
| DBahA | -0.87 | 0.41 |
| IcdP | -0.159 | 0.96 |
| BghiP | 0.31 | 0.94 |
| DBsumP | 0.81 | -0.103 |
| Initial % of variance | 62.5 | 28.8 |
| Cumulative % | 62.5 | 91.3 |
| Sources | Petroleum, vehicular | Biomass combustion |
*For the abbreviations in this column, please refer to the list of compound abbreviations at the end of the main text.
PAHs: polycyclic aromatic hydrocarbons; PCA: principal component analysis.
Entries in bold indicate high-factor loading.
Table IV Factor loadings of gaseous PAHs in the PCA analysis.
| PAHs (gases)* | PC component 1 | PC component 2 |
| Nap | -0.089 | 0.86 |
| 1-Me Nap | 0.44 | 0.87 |
| 2-Me Nap | 0.65 | 0.74 |
| Me-2-Nap | 0.71 | 0.69 |
| Acy | 0.87 | 0.42 |
| Ace | 0.30 | 0.90 |
| Fa | 0.96 | 0.106 |
| Phe | 0.82 | 0.57 |
| Ant | 0.66 | 0.72 |
| Me-Phe/Ant | 0.99 | 0.096 |
| DiMe-Phe/Ant | 0.77 | 0.62 |
| Flu | 0.62 | 0.61 |
| Pyr | 0.43 | 0.57 |
| Initial % of variance | 76.5 | 12.6 |
| Cumulative % | 76.5 | 89.2 |
| Sources | Pyrogenic | Petroleum combustion |
*For the abbreviations in this column, please refer to the list of compound abbreviations at the end of the main text.
PAHs: polycyclic aromatic hydrocarbons; PCA: principal component analysis.
Entries in bold indicate high-factor loading.
Factor 2 explained 28.8 and 12.6% of the total variance for particulate and gaseous PAHs (with high loading of BaA, BsumF, Pery, BaP, IcdP, and BghiP, and of Nap, 1Me-Nap, 2Me-Nap, Ace, and Ant, respectively).
Previous studies suggested that HMW PAHs, such as BaP, BkF, IcdP and BghiP, are suitable tracers for high-temperature processes such as the burning of gasoline, diesel, and biomass (Thang et al., 2019), while Nap, Ace, and Ant were associated with coal tar/coal combustion (Sofowote et al., 2008). Moreover, Kong et al. (2015) found that NaP was mainly derived from petroleum evaporation.
3.6 Partition of PAHs between particulate and gaseous phases
The concentrations of PAHs from phenanthrene to pyrene were determined both in gas and particle phase in interiors of the ENAP Company (Fig. 9). The sum of these concentrations (∑5 PAHs) in the gas phase ranged from 20 ng m-3 in OFFC to 75 ng m-3 in RAWM, with a mean of 47 ng m-3 (i.e., more than in the particle phase), where they ranged 1.89 (RAWM) to 5.0 ng m-3 (PROD) and reached a mean of 2.85 ng m-3.
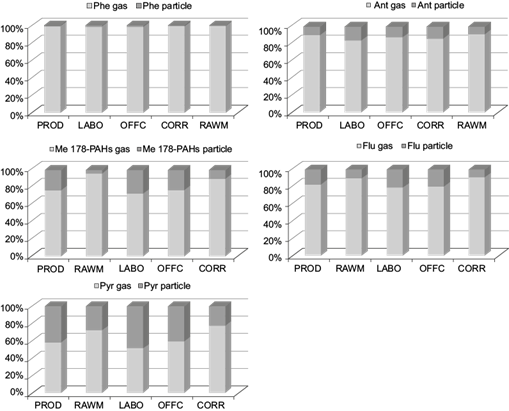
Fig. 9 Concentrations of five PAH compounds in particulate and gaseous phases measured in five interiors of the National Company of Paintings (ENAP).
As shown in Table SII in the supplementary material, phenanthrene (Phe) was found to be the most abundant in the gas phase, while methyl-phenanthrene/anthracene isomers (Me-Phe/Ant) predominated in the particulate phase. The important differences in the composition of gas- and particle-phase PAHs were consistent with the distinct source nature. Indeed, the raw materials workshop was affected by the exhaust release from traffic, while the paint production area was quite rich in particulate PAHs and probably experienced the formation of secondary particulate matter under high temperatures in the presence of oxidants (Ladji et al., 2009).
In comparison with other urban and industrial sites over the world (Table V), PAHs concentrations observed in this study exceeded those measured at a road traffic site in Umea, Sweden (Magnusson et al., 2016); at a ship traffic site in Venice, Italy (Gregoris et al., 2014); at an urban site in Zaragoza, Spain (Callén et al., 2008), and at the background station in Gosan, Korea (Kim et al., 2012). On the other hand, PAH concentrations were lower than those measured during the Olympic Games in Beijing, China (Ma et al., 2011), and at the industrial site of Zonguldak, Turkey (Akyüz and Çabuk, 2010).
Table V Average gas and particulate PAHs (ng m-3) measured in this study and in recent literature data.
| Sampling sites | Lakhdaria, Algeria | Umea, Sweden1 | Venice, Italy2 | Venice, Italy2 | Beijing, China3 | Zonguldak, Turkey4 | Zaragoza, Spain5 | Gosan, Korea6 | |
| Feature | Industry | Road traffic | Ship traffic | Ship traffic | Olympic games | Industry | Urban | Background | |
| Period | 2014-2015 | 2014 | 2012 | 2009 | 2008 | 2007-2008 | 2003-2004 | 2001-2003 | |
| Phe* | G | 39.1 | 1.2 | 0.86 | 1.6 | 43.1 | 106 | 2.2 | 0.55 |
| P | 0.38 | 0.068 | 0.025 | 0.034 | 4.6 | 10.9 | 0.129 | 0.324 | |
| Ant | G | 2.44 | 0.11 | 0.023 | 0.034 | 7.3 | 26.2 | 0.45 | 0.031 |
| P | 0.29 | 0.019 | 0.0025 | 0.003 | 0.5 | 4.6 | n.d. | 0.009 | |
| Me-Phe/ Ant | G | 8.6 | 0.038 | n.e. | n.e. | n.e. | n.e. | 2.17 | n.e. |
| P | 1.48 | 0.01 | n.e. | n.e. | n.e. | n.e. | 0.079 | n.e. | |
| Flu | G | 1.90 | 0.094 | 0.056 | 0.97 | 15.2 | 37.4 | 0.84 | 0.21 |
| P | 0.31 | 0.13 | 0.044 | 0.68 | 12.3 | 31.8 | 0.23 | 0.53 | |
| Pyr | G | 1.18 | 0.073 | 0.05 | 0.65 | 9.9 | 36.1 | 0.82 | 0.207 |
| P | 0.62 | 0.13 | 0.051 | 0.46 | 10.5 | 24.9 | 0.31 | 0.36 | |
*For the abbreviations in this column, please refer to the list of compound abbreviations at the end of the main text.
PAHs: polycyclic aromatic hydrocarbons; G: gas phase; P: particulate phase; n.e.: not examined; n.d.: not detected.
1 Magnusson et al., 2016; 2Gregoris et al., 2014; 3Ma et al., 2011; 4Akyuz et al., 2010; 5Callén et al., 2008; 6Kim et al., 2012.
3.7 Health risk assessment
PM10-associated and gaseous toxicities were estimated by means of the equivalent carcinogenic potency of PAHs (BaPeq), which was calculated by multiplying the mass concentration of each PAH by its corresponding toxic equivalency factor (TEFs); for this purpose, we applied the following formula (Kong et al., 2015):
Usually, the toxicity of ambient PAHs is calculated based only on the particulate phase; despite that, though less carcinogenic, most PAHs are emitted as vapors. After release, they partition between air and soot, changing phase several times (Tasdemir and Esen, 2007) depending on environmental contours.
The BaPeq rates calculated for the five sites are reported in Figure 10a. The maximum corresponded to PROD (19.7 ng m-3) followed by RAWM (6.0 ng m-3) for particulate PAHs, and to PROD and LABO (1.0 ng m-3) for gaseous PAHs.
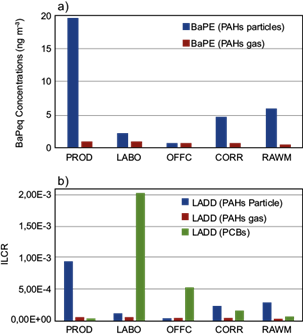
Fig. 10 BaP equivalent (BaPeq) concentrations and incremental lifetime cancer risk (ILCR) measured at the five sites inside the National Company of Paintings (ENAP).
In the factory production area, BaPeq daily values exceeded in both phases the maximum permissible risk level (i.e., 1 ng m-3) set by the World Health Organization (WHO, 2000). Moreover, the particulate phase in the atmosphere of LABO, CORR, and RAWM was more toxic (Fig. 10a) than elsewhere in Algeria (Yassaa et al., 2001; Ladji et al., 2009).
Human health risk can be estimated according to exposure through inhalation (Li et al., 2016). The incremental lifetime cancer risk (ILCR) is indexed through PAHs’ lifetime average daily dose (LADD). The equations used to estimate LADD and ILCR are:
where instead of neat mass concentration of PAHs or PCBs (ng m-3) in PM10 (US-EPA, 2011; Cetin et al., 2018), C represents the sum of individual compounds’ BaPeq (Jamhari et al., 2014); IR is the air inhalation rate (m3 day−1, equal to 20 for adults); ED is the lifetime exposure duration (52 years for adults); EF is the exposure frequency (260 days each year excluding weekends); BW is the body weight (70 kg for adults); ALT is the average lifetime for carcinogens (70 years × 365-day year-1 = 25 550 days); and CSF is the cancer slope factor. In this study, the CSF value for BaP from inhalation is selected as 3.14 (mg kg-1 day-1) (Chen and Liao, 2006).
The average body weight of Algerians by age-specific groups is based on the National Institute of Public Health Survey of September 2010 (INSP, 2010).
The calculated lifetime cancer risks for this study, based on the mean BaPeq and PCB loads, are shown in Figure 10b. ILCR levels of particulate PAHs ranged from 3.6 × 10⁻⁵ to 9.4 × 10⁻⁴, and the maximum was recorded in the production area. ILCRs for gaseous PAHs were lower (i.e., from 2.1 × 10⁻⁵ [at RAWM] to 4.7 × 10⁻⁵ [at PROD]). According to these levels, the daily inhalation dose of particulate PAHs and cancer risk to workers in the study sites exceeded the acceptable limits (10-6 to 10-4 ) established by the US-EPA (2005), which did not occur for gaseous PAHs.
PCBs’ mean exposure levels ranged from 2.9 × 10⁻⁵ at PROD to 2.0 × 10⁻³ at LABO. The mean risk level exceeded 1 × 10⁻³ in the laboratory and 1 × 10⁻⁴ at the office and corridor, indicating a potential health risk associated with PCBs. The types of cancer associated with PCBs exposure are melanoma, liver tumors, gall bladder, biliary tract, gastrointestinal tract, and brain (Cetin et al., 2018). The high exposure and inhalation risk levels calculated in the laboratory can be explained by the strength of PCB sources there.
4. Conclusion
During April-May 2014, the concentrations of n-alkanes, PAHs, PCBs, and highly polar organic compounds were determined at five locations within the ENAP paint manufacturing plant. The daily concentration of PM10 was > 60% higher than the maximum value established by national Algerian and international norms. In particular, the raw material rooms were affected at important extents. Nicotine accounted for over 96% of the total polar substances in the production room and corridor; its abundance inside the plant was indicative of heavy tobacco smoking.
Significant differences in the distribution of PAHs groups were found between the gas and particulate phases. Total gaseous PAHs exceeded particulate PAHs. The two phases were dominated by low molecular weight compounds (LMW, two and three rings) and high molecular weight compounds (HMW, five and six rings), respectively.
According to principal component analysis (PCA) and diagnostic concentration ratios, the principal sources of PAHs were identified as petroleum combustion, vehicular emissions, and cigarette smoke. Particulate PAHs were overall associated with pyrogenic sources, while gaseous PAHs with petrogenic ones. Secondary formation through photochemical reactions of naphthalene contributed to atmospheric particulate occurrence.
Particulate PAHs contributed significantly to the production area’s overall potential health risk for humans. The estimated incremental lifetime cancer risk (ILCR) associated with gaseous PCBs exposure at the laboratory and office (2.0 × 10⁻³ and 5.2 × 10⁻⁴, respectively) was very high compared to the maximum acceptable level (comprised between 10-6 and 10-4).
List of compound abbreviations
(HMW)-PAHs |
high molecular weight PAHs |
(LMW)-PAHs |
low molecular weight PAHs |
1-Me-Nap |
1 methyl-naphthalene |
2-Me-Nap |
2 methyl-naphthalene |
Ace |
acenaphthene |
ACR |
acridine |
Acy |
acenaphthylene |
AHs |
polycyclic aromatic hydrocarbons |
Ant |
anthracene |
ANTQ |
anthraquinone |
BaA |
Benzo(a)anthracene |
BaF |
benzo(a)fluoranthene |
BaP |
benzo(a)pyrene |
BbF |
benzo(b)fluoranthene |
BcPhe |
benzo(c) phenanthrene |
BeP |
benzo(e)pyrene |
BghiF |
benzo(ghi)fluoranthene |
BghiP |
benzo(ghi)pyrene |
BjF |
benzo(j)fluoranthene |
BkF |
benzo(k)fluoranthene |
CAF |
caffeine |
CAR |
carbazole |
Chr |
Chrysene |
COT |
cotinine |
CPPyr |
cyclopent(cd)pyrene |
DBaeP |
dibenzo(a:e)pyrene |
DBahA |
dibenzo(a:h)anthracene |
DBahP |
dibenzo(a:h)pyrene |
DBaiP |
dibenzo(a:i)pyrene |
DBalP |
dibenzo(a:l)pyrene |
DBP |
dibutyl phthalate |
DEET |
N:N-diethyl-meta-toluamide |
DEHP |
di-2-ethylhexyl phthalate |
DEP |
Diethyl phthalate |
DMe 178-PAHs |
dimethyl phenanthrene/anthracenes |
DMe Nap |
dimethylnaphthalenes |
DMP |
dimethyl phthalate |
DMe 178-PAHs |
dimethyl phenanthrene/anthracenes |
DMe Nap |
dimethylnaphthalenes |
DOP |
di(n-octyl) phthalate |
FA |
fluorene |
Flu |
fluoranthene |
HPOCs |
highly-polar organic compounds |
IcdP |
indeno(1:2:3-cd)pyrene |
Me-2-Nap |
methyl-2-naphthalene |
Me-Chr |
methyl-chrysene |
Me-Flu/Pyr |
methyl-fluoranthene/pyrene |
Me-Phe |
methyl-phenanthrene |
Nap |
naphthalene |
NIC |
nicotine |
NP |
nonylphenol |
PAEs |
phthalate esters |
PCBs |
polychlorobiphenyls |
Pery |
perylene |
Phe |
phenanthrene |
Pyr |
pyrene |


 nueva página del texto (beta)


