1. Introduction
The state of Baja California Sur (BCS) (Fig. 1a) is located in the southern half of the Baja peninsula (on average ~250 km wide and ~1000 km long, from 28º to 22.86º N and 115.06º to 109.24º W), in the transition from tropics to subtropics and bounded by the Pacific Ocean to the west and the Gulf of California to the east. The widespread flat terrain is divided in the northwest-southeast direction by the Sierra la Giganta (1176 masl) and the Sierra de la Laguna (2090 masl), shown in Figure 1b. The climate is influenced by the subsidence associated with the North Pacific anticyclone and the cold California current, resulting in a generally arid climate. The average annual temperature ranges from 18 to 22 ºC. The highest average temperature (35 ºC) is observed in July and August, while the lowest (9 ºC) is recorded in January.
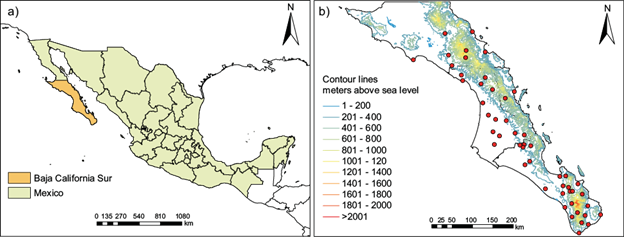
Fig. 1 (a) Location of the State of Baja California Sur in Mexico. (b) Topographic map of Baja California Sur with contour lines in meters above sea level. Red dots correspond to the location of climatological stations.
BCS is affected during the rainy season by moist air masses of tropical systems that develop in the Inter-Tropical Convergence Zone (ITCZ) in the eastern tropical Pacific. Due to the orographic forcing, humid and unstable air masses may lead to moderate and, on occasion, intense precipitation. Maximum accumulated precipitation is recorded yearly during July, August, September, and October, accounting for 70% of the total precipitation. Moreover, intense regional precipitation depends strongly on the occurrence of tropical cyclones (TCs) (Cavazos et al., 2008). Winter months are generally dry with the occasional presence of mid-latitude systems that may lead to stratiform precipitation. Changes in precipitation have been observed in recent years concerning the climate and the implications for water resources, habitats of land and sea flora and fauna, and agriculture. Furthermore, possible impacts on the stability of infrastructure like dams, bridges, inundations, and other constructions have been discussed (Fluixá-Sanmartín et al., 2018).
The variability of rainfall has long been a subject of concern and interest due to its profound implications for water resources, agriculture, and overall environmental sustainability (Larson et al., 2013). BCS’s climate is largely influenced by its geographic location, with the Pacific Ocean to the west and the Gulf of California to the east. Former investigations recognized patterns in precipitation that withstand traditional expectations, presenting challenges for both short-term planning and long-term resilience. The intricate interplay of these factors, coupled with global climate change, has led to a clear trend of increasing minimum and maximum temperatures (Martínez-Austria and Jano-Pérez, 2021). However, seasonal variations and the frequency of extreme weather events have raised questions about the reliability of historical climate data for the predictability of future rainfall.
Climate variability occurs on different time scales. Large-scale modulations are exerted on different regions by decadal- to multidecadal oscillations, via atmospheric teleconnections. A teleconnection is defined as an ocean-atmosphere interaction that occurs at a distant point on Earth and causes persistent and recurring modes of low-frequency climate variability (Kiladis and Díaz, 1989). Teleconnections are one of the most relevant internal causes of variability in the climate system (IPCC, 2007).In the absence of external forcing, climate variability is determined by processes of the internal dynamics of the system, such as ocean-atmosphere interaction, as in the case of climate variability associated with the phenomenon El Niño-Southern Oscillation (ENSO), or with variations in periods of decades such as those associated with the Pacific Decadal Oscillation (PDO) and the Atlantic Multi-decadal Oscillation (AMO) (IPCC, 2007). Some of these teleconnections will be described in the next subsections.
At shorter scales, inter-annual variability occurs when more intense rains (or warmer/colder temperatures) are observed in some years compared to others. There is also variability at smaller time scales within the rainy season-intra-seasonally-corresponding to fluctuations on a monthly scale. Studies have shown how phenomena with different timescales affect local/regional precipitation and temperature in Mexico, e.g., mesoscale convective systems in the Southern Gulf of California, the North American monsoon, or smaller processes such as orographic or convective rainfall.
1.1 Decadal scale variability
The PDO, first reported by Mantua et al. (1997), has been described as a long-term fluctuation in the surface temperature of the Pacific Ocean (Trenberth et al. 1994; Mantua and Hare, 2002). The associated teleconnections in atmospheric geopotential fields modulate temperature and precipitation in vast regions of western North America. In their studies of northwestern Mexico, Englehart and Douglas (2001), 2002) report that the positive phase of the PDO favors precipitation associated with TCs. Although these are high-frequency phenomena (with large interannual variability), the influence of the warm PDO phase is associated with warm sea-surface temperature (SST) anomalies from Baja California to the south and southward of the Equatorial Pacific, favoring the development of TCs. Brito-Castillo et al. (2002) explain that in addition to TCs, rain in northwestern Mexico is influenced by orography and moisture influx from the Pacific Ocean, similar conditions associated with the North American Monsoon, which develops progressively from July to September from south to north and east to west.
Méndez et al. (2010) identified that the PDO is positively correlated with precipitation in Mexico, particularly during the boreal winter, so the positive phase favors rains, while its negative phase favors droughts, especially in the Mexican highlands and northern Mexico. The northwestern region of Mexico is affected by landfalling TCs (Englehart and Douglas, 2001, 2002), which can lead to intense precipitation events. Raga et al. (2013) analyzed 150-year reconstructed records of landfalling TCs to determine that the positive phase of the PDO favored their landfalling.
1.2 Interannual scale variability
ENSO, an ocean-atmospheric phenomenon centered on the equatorial Pacific Ocean, is responsible for substantial interannual variability in the atmosphere. Although it can be considered an oscillatory phenomenon, its period is irregular and linked to medium-term climate variability (Martínez and Fernández, 2004). The warm phase of ENSO, named El Niño, corresponds to warm sea surface temperature anomalies (SSTAs) in the central and eastern equatorial Pacific; the opposite SSTAs correspond to the cold phase, known as La Niña. ENSO causes changes in the general extra-tropical circulation, contributing to meteorological anomalies globally. El Niño is associated during winter, for example, with abundant rainfall in the southeastern United States, the Gulf of Mexico, the Straits of Florida, and western Cuba (Glantz et al., 1991). In northern Mexico, it is associated with anomalously high precipitation in winter, while La Niña tends to correspond with drier winters, which could lead to severe drought (Magaña et al., 2003). Previous research (Zhang et al., 1997; Hare and Mantua, 2000) has reported a larger climatic response when ENSO and PDO are in phase; a good example is the exceptional El Niño in 1997-1998, when changes in atmospheric circulation modified surface temperature anomalies of the Pacific Ocean.
Romero-Vadillo et al. (2007) identified that the percentage of intense hurricanes (categories 4 and 5) and hurricanes with a long lifetime (greater than 12 days) is larger during El Niño years than under neutral conditions. Martínez-Sánchez and Cavazos (2014) indicate that the frequency of category 4 and 5 hurricanes has a significant positive correlation with El Niño and PDO.
1.3 Intra-seasonal scale variability
The Pacific/North American (PNA) pattern is one of the most important sources of intra-seasonal variability in the mid-latitudes of the Northern Hemisphere during winter. It consists of anomalies in the geopotential height (typically at 700 and 500 hPa), observed in the northern Pacific, as well as in the western and eastern USA. One of the centers of this system is in the northern Gulf of Mexico (30º N-85º W), which favors the flow of winds from the subpolar region toward the central USA and the Gulf of Mexico in winter and spring, and is associated with cold temperature anomalies over that region. During the positive phase of ENSO, there is a higher incidence of the PNA pattern, which increases the frequency and intensity of cold fronts in the Gulf of Mexico (White and Downton, 1991).
Tropical cyclones provide a potentially large contribution to mean and extreme precipitation in Baja California. Another very important source of intra-seasonal variability during the rainy season in the eastern tropical Pacific (EPAC) is associated with the Madden-Julian Oscillation (MJO, with a period ~30-60 days) and the quasi-biweekly oscillation (QBWO, period of ~20 days). Jiang et al. (2012) and Zhao et al. (2018) have shown that these oscillations modulate tropical cyclogenesis in the EPAC during the rainy season (May to October). The active phase of the QBWO results in increased tropical cyclogenesis with positive anomalies in mid-level relative humidity and in low-level cyclonic vorticity. In addition, the active phase is associated with a northern shift in the cyclogenetic region, leading to potentially more TCs affecting the Baja peninsula.
The objective of this study is to identify the role of modulations by large-scale synoptic, inter-annual, and decadal oscillations on the observed extreme rainfall in BCS and make projections to 2100 through different statistical models.
2. Datasets and methodology
The historical records of temperature and rainfall data from climatological stations were analyzed, after applying thorough quality control and homogeneity tests to eliminate spurious records.
2.1 Quality control of the database
The BCS climate database has a total of 6 922 927 valid daily records up to 2014, from 161 climatological stations. Of those, only 132 stations were operational by 2015 and an additional 29 have been discontinued since. The oldest and still-operating station (since 1921) is the observatory at Santa Rosalía; the most recently installed station is El Ciruelito in the city of La Paz in 2013. The largest sequence-93 years of continuous records-was observed at the Mulegé station. Station altitudes range from 2 to 1080 masl. Climatological stations report maximum and minimum temperatures (both daily values), and accumulated rain in 24 h.
Quality control was carried out on daily records of the stations using the RClimdex software (ETCCDI, 2020) to correct digitization errors and validate suspicious data compared with neighboring stations. Additionally, a homogenization process was carried out to correct errors related to changes in location, observer, instrumentation, and environment of the station, which resulted in a validated time series that can be confidently used to analyze climate variability. This rigorous quality control process resulted in the selection of a total of 50 climatological stations (out of the original 161) shown as red dots in Fig. 1b.
2.2 Climatological analysis and decadal variability
After quality control, climatologies over several different periods were estimated. Monthly averages were calculated from daily values for each station, and climatological maps were produced over the 30 years 1971-2000. Moreover, five decadal averages were calculated (1961-1970, 1971-1980, 1981-1990, 1991-2000, and 2000-2010) to evaluate variability. Anomalies of the different decades with respect to climatology were estimated. Additionally, climatologies for the tropical cyclone season (July-October) were also estimated.
Extreme precipitation values were determined from the frequency distribution function of daily records with values the 95th percentile during each month. The same methodology was followed to calculate climatological anomalies for the extreme precipitation accumulative value on a monthly scale.
2.3 Cluster analysis
The Ward method (Ward, 1963) for clustering was used to determine regions of similar precipitation and temperature within the state of BCS. This hierarchical method considers the merge of clusters that have the least increase in the sum of squares of the differences between each individual and the cluster’s centroid. Daily normalized precipitation and temperature values over the period 1971-2000 were analyzed from each of the 50 stations to determine separate clustering for each variable, which were then combined to generate a single regional grouping of seven clusters representing similar climates. An additional requirement of at least 85% of information was applied in 1971-2000, decreasing the number of stations to 34.
2.4 Climate indices
Tme series of the PDO, ENSO, and PNA indices were obtained from the websites of official agencies, to correlate them with extreme precipitation. The PDO index is calculated with the principal components method and considers the monthly SSTA over the North Pacific Ocean, from 20º N towards the pole, with data from 1854 to 2021 (PDO, 2023).
The PNA index is obtained from the anomalies in the geopotential height fields (typically at 700 and 500 hPa) observed in the northern Pacific Ocean, as well as in the western and eastern USA; information from 1950 to 2021 was available (PNA, 2023).
Two indices for ENSO are considered: El Niño 3.4 and the Multivariate ENSO Index (MEI). El Niño 3.4 (referred to as ENSO hereafter) is the SSTA averaged over the region between 170º-120ºW and between 5ºS- 5ºN, spanning from 1870 to 2021 (ENSO, 2023). The MEI is calculated as the first principal component without rotating of the six combined observed fields of atmospheric pressure at sea level, zonal and meridional wind, SST, air temperature at sea level, and cloud cover (MEI, 2023).
2.5 Correlation analysis
Monthly data for the PDO, PNA, and ENSO indices were correlated (Spearman) with monthly time series of extreme precipitation at each station. As the MEI index is calculated every two months, the extreme precipitation records were also calculated every two months, to calculate the correlations simultaneously and considering a two-month lag.
The Spearman correlation (a non-parametric test) measures the association between two discrete variables (x and y) and is defined by:
where D is the difference between the corresponding values of x - y, and N is the number of pairs.
For N > 20 an approximation to the t-Student distribution is given by:
Normalization using the mean and standard deviation is one of the most common and efficient methodologies for the analysis of climatological data (Hare and Mantua, 2002). Thus, time series of extreme precipitation are normalized as:
Correlations between extreme precipitation at each station and each climate index were carried out, interpolated, and displayed in maps. The statistical significance of the correlations was estimated through Student’s t-test at a 95% confidence level.
2.6 Statistical models of extreme precipitation
Four statistical linear models (M1 to M4) are proposed to represent the normalized extreme precipitation as a function of the climate indices described.
The first model (M1) includes predictors for decadal (PDO), interannual (MEI), and intraseasonal variability (PNA), as follows:
where the parameters a, b, c, and d were calculated by the least squares method, using the normalized annual accumulated precipitation and the annual average of teleconnections during the period 1950-2005 in each cluster. This model is proposed to evaluate extreme precipitation events during winter, as both ENSO and PNA are known to modulate it predominantly during that season.
A second model (M2), considers the influence of decadal (PDO) and interannual (ENSO) modulations. Given that the largest amount of annual precipitation is concentrated in the TCs season (from July to October), it also includes an additional predictor that represents the proximity of a TC within a radius of 300 km from Los Cabos, as follows:
The TC variable is derived from the HURDAT database, as explained below and parameters a, b, c, and d were calculated by least-squares, using the normalized accumulated precipitation from June to October and the average of teleconnections in the same months during the period 1950-2005 in each cluster.
A third model (M3), includes only the decadal (PDO) and interannual (ENSO) modulations, which can be applicable to project future extremes in precipitation based upon the oceanic conditions projected by CMIP5 models:
where the parameters a, b, and c were calculated by least-squares using the normalized accumulated precipitation from June to October and the average of teleconnections in the same months during the period 1950-2005 in each cluster.
A final model (M4), includes a different predictor for the proximity of TCs, based on the study by Tory et al (2020), who analyzed TC formation in a warmer future from the simulations of twelve CMIP5 models. They determined that a reduction in the number of TCs is expected in the EPAC basin in the medium and long term. Thus, a proximity coefficient associated with the presence of a TC was calculated from the difference between the number of TCs at a radius of 300 km from Los Cabos, Baja California Sur, and the total number of TCs formed in the EPAC basin, as documented by Tory et al (2020). This parameter is called TC-Coef and is directly associated with extreme precipitation events, so M4 is expressed as:
where the parameters a, b, c, and d were calculated by least-squares, using the normalized accumulated precipitation from June to October and the average of teleconnections in the same months during the period 1950-2005 in each cluster.
2.7 HURDAT database
The Hurricane Database (HURDAT) is produced by the US National Hurricane Center for TCs developed in the eastern Pacific from 1949 to 2014 (HURDAT, 2022). The variables include the name of the TC (TCname) and the position (latitude [lat] and longitude [long]) at 6-h intervals to estimate trajectories, central pressure, and maximum winds.
The TC-Coef, mentioned in the previous section, was extracted from the HURDAT database. It consists of a timeline formed by dividing the number of TCs within a 300 km radius of Los Cabos, Baja California Sur, by the total number of TCs formed in the eastern Pacific basin from June to October over the period 1950-2005.
2.8 Climate model output
Daily precipitation time series from the historical simulation (1950-2005) and future projections of an ensemble of climate models were obtained from CMIP5 for the future scenarios RCP4.5 and RCP8.5. The data from the projected time series of precipitation from the ensemble of CMIP5 models were obtained from all grid points in Fig. S1 in the supplementary material (indicated by large red circles) and the data of the nearest grid point was considered for each cluster (CMIP5, 2023).
The projected PDO and ENSO indices were calculated using the SSTA outputs from the ensemble simulations of the CMIP5 models under both scenarios and analyzed for two future horizons: 2006-2040 and 2041-2100. These projected indices were substituted into model M4. Fuentes-Franco (2015) investigated the combined impact of ENSO and PDO on North American winter climate in current and future climate projections from 11 global models in the CMIP5, detailing that for the historical period they are able to reproduce the spatial patterns of the observed teleconnections when ENSO and PDO are in phase and thus interfere constructively, while future climate projections suggest that the interaction between active PDO and ENSO is slightly increased in frequency and intensity.
The time series of extreme precipitation from the statistical model M4, considering future SSTA (which is necessary to calculate future PDO and ENSO indices), are then compared with the projected extreme precipitation from simulations to determine the validity of the statistical model, applied outside the historical period sample (1950-2005).
3. Results
3.1 Regions with similar climates
The cluster analysis allowed to identify seven regions with similar climates shown in Figure 2: Cluster 1 corresponds to western Sierra la Giganta mountains and El Vizcaino; Cluster 2 to northeastern Sierra la Giganta mountains; Cluster 3 to southern Sierra la Giganta mountains and Valley of Santo Domingo; Cluster 4 to the intermountain region; Cluster 5 to northern mountains in the Cape Region; Cluster 6 to southern Cape and Cluster 7 to Sierra la Laguna mountains. Table SI in the supplementary material has the location of the stations in each cluster.
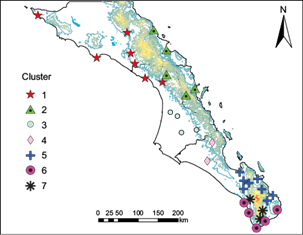
Fig. 2 Distribution of stations in seven clusters identified by the Ward algorithm based on maximum temperature and precipitation from 34 stations out of the original 50, which complied with the requisite of at least 85% of the information for the period 1971-2000. The color contours represent the topography of the region (from sea level to 2000 masl).
3.2 Observed annual and decadal variability
The evolution of normalized extreme precipitation, corresponding to the 95th percentile determined from the daily observations for each one of the clusters and for all clusters combined, at decadal, annual, and monthly scales, is shown in Figure 3. Note that the last decades of the analyzed period (1995-2004 and 2005-2014) show an overall increase in extremes (Fig. 3a), driven by clusters 1, 2, 3, 6, and 7. In particular, the last decade (2005-2014) shows total values that are much larger than in any of the previous 50 years. Figure 3b shows the total number of events of extreme precipitation at an annual scale (in dashed pink curve) as well as the frequency per cluster since 1950. This annual variability clearly shows years with increased events of extreme precipitation while other years with very few extreme events, suggesting the modulation by large-scale interannual phenomena (e.g., ENSO), which can combine with phenomena with longer time scales (e.g., PDO).
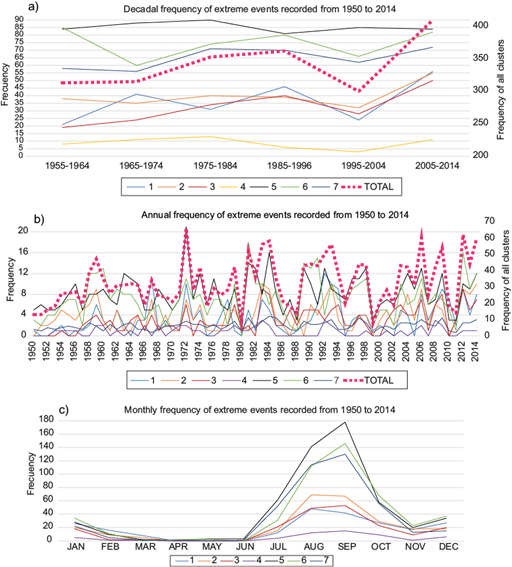
Fig. 3 Time evolution of the number of times extreme precipitation was recorded (95th percentile) as a function of cluster (indicated by colors with numbers 1 through 7) at (a) decadal scale and (b) annual scale. The heavy dashed line in panels (a) and (b) corresponds to the evolution of all seven clusters combined and the legend is shown on the right of each panel. (c) Annual cycle of extreme precipitation recorded (95th percentile) for each cluster.
The annual cycle of events of extreme precipitation (Fig. 3c) in clusters 2, 4, 5, 6, and 7 show maxima in September, with only clusters 1 and 3 in August. As mentioned earlier, 70% of precipitation in the regions is observed between July and October, when also most of the extreme precipitation events are observed. August and September coincide with the maximum frequency of landfall of tropical cyclones in the southern portion of the peninsula. Note the small frequency of extreme events that show peaks in December and January, when the overall precipitation amount is low. These events are likely modulated by annual and interannual patterns such as the PNA (White and Downton, 1991) and ENSO, which influence the penetration of frontal systems to the peninsula, affecting all clusters. Correlation maps with climate indices will be discussed in the following section.
3.3 Linear correlations with climate indices
Monthly correlation maps between extreme precipitation and the PDO index show a positive correlation for most months (Fig. 4). March has the highest correlation, followed by April, which suggests that the PDO modulates extreme precipitation during the transition season. Note that there is some modulation of extreme precipitation by PDO in July and August, which could be associated with the influence of landfalling TCs (Raga et al., 2013) in the southern Baja peninsula.
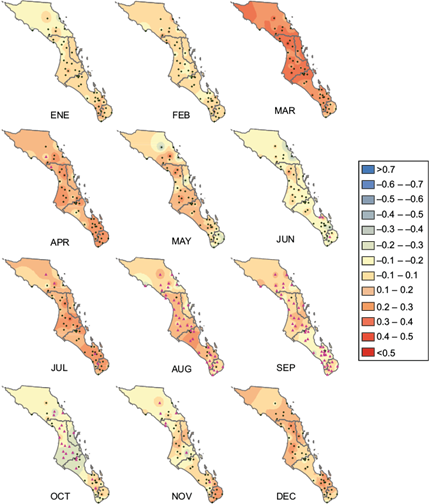
Fig. 4 Monthly correlation maps between PDO and extreme precipitation over the period 1922-2005. Pink triangles indicate significant values and green points indicate no significance.
During September and October, when extreme rainfall is observed due to monsoonal conditions and the influence of TCs in Baja California Sur, extreme rainfall is positively-but weakly-correlated with PDO in the southernmost tip of the peninsula, again likely due to landfalling TCs.
Averages of the two-month values of extreme precipitation were calculated and correlated with the MEI for the same bimester (that is, without lag). Figure 5 shows that the maximum positive correlation values are from February to April. A high positive correlation is also observed from October to December. Low correlation values are observed during the rainy season from June to October, and even negative correlations in the south and center of the state. Two-month lagged correlations (ENSO leading precipitation) are also calculated and shown in Figure 3S in the supplementary material and basically show little difference from results without lag.
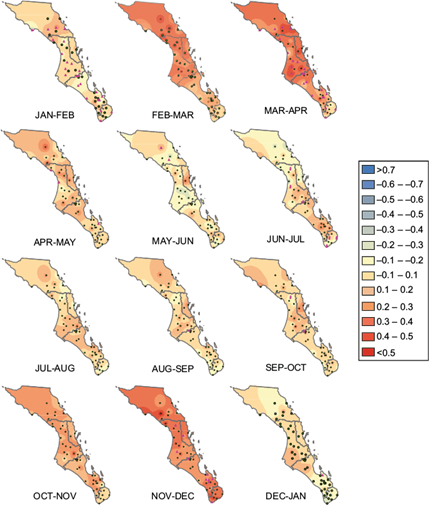
Fig. 5 Simultaneous correlation maps between bi-monthly MEI and extreme precipitation over the period 1922-2005. Green points indicate no significance and pink triangles indicate significant values.
The correlation between bimonthly MEI and monthly precipitation (not shown) indicates there is a positive influence in almost all months, reaching maximum values in the winter months. The correlation is practically null in June and very low from July to October during the rainy season. This is consistent with previous studies that did not observe ENSO modulation during the rainy season in the Baja peninsula (Cavazos et al., 2008).
The monthly correlation maps between extreme precipitation and the PNA (Fig. 6) show positive correlations during the winter months, reaching a maximum in March. In contrast, low and negative correlations are observed, as expected, during the rainy season.
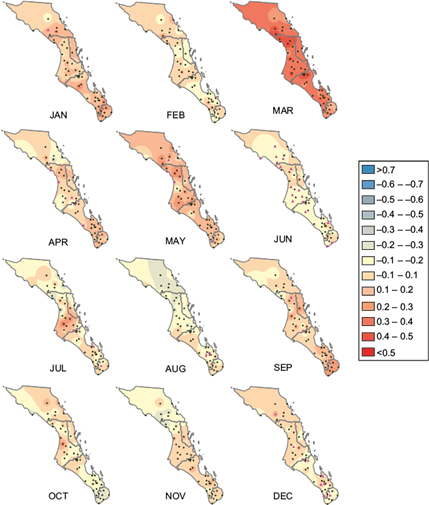
Fig. 6 Monthly correlation maps between PNA and extreme precipitation. The analysis period is from 1950 to 2005. Pink triangles indicate significant values and green points indicate no significance.
Also, both MEI and PNA exert a larger modulation during winter months but, surprisingly, show the maximum correlation in March, in the transition between the cooler-dry season and the warmer-dry season but before the rainy season is established. PDO also strongly modulates extreme precipitation in March, and there is also some modulation in July and August, but not much during September-October, with only some influence at the southernmost region of the peninsula.
3.4 Statistical models based on the historical period
As described in section 2.6, four different multivariate linear models for extreme precipitation were derived from the observations, considering the correlation analysis presented in the previous section. The fit coefficients for each of the four models M1, M2, M3, and M4 are presented in Tables SII-SV in the supplementary material.
Figure 7 shows a comparison between observed normalized extreme precipitation (black solid line) averaged over clusters 2, 4, and 7 and the results from the four multivariate models proposed in section 2.6 (represented by the different dashed lines as indicated in the legend of the figure). A similar figure for the rest of the clusters is shown in Figure S2 in the supplementary material. These clusters were chosen because they have quite different characteristics and represent regional climate variability: Cluster 2 consists of five stations located close to the Gulf of California and approximately at sea level. In contrast, Cluster 7 consists of three stations located at high altitudes in the Sierra de la Laguna mountains close to the southern tip of the peninsula, where orographic forcing can contribute to extreme precipitation. Cluster 4 is the smallest (only 2 stations), located halfway between clusters 2 and 7.
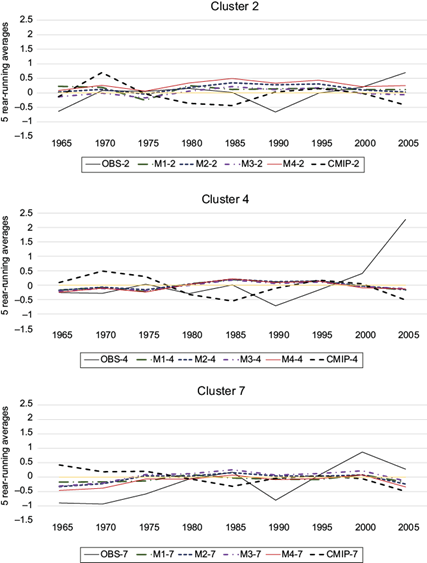
Fig. 7 Time series of observed normalized extreme precipitation (solid black line) and modeled extreme precipitation for clusters 2, 4, and 7, over the period from 1955 to 2005. The different dashed-colored curves represent the results of the statistical multivariate models M1 through M4. The heavy black dashed line represents the corresponding values from the closest grid point of the ensemble average CMIP5 simulations.
Observations in Cluster 2 indicate large positive anomalies of normalized extreme precipitation from 1956 to 1964. All four statistical models show positive anomalies but underestimate the magnitude in this period. While all statistical models show a change in the tendency of anomalies, only one (M3) reproduces the negative anomalies observed in the late 1960s. The heavy dashed line corresponds to the results from the CMIP5 ensemble during the historical period, which displays a larger magnitude of the anomalies and reproduces the change in sign as observed in the 1950s and 1960s. Observed anomalies between 1970 and 1978 oscillate around zero with no clear tendency and are reproduced by all four models. A clear positive tendency in the observations becomes obvious after 1978, with positive anomalies until 1985, which is also reproduced by all four statistical models. However, the observed large negative anomalies between 1986 and 1996 are not reproduced by any of the statistical models. From 1997 to 2005, all models underestimate observations, with M4 performing best of the four. Also note that after 1977 (“the climate shift”; Trenberth and Hurrell [1994]), the CMIP5 ensemble results seem to be out of phase from observations in Cluster 2.
In contrast to the large positive anomalies in Cluster 2, observations in Cluster 7 initiate in 1955 with mostly negative anomalies in the record of extreme precipitation, with only 1958 and 1959 showing slight positive anomalies. Negative anomalies dominate the observations until 1978. These contrasting observations between clusters 2 and 7 highlight the intricacies of the regional variability in the small land mass of the peninsula, which is also topographically quite complex. All four statistical models underestimate the magnitude of the observed anomalies, which oscillate around zero, changing sign in phase with the observations. Nevertheless, since 2000, negative anomalies have been modeled, and none of the models can capture the observed large positive anomalies. The CMIP5 ensemble results also fail to reproduce the observed anomalies and appear out of phase for the full 50 years analyzed.
In contrast with both previous clusters, Cluster 4 shows observed anomalies that start quite negative in 1955 and tend towards zero by 1965, after which the observed anomalies oscillate around zero until 1978. Between 1979 and 1999, anomalies are small except between 1989 and 1995 when they are negative, with the lowest value observed in 1990. None of the statistical models can reproduce the large positive anomalies observed from 2000 to 2005, and neither does the CMIP5 ensemble.
Several metrics were calculated to evaluate the performance of each model in each of the seven clusters, such as root mean square error (RMSE) and bias, as well as the correlation between predicted and observed values of the normalized extreme precipitation (R2 values are listed in Tables SII-SV in the supplementary material). An additional test for statistical models involves the estimation of Receiver Operating Characteristics (ROC) curves from the confusion matrix determined for each model, is the estimate of the true positive rate (frequency of an extreme event that was predicted, whether it was recorded in the historical data) versus the false positive rate (frequency of an extreme event that was predicted and did not occur). The area under the ROC curve (AUC) for each model provides an objective measure to compare models and determine the one that has better skill. The results (Table VI) indicate that model M4 is the best model in six of the seven clusters in the Baja peninsula. Model M3 has slightly better skills than M4 in Cluster 3. This metric also allows us to conclude that model M1 is the one with the least skill for any of the clusters.
3.5 Statistical models applied to future projections
Future projections of precipitation extremes in the southern Baja peninsula are estimated using model M4 (bias-corrected), based on CMIP5 oceanic conditions associated with PDO, ENSO, and TC-Coef (based on Tory et al., 2020) as predictors, for scenarios RCP4.5 and RCP85.
Figure 8 presents the projections from model M4 for clusters 2 (top panel), 4 (middle panel), and 7 (bottom panel) as examples. Three periods of interest are separated by vertical solid lines in Fig. 8: 1950-2005, 2006-2040, and 2041-2100. The first period corresponds to the historical observations of normalized extreme precipitation (solid black line), the output of the M4 model (solid red line), and the historical ensemble simulation from CMIP5 (solid blue line). Normalized observations (solid black line) in clusters 2 (top) and 7 (bottom) oscillate around 0 and do not indicate any clear trend between 1950 and 2005, while observations in Cluster 4 since 1990 indicate a positive trend, which is seen neither in M4 nor in CMIP5 historical simulations, possibly indicating very localized phenomena responsible for this trend, not modulated by large scale oceanic conditions.
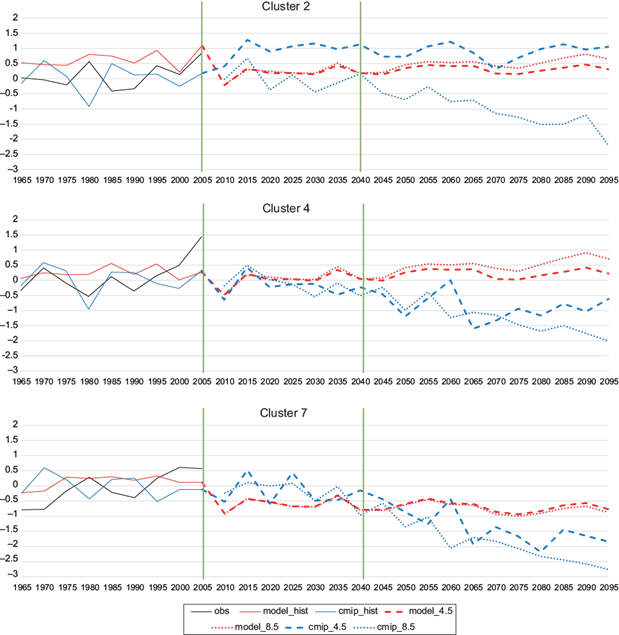
Fig. 8 Time series (10-year moving average) of observed extreme precipitation (solid black line), as well as from the M4 model (red line) and the CMIP5 historical simulations (blue line) from 1950 to 2006. The red dotted line corresponds to projected results from model M4 under the RCP85 scenario, while the red dashed line corresponds to projected M4 results under scenario RCP45. The blue dotted line shows the ensemble CMIP5 simulation under scenario RCP85 while the blue dashed line corresponds to scenario RCP45. The vertical solid lines separate the historical period (1950-2005) from the near- (2006-2040) and far-term (2041-2100).
4. Discussion
Extreme precipitation during the rainy season (July-October) in the Baja peninsula has been associated with large-scale phenomena such as the PDO and ENSO, as well as the presence of TCs even when they do not make landfall. Thus, the four models proposed here for extreme precipitation (95th percentile) explore the modulation by these climate indices and the proximity of TCs.
The correlation analysis between extreme precipitation and climate indices indicates that the greatest influence on extreme precipitation is the PDO in model M3, resulting in the highest correlation coefficients in six of the seven clusters. Recall that M3 has terms for PDO and also ENSO indices, which are solely determined by SSTA. While not explicitly including a term associated with the proximity of TCs, M3 performs well in several clusters because the positive phase of the PDO favors precipitation associated with TCs (Englehart and Douglas, 2001, 2002), and because TC’s landfall is also modulated by the positive phase of PDO (Raga et al., 2013).
Extreme precipitation anomalies increased in all clusters in southern Baja from the mid-1990s to 2005 (solid black line in Fig. 8 for clusters 2,4, and 7) corresponding to the cool phase of the PDO. While O’Brien et al. (2019) identify that precipitation during the PDO cool phase is associated with drought in the western USA, the opposite effect is detected at the latitude of the state of Baja California Sur. Note that the cool phase is associated with cold SST anomalies in the northern Pacific near the Aleutian Islands and corresponds to warm SST anomalies at tropical latitudes, likely responsible for the increased extreme precipitation observed. In contrast, the results of Peralta-Hernández et al. (2009) for southern Mexico show that extreme events tend to occur more frequently during La Niña and the warm phase of the PDO.
Models M2 and M4 both include terms associated with PDO and ENSO and an additional term related to the presence and proximity of TCs. Model M2 has a better correlation with records of extreme precipitation events than the M3 model, which does not explicitly include TCs. In clusters 5, 6, and 7, located in southern BCS, the variable TC has a greater influence than ENSO and PDO. It was expected that the linear multivariate model M2, which includes a term associated with the proximity of TCs to the southern Baja peninsula, would be a good predictor, but it underperformed compared with M4, which includes the proximity of the fraction of TCs in the EPAC basin that are found within 300 km from the southern tip of the peninsula.
Models M3 and M4 both include terms associated with the PDO and ENSO indices, but the additional term in M4 provides a slight advantage as a predictor for six of the seven clusters. It is not surprising that M4, which includes the contribution of TCs, would have better skill than M3 in predicting extreme precipitation in these clusters. M4 represents extreme precipitation better because 70% of the annual precipitation in BCS is concentrated between July and October, with peak precipitation in September coinciding with the month of highest tropical cyclone activity (Cavazos et al., 2008).
Models M3 and M4 (solid red line in Fig. 8) correlate better with the observed extreme precipitation values than the historical ensemble simulation of the CMIP5 models. While the CMIP5 models capture the oceanic decadal variability, they do not quite capture the amplitude of the extreme precipitation anomalies, showing a systematic negative bias.
For future decades, CMIP5 models capture the presence of the PDO modulating extreme precipitation but again show much smaller anomalies that are superposed to a large overall decreasing trend to the end of the century. This behavior contrasts with the results of model M3, which includes PDO and ENSO modulations but no explicit atmospheric response. The oceanic conditions associated with PDO and ENSO from the ensemble of CMIP5 models indicate a good correlation with the multivariate linear model in all clusters for both future scenarios (RCP4.5 and 8.5). This is consistent with DeFlorio et al. (2013), who indicate that total and extreme precipitation (90th percentile) over the western USA show statistically significant links with ENSO and PDO. In addition, M3 showed systematically positive precipitation anomalies from 2006 to 2040 (possibly linked to the CMIP5 ensemble negative bias) and smaller values from 2041 to 2100, particularly in clusters 1, 4, 5, 6, and 7. However, also note that the decreasing trend is much smaller in the results of model M3 than in the ensemble CMIP5 simulation to 2100.
For Cluster 2, projections from model M4 (Fig. 8) are found between the projections for RCP 4.5 and RCP 8.5 of CMIP5, while for clusters 4 and 7, model M4 shows higher values than those projected by CMIP5. The future projection of extreme events using model M4 shows a decrease with respect to historical values, consistent with Tory et al. (2020), who show a reduction between 10 and 23% of TCs (in five CMIP5 models with the best fit in the EPAC basin). Although model M4 projects extreme precipitation events in the future, these are directly associated with the presence of TCs near BCS, and thus, extreme precipitation is expected to decrease by the end of the century.
5. Conclusions
The available dataset from 161 climatological stations in the state of Baja California was subjected to a thorough quality assurance process resulting in a robust and representative climate database for the state. A high-quality database from only 50 climatological stations is now available on a daily, monthly, and annual scale, essential for any rigorous climatological study. Clustering analysis allowed the grouping of stations into seven regional clusters with similar climates (Fig. 2).
Extreme precipitation events (95th percentile) were estimated for each cluster and showed a decadal modulation with an increasing tendency in the last decade in all clusters. The annual cycle of extreme precipitation events shows maxima in August and September, during the rainy season (July-October). Nevertheless, all clusters also show small peaks in the frequency of extreme events during December and January. Interannual and decadal modulation of extreme precipitation in each of the seven clusters indicates the strongest influence of PDO, PNA, and MEI in March, in the transition from the cooler-dry period to the warmer-dry period before the onset of the rainy season.
Four multivariate statistical models (M1, M2, M3, and M4) were developed based on historical information. The statistical model M1 (using PDO, MEI, and PNA as predictors) is a better fit for extreme precipitation in the winter months; however, extreme precipitation in winter is very low compared to summer.
Model M3 (with only PDO and ENSO as predictors), while not explicitly including a TC term, performs moderately well since precipitation in NW Mexico and landfalling TCs are modulated by the PDO. The results here indicate that these climate indices are also good predictors of extreme precipitation, particularly in the region close to the Gulf of California (Cluster 2) and the central region of the peninsula (clusters 3 and 4)
Additionally, two models (M2 and M4) were developed to include not only PDO and ENSO but also the influence of tropical cyclones as predictors of extreme precipitation.
In model M2 the additional term includes an indicator of the number of cyclones within 300 km of Los Cabos during the historical period from the HURDAT. Model M2 performs better than M3 over the rainy season in the historical period. In model M4, the additional term includes an indicator of relative TCs activity near the Baja peninsula based on Tory et al. (2020). M4 performs better than all other models in six of the seven clusters during the historical period, only performing with less skill than M3 in Cluster 3.
Future projections of extreme precipitation can be made based solely on oceanic conditions since, due to their coarse resolution, few of the CMIP5 models can accurately depict the number of tropical cyclones near the Baja California peninsula. Nevertheless, the recent work of Tory et al. (2020) provides a means to estimate the fraction of TCs near the peninsula as a fraction of the total TC number in the EPAC basin that can be used for future projections. M4 incorporates the fraction based on Tory et al. (2020) and projects more precipitation in extreme events than the ensemble of CMIP5 for both future scenarios. For the second half of the century, projections by both M4 and the CMIP5 ensemble simulation indicate a decrease in extreme precipitation in most of the seven clusters identified within BCS.
This study provides valuable information on future extreme precipitation in an arid region located in a very narrow peninsula in the presence of steep topography, which could result in potential damage to ecosystems and infrastructure. These will be evaluated in a companion paper.


 nueva página del texto (beta)


