Introduction
Aspergillus niger is a saprophytic, aerobic, filamentous fungus belonging to the Trichocomaceae family. In nature, it is found in soil and has a wide worldwide distribution, reported mainly in the tropics with high frequency in hot and humid places (Rippel-Baldes, 1955; Baker, 2006). This microorganism is known for its ability to produce a wide variety of enzymes and metabolites of industrial interest (Cairns et al., 2018; Lime et al., 2019; Li et al., 2020b; Cairns et al., 2021) such as pectinase (Grassin and Fauguenbergue, 1999; Li et al., 2020b), tannase (Papadaki and Mantzouridou, 2023; Viniegra et al., 2003), amylase (Henrissat et al., 1991; An et al., 2019), cellulase and hemicellulase (Grassin and Fauguenbergue, 1999; Liu, 2021), lipase (Schuster et al., 2002), glucose oxidase, catalase (Berka et al., 1992; EFSA CEP Panel, 2023), and economic important metabolites such as citric acid, among others (Behera, 2020; Lima et al., 2019; Schuster et al., 2002; Viniegra et al., 2003; Yu et al., 2021).
The A. niger strain HPD-2 was isolated from soil in 1979 at the Centro de Graduados del Instituto Tecnológico de Veracruz by Patiño Hernández to study microorganisms capable of hydrolyzing starches, to establish a process for the use of cassava by the fermentative pathway (Baltazar-Ramírez, 1984; Carballo and Melgarejo, 1986; Ceseño-Gamez, 1988). Later, it was classified and identified as a strain, through molecular analysis by our work group (Cervantes-Montelongo, 2009). According to the literature, A. niger grows at a temperature range of 28-30 ºC within pH values from 4.5 to 6 (Abarca et al., 2002); the A. niger HPD-2 strain presents interesting growth characteristics such growth at 38 ºC and pH of 3. This point suggests that its enzymatic systems used for the assimilation of carbon sources are viable even under these conditions. Previous analyzes of an A. niger strain HPD-2 crude extract glucoamylase, showed that it has an optimum temperature and pH of 60 ºC and 3 respectively (for more information see Supplementary Table 1) (Carballo and Melgarejo, 1986). This is different from that reported for other strains; these characteristics could minimize the risk of microbiological contamination within industrial processes. Likewise, according to the reported data, A. niger HDP-2 presents glucoamylase activity in a non-inducing medium (Carballo and Melgarejo, 1984), suggesting that the synthesis of the enzyme could be deregulated.
Tabla 1 Valores de la actividad de la glucoamilasa por mg en peso seco.
| Carbone source | Time (h) | Activity per mg dry weight (E-03) | Total activity (E-03) | Activity per mg of total protein (E-03) |
|---|---|---|---|---|
| Glucose | 36 | 0.324 | 7.2 | 31.7 |
| 48 | 8.900 | 4.4 | 30.4 | |
| 72 | 7.900 | 6.3 | 65.6 | |
| Starch | 36 | 0.255 | 2.5 | 26.1 |
| 48 | 9.200 | 1.6 | 12.2 | |
| 72 | 9.100 | 5.4 | 22.3 | |
| Glucose + Starch | 36 | 7.400 | 3.5 | 25.4 |
| 48 | 0.102 | 5.4 | 57.5 | |
| 72 | 6.300 | 5.4 | 27.0 | |
| Maltose | 36 | 0.151 | 3.0 | 47.7 |
| 48 | 0.196 | 5.4 | 218.5 | |
| 72 | 5.600 | 3.9 | 28.3 |
(n = 2).
A. niger is capable of hydrolyzing starch because it secretes two enzymes, α-amylase and glucoamylase (GA), the latter encoded by the glaA gene. The molecular mechanisms that regulate the expression of the glaA gene have not been fully elucidated; however, in eukaryotic systems such as A. niger and A. nidulans, the CreA boxes regulate catabolite repression. CreA protein is the most studied transcription factor known as carbon catabolite repressor in Aspergillus ssp. (de Assis et al., 2021), which is encoded in a gene called the creA gene (Dowzer and Kelly, 1991).
Currently, the demand for thermostable amylases is increasing since hydrolysis processes are carryied out at high temperatures, which minimizes the risk of microbiological contamination and reduces reaction time (Bertoldo and Antranikian, 2002; Pandey et al., 2000). Also, glucoamylase is one of the most important enzymes used in the alimentary industry (Zong et al., 2022), added to this, recently there has been an effort using molecular techniques, to make A. niger isolates safer in the food industry due to the synthesis of mycotoxins by some strains as well as increasing the amount of secreted proteins (Li et al., 2020a; Liu et al., 2022).
The present work focuses on expanding the characterization of the A. niger HDP-2 glucoamylase, not only at an enzymatic level but also at a molecular level. This is important since, thanks to factors such as thermostability and acid resistance, the enzyme can have several industrial advantages such as reduced risk of media contamination, and that it can be recovered and partially purified with relative ease, which could be used in the production of glucose syrups.
Material and methods
Biological material and culture conditions
The A. niger HDP-2 strain was propagated in different culture media according to the experimental requirements. For its propagation, spores were inoculated in inclined tubes containing PDA medium (NutriSelect® Plus), and incubated for eight days at 38 ºC until the fungus covered the entire surface of the agar. The strain was reseeded periodically to be always available during the project.
To corroborate the presence of the enzyme in a non-inducing medium, flask-level tests were carried out in a liquid minimal medium (formulation: carbon source 10 g/L; (NH4)SO2 2.5 g/L; K2PO4 1g/ L; pH 3 adjusted with concentrated HCl). The carbon sources used were glucose, starch, glucose and starch combination (1:1 proportion), maltose, and glycerol. All enzyme tests were performed in duplicate with each different carbon source using incubation times of 36, 48, and 72 h at 38 °C and 150 rpm, using an initial inoculum of 106 spores/mL. Depending on the carbon source of the experiment, the spores used came from a solid culture medium with the same carbon source (formulation: carbon source 10 g/L; (NH4)2SO2 2.5 g/L; K2HPO4 1 g/L; bacteriological agar 30 g/L).
The biomass produced from the spores propagation was placed in a watch glass and dried in the oven at 60 °C for 12 h, after which dry weight was recorded.
Biochemical determinations
For the quantitative determination of reducing sugars present in the filtered media corresponding to each of the carbon sources, the DNS method was used (Miller, 1959). The amount of residual starch present in the corresponding filtered media where starch was used as a carbon source was determined by iodometry (Anand, 2015). To quantify the total protein present in the filtrates of each medium, the Lowry method was used ( Lowry et al., 1951). For the enzyme activity determinations, aliquots of the different culture media and times were placed in a water bath at 60 ºC for 10 minutes. Subsequently, aliquots were taken from each tube for the tests of reducing sugars and residual starch, comparing them with the same samples without heat treatment and control solutions.
Concentration of secreted enzymes
To concentrate the enzymes in the medium of the glucose and starch culture medium previously inoculated with A. niger HDP-2, a BUCHI model RE124 rotary evaporator was used, until the initial volume was reduced between 80-90 %, using a maximum temperature of 60 °C. A dialysis process was then performed on the concentrated filtrates using WWR Scientific Inc. dialysis tubes with a cut-off size of 12 - 14 kDa, with low agitation in a 0.05 M pH 3 acetate buffer solution, at 4 ºC for approximate 24 h. Afterward, the activity was measured employing the aforementioned techniques, both of them, the filtrate concentrated by rotary evaporation, as well as the lyophilized.
Effect of pH and temperature on enzyme activity in concentrated enzyme filtrates
To characterize the glucoamylase, the behavior of the activity concerning temperature and pH was measured. Activity tests were performed on the concentrated and dialyzed extract to evaluate different pH values. It was tested from a pH of 2 to 9 with intervals of one pH unit. To ensure different pH values, several buffers were used, for pH values of 2 to 4, 0.05 M acetate regulator was used, for 5 to 7, a 0.05 M phosphate regulator, and finally for pH 8 and 9, the 0.05 M TRIS-HCl regulator. The substrate solubilization, which was gelatinized starch, was carried out in each case in the corresponding regulator. In the same way, to identify the optimum activity temperature, concentrated and dialyzed extract was used in a range between 30 to 80 ºC, every 10 ºC at pH 3. All tests were performed in duplicate.
To calculate the apparent enzymatic constants, assays were carried out measuring glucoamylase activity at a temperature of 70 ºC and a pH of 3 using different substrate concentrations (gelatinized starch) of 5, 10, 20, 30, 40, 50, 60, 70 g/L.
Molecular characterization
For DNA genomic extraction from A. niger HDP-2 strain mycelium, the Dellaporta method (Dellaporta et al., 1983) was used. For sequence analysis, PCRs were performed to amplify different regions of the glaA gene. Oligonucleotides were synthesized for the open reading frame, the promoter region, as well as for the region corresponding to the SBD (Starch Binding Domain).
The amplification products were visualized by 1.2 % agarose gel electrophoresis and bands were purified with the Silica Bead DNA Gel Extraction kit (Fermentas, Waltham, MA, USA). The purified fragments were used directly for the ligation into the pCR®4-TOPO vector (Invitrogen, Waltham, MA, USA). Once the plasmids were ligated, they were introduced into Escherichia coli cells (MultishotTM Strimwell TOP10 from Invitrogen, Waltham, MA, USA) for preservation and propagation. Kanamycin and ampicillin (50 µg/mL) were used as selection marker antibiotics. Plasmid DNA extraction was performed using the GeneJet Plasmid Miniprep kit (Fermentas, Waltham, MA, USA), and to verify the PCR product insert of selected clones, the pDNA was digested with the enzyme EcoRI (Invitrogen, Waltham, MA, USA).
The vectors containing the fragments of interest were sequenced, analyzed, and compared with the NCBI GeneBank database.
Glucoamylase regulation assay
Total RNA from A. niger HDP-2 mycelium, previously cultured in the presence of glucose or starch as a carbon source, was extracted under the RNeasy Mini Kit (Qiagen, Hilden, DE) protocol. First-strand synthesis and RT-PCR were performed using the RevertAid First Strand cDNA Synthesis kit (Fermentas, Waltham, MA, USA), analyzed by semiquantitative rt-PCR at the transcription level of the SBD gene.
Results
Metabolic kinetics
The amount of biomass produced by A. niger HDP-2 was measured for the different culture media using diverse carbon sources (Figure 1). In all cases, growth was in mycelial form, and the one with the highest yield was in the medium that had a mixture of glucose and starch; on the other hand, the one that contained glycerol as a unique carbon source had the lowest yield. A similar amount of biomass can also be observed in the glucose and starch medium, like in the glucose medium.
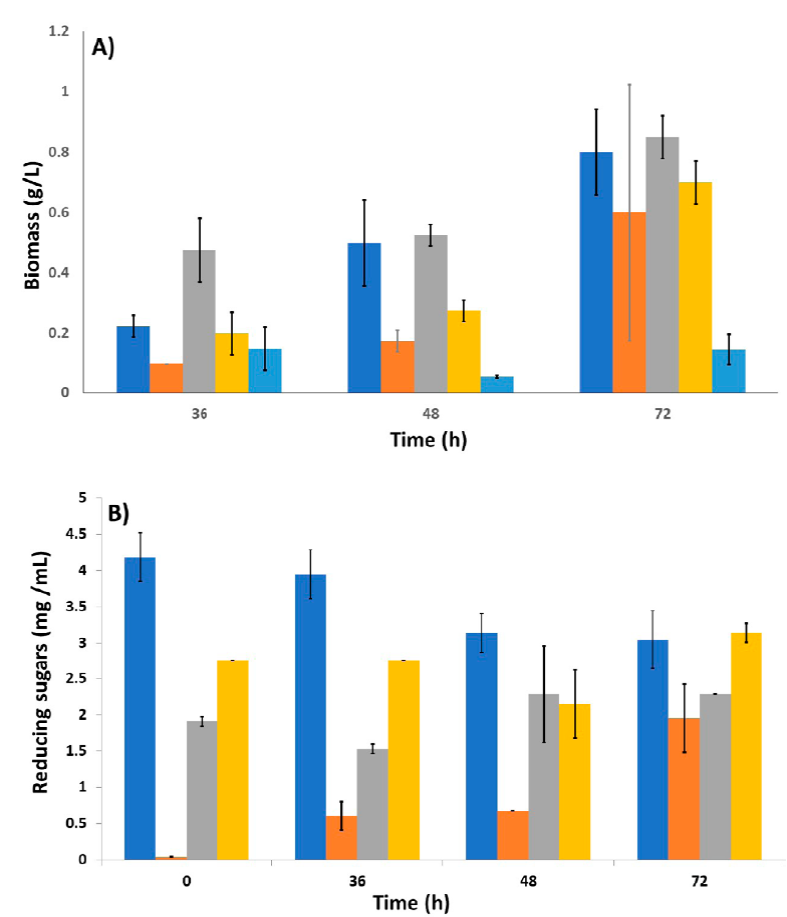
Figure 1 Comparison of biomass and reducing sugars generated by A. niger HDP-2 in culture media using different carbon sources at different times. A) Biomass generated by A. niger HDP-2 in culture media using (Blue bar) Glucose, (Orange bar) Starch, (Gray bar) Glucose + Starch, (Yellow bar) Maltose, and (pale blue bar) Glycerol (n = 2); B) Kinetics of reducing sugars present in the culture media using different carbon sources at different times, (Blue bar) Glucose, (Orange bar) Starch, (Gray bar) Glucose + Starch, and (Yellow bar) Maltose (n = 2).
To determine the number of carbohydrate molecules used by the fungus for its growth, and to give us an idea of the possible presence and extracellular activity of the enzyme glucoamylase, the determination of reducing sugars was carried out (Figure 1A).
As expected, in the glucose medium, the amount of reducing sugars decreased over time which correlates with the increase in biomass at the same period (Figure 1B). However, at 72 h of incubation a remaining number of sugars are still observed; considering that the proportion of biomass obtained is low, compared to other references, there are still reducing sugars available for growth.
For the medium containing starch, the amount of reducing sugars produced by the enzymatic hydrolysis increased as time passed. At 36 and 48 h of incubation, the value of the quantification is very similar, which could suggest that the fungus consumed sugars produced by the hydrolysis of the starch present in the medium, and a significant increment of this parameter was not detected until 72 h.
In the case of the medium with glucose and starch mix, the amount of reducing sugars decreased from 0 to 36 h, indicating consumption. On the other hand, for the 36 to 48 h period, the reducing sugars increased as a result of the hydrolysis of starch in the medium and the possible activity of the enzyme under not-inducing conditions.
On the other hand, the amount of residual starch present in the media with starch and the mixture glucose+starch after the growth of A. niger HDP-2 was determined. As shown in Figure 2A, after 36 h the most marked decrease in residual starch occurs, although this behavior was observed from the beginning of the experiment, indicating starch hydrolysis, and suggesting glucoamylase activity. At 72 h, the residual starch reduced considerably, up to 81.56 % compared to time zero. However, this is not reflected in the biomass since a greater amount would be expected with greater hydrolyzed substrate availability.
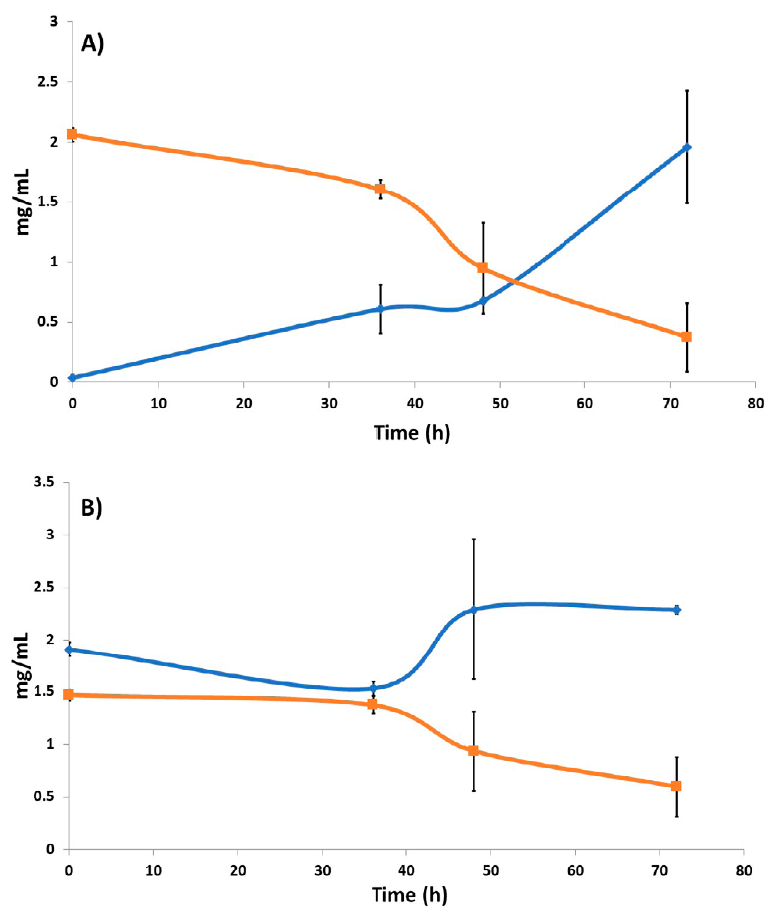
Figure 2 Comparison graph between reducing sugars and residual starch in the culture media. A) Using starch as a unique carbon source. The increase in the amount of reducing sugars and the decrease in residual starch in the medium at 0, 36, 48, and 72 h are shown: (blue line) reduced sugars; (orange line) residual starch (n = 2); B) Using glucose and starch mix as carbon sources. The increase in the amount of reducing sugars and the decrease in residual starch at 0, 36, 48, and 72 h are shown: (blue line) reducing sugars; (orange line) residual starch (n = 2).
When comparing reducing sugars and residual starch using a glucose and starch mixture medium (Figure 2B), at 36 h a marked decrease in the amount of residual starch was evident, which is consistent with the increase in the amount of reducing sugars. After 48 h, a decrease in residual starch is observed again, but this was not observed in the amount of reducing sugars. This could be explained by the fungus sugar consumption, which is reflected in an increase in biomass (Figure 1A). Interestingly, starch hydrolysis was observed early on, which suggested a deregulated synthesis of glucoamylase. This was taken with caution and corroborated with activity measurement experiments that were subsequently performed.
Measurement of protein secreted by A. niger HDP-2 to the culture medium
The amount of total extracellular protein present in the culture media was measured with the Lowry method (Lowry et al., 1951), to obtain a parameter for specific activity tests. One aspect to consider is that the amount of total protein is being measured, not only the amount of glucoamylase.
At first, it was observed that at 36 h a greater amount of total protein was obtained in the glucose medium, which decreased at 48 and 72 h. This could be explained since it is known that A. niger can produce proteolytic enzymes (Shcuster et al., 2002) that could hydrolyze proteins present in the medium. On the other hand, in the case of the starch medium, a higher amount of protein present in the medium is recorded over time. Since it is a medium with a carbon source that needs to be hydrolyzed, the fungus reacts to synthesize the necessary enzymes for this process, which correlates with the increment of reducing sugars and the decrease of residual starch (Figure 2A). In the maltose medium and the glucose and starch mixture, the behavior in terms of total protein is very similar. A decrease was shown at 48 h compared to 36 h and an increase at 72 h compared to 48 h. In the glucose and starch mix medium, there was an increase in reducing sugars and a decrease in residual starch at 36 h (Figure 2B), which indirectly indicates the presence of glucoamylase detected in the measurement of total protein. At 48 h, a reduction in total protein is observed, which could be explained by the action of proteolytic enzymes synthesized by the fungus.
The reducing sugars increased by the time of 36 h and are maintained at 72 h, this can be explained by the fact that the glucoamylase remains active or was continuously synthesized by the fungus. In the medium with glycerol, protein was not detected. In conclusion, considering all the results mentioned above, the presence of glucoamylase in the media was indirectly detected.
Glucoamylase activity per mg of dry-weight biomass
The existence of enzymatic activity by the glucoamylase produced by the A. niger HPD-2 fungus from different carbon sources was determined. Enzymatic activity was detected in all carbon sources used, except glycerol (Table 1). Glucoamylase activity was detected in the medium with glucose as carbon source at 36, 48 and 72 h, even though glucose is not an inducing carbon source for the synthesis of this enzyme. In addition to the activity in this medium, the highest activity value was also observed at 36 h, followed by the corresponding starch medium and finally for maltose at 48 h.
Parallel to these, similar analyses were carried out on samples from media richer in nutrients to compare if there was a greater enzyme synthesis by the fungus while it was growing in a medium not so limited. The results obtained were relatively similar to the presence of glucoamylase in a non-inducing medium and no differences in activity values were observed (Supplementary Table 2).
Table 2 Comparison of HDP-2 glucoamylase kinetics rates of experimental and calculated values by the Andrews model.
Tabla 2 Comparación de los valores cinéticos experimentales y calculados con el modelo de Andrews de la glucoamilasa HDP-2.
| Experimental substrate concentration (g/L) | Vexp (mg/mL * min) (E-03) | Vcal (mg/mL * min) (E-03) | (Vexp - Vcal)2 |
|---|---|---|---|
| 0 | 0 | 0 | 0 |
| 5 | 8.10 | 8.551291 | 2.03663E-07 |
| 20 | 10.70 | 8.611407 | 4.36222E-06 |
| 50 | 7.90 | 7.067980 | 6.92257E-07 |
| 60 | 5.00 | 6.640006 | 2.68962E-06 |
| 70 | 4.80 | 6.257172 | 2.12335E-06 |
| Squared error | 1.00711E-05 |
Tags: Vexp, V experimental; Vcal, V calculated. The squared error is displayed.
Apparent kinetic parameters of A. niger HDP-2 glucoamylase
To determine the optimal pH and temperature for the A. niger HDP-2 glucoamylase activity, the solution used was from rotary evaporation dialyzed filtered medium of fungal growth in starch as a carbon source. As a result, a pH of 3 was the optimum for enzymatic activity and the optimum temperature for activity was 70 ºC (Figure 3).
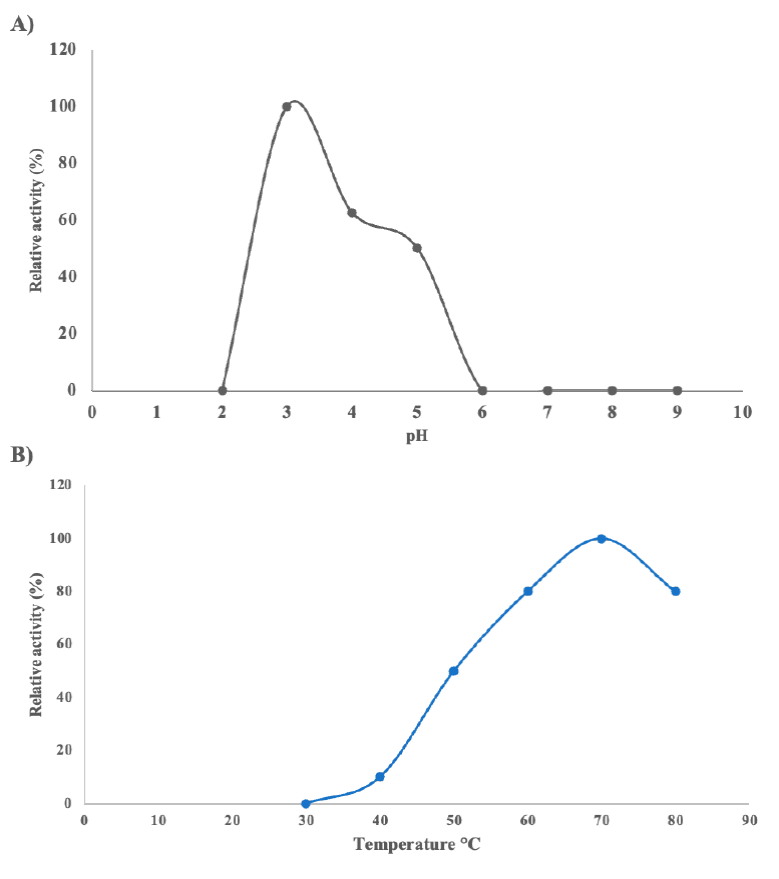
Figure 3 Effect of pH and temperature on the activity of the glucoamylase secreted by A. niger HDP-2. A) Activity tests varying the pH per unit from 2 to 9; B) Activity tests varying the temperature from 30 to 80 ºC at pH 3. Figura 3. Efecto del pH y la temperatura sobre la actividad de la glucoamilasa secretada por A. niger HDP-2.
To determine the K m and V max values of the A. niger-HDP2 glucoamylase, enzyme kinetics were carried out at 70 ºC, pH 3 and 250 rpm using different starch concentrations from 5 to 70 g/L, measuring the amount of reducing sugars at two-minute periods (Figure 4). From this data, the linear phases of each kinetic were taken and linearized to obtain the reaction rate for each condition. The detailed procedure is described in the section “Calculation of apparent K m and V max ” in the supplementary material.
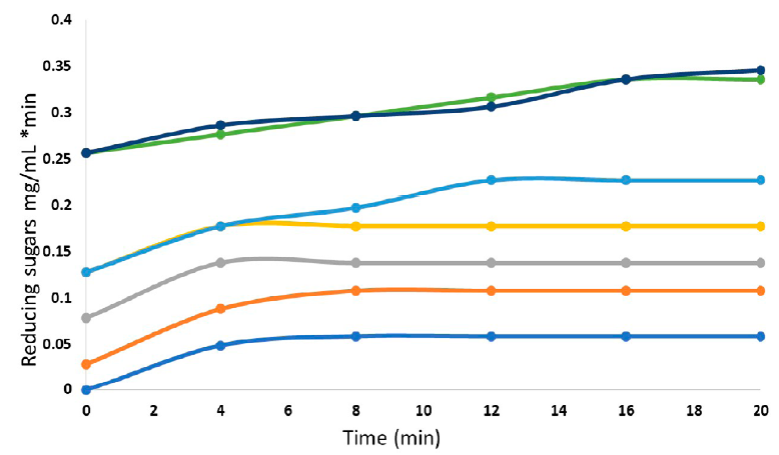
Figure 4 Enzymatic kinetics of glucoamylase-HDP-2 using different concentrations of starch for the calculation of kinetic parameters. From bottom to top, (blue line) 10 g/L, (orange line) 20 g/L, (gray line) 30 g/L, (yellow line) 40 g/L, (pale blue line) 50 g/L, (green line) 60 g/L, (dark blue line) 70 g/L.
Based on these results, the kinetics obtained under optimal conditions for the enzyme did not adhere to the Michaelis-Menten model (Figure 5A). An inhibition behavior was observed, which could be caused by the increase in substrate concentration since the reaction speed take on increasingly lower values once the substrate concentration is increased (in the section “Kinetics Andrews model” in supplementary material). To calculate the K m and V max apparent values, the Andrews model (1968) was chosen. Comparing the experimental and the estimated data, it seems that our results fit better in this kinetic model (Figure 5B and Table 2). The apparent K m was 1.08 g L-1 (6.6 mM), a competitive value compared to those reported by glucoamylases produced by other fungal strains, as shown in Table 3. This result indicates that the glucoamylase produced by A. nigger HPD2 strain presents a good affinity for its substrate. Although it should be noted that it is an apparent value and to make a good comparison, a kinetic study using a purified enzyme is needed. Nevertheless, these reference values indicate that they are not so far from a real value, considering that Silva et al. (2005) reported a K m of 4.76 g L-1 for a crude extract, unlike the other values that are for purified enzymes.
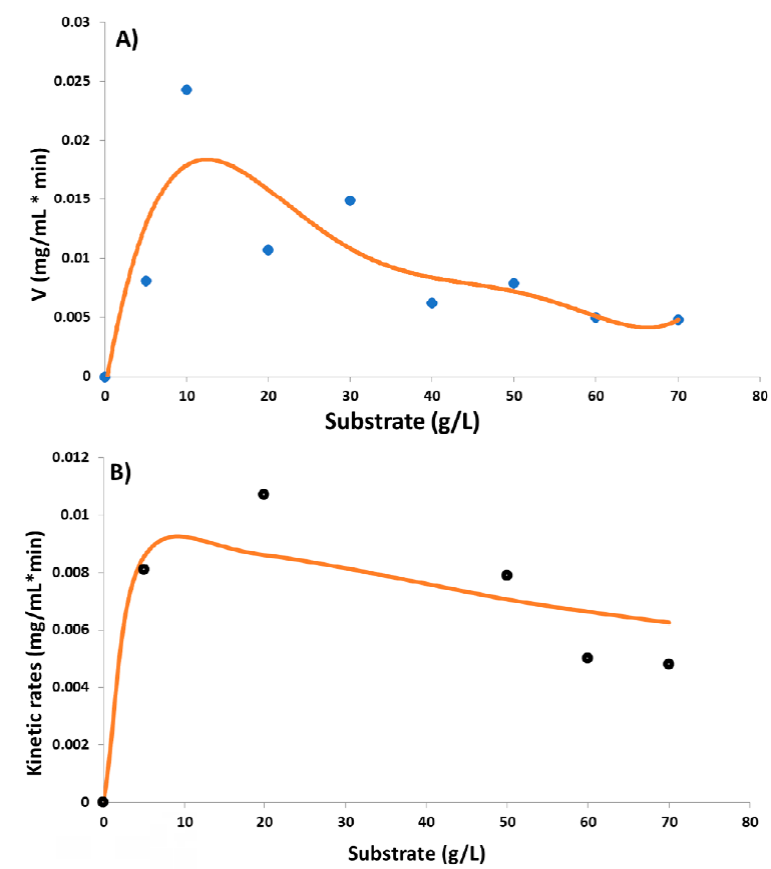
Figure 5 Data adjustment to different kinetic models. A) Michaelis-Menten model: diamonds represent the experimental data obtained, and the solid line represents the fit to the calculated Michaelis-Menten model values; B) Andrews model: circles represent the experimental data obtained, and the solid line represents the fit to the calculated Andrews model values.
Table 3 Comparison of K m and V max apparent values of glucoamylase from A. niger HDP-2 and comparative data from bibliographical references.
Tabla 3 Comparación de los valores la K m y V max aparente de la glucoamilasas de A. niger HDP-2 y datos comparativos de otras referencias.
| V max | K m (g L-1) | K i (g L-1) | |
|---|---|---|---|
| Glucoamylase A. niger HDP-2 (this work)* | 0.0108 mg min-1 | 1.08 | 97.56 |
| Silva et al., 2005* | 8.58 μmol min-1 | 4.76 | |
| Arica et al., 2000+ | 82.7 μmol min-1 | 2.3 | |
| Bahar and Çelebi, 2000+ | 31.64 μmol min-1 | 0.48 | |
| Riaz et al., 2012+ | 283 U mg−1 protein | 0.25 | |
| He et al., 2017+ | 8.24 E-02 mg mL-1 min-1 | 2.51 | |
| Banerjee and Ghosh, 2017+ | 35.03 U μl-1 min-1 | 0.387 |
Data from bibliographical references are shown. * Apparent value; + Real value.
On the other hand, the calculated V max value is 66.5 mM min-1 (0.0108 mg min-1), much below the range compared with data reported by other researchers (Table 3). It is important to mention that V max in the Andrews model is limited by the K i value; a relatively small K i value, in this case, indicates a strong inhibition, producing lower V max values.
In this context, apparent kinetic properties as well as optimum temperature and pH activity of glucoamylase from A. niger HPD strain suggest that it may be used commercially for the production of glucose in starch processing as well as in the food industry.
Molecular analysis
In order to identify possible changes in the sequences of the promoter region of the glaA gene (600 bp), glaA gene ORF (1900 bp) and SBD (300 bp) PCR amplification was used, followed by a cloning process of each of the amplicons as described in Material and Methods. The results are shown in Figure 6.
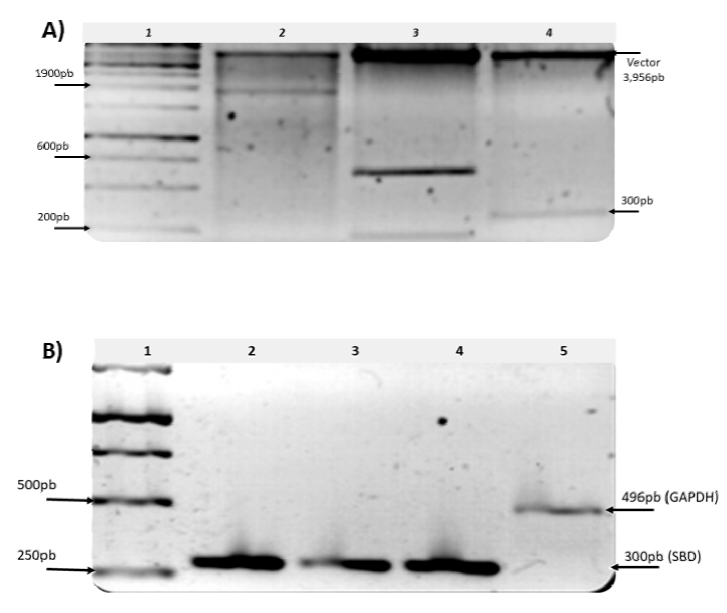
Figure 6 Molecular analysis of glucoamylase-HDP-2 in an EtBr-stained 1.2% agarose gel. A) Digestion of the plasmid DNA constructions with the fragments of interest with the enzyme EcoRI, Lanes: 1: marker size of 1.0 kb; 2: glaA gene 1900 bp; 3: glaA promoter regions 600 and 200 bp; 4: SBD gene 300 bp. B) RT-PCR amplification of the SBD gene. Lanes: 1, marker size of 1.0 kb; 2, PCR of SBD using genomic DNA as template; 3, transcripts of SBD using starch as a carbon source; 4, transcripts of SBD using glucose as a carbon source; 5, the positive control GAPDH gene.
ands for the regions of interest in the selected clones were obtained, and strikingly, for the fragment of the promoter region, two bands with sizes of approximately 600 and 200 bp are present (Figure 6), indicating the possible presence of an internal cutting site. Searching for an internal cutting site, it was found that this sequence indeed has this restriction site, and the two fragments obtained had the expected sizes. With these results, it was concluded that the cloned PCR products existed in the selected constructions, and we proceeded to obtain their sequence.
Comparing the sequences obtained with the NCBI database, no changes in those sequences were detected in any of the cases. As no changes were detected in the promoter region of the glaA gene, specifically in the creA boxes, that are directly related to catabolite repression by carbon sources, it is possible that the presence of the enzyme in a non-inducing medium is linked to changes in the creA gene or in its promoter region, or possibly in some transcription factor of the creA or glaA genes. Another possible explanation is that the positive regulation by the presence of glucose 6-phosphate on the CreA gene could be affected and that the enzyme necessary for this phosphorylation could also be affected at some level of its synthesis (Strauss et al., 1999).
To gather more evidence of the presence of the enzyme under non-induction conditions, total RNA was extracted for use in RT-PCR.
As can be seen in ure 6, there was amplification in the RT-PCR from the RNA extracted from mycelium grown in glucose, which allows us to relate the presence of the enzyme in a non-inducing medium and suggests that its synthesis was deregulated.
Discussion
The A. niger strain characterized as HDP-2 was isolated while looking for a microorganism with amylolytic capacity. In this work, several interesting growth characteristics were confirmed, such as its ability to grow at a pH and temperature outside the range previously reported for other strains of the same species. In addition, a concerning feature of this strain is the fact that the glucoamylase enzyme was synthesized even in a non-inducing medium; this is indicated by the detection of glucoamylase activity in media with glucose as a unique carbon source or a mixture of glucose and starch medium, where there should be catabolite repression.
The kinetics of the glucoamylase produced by A. niger HDP-2 were further investigated. In sum, it was confirmed that the optimum temperature for enzyme activity is 70 ºC and the optimum pH is 3. When determining the apparent values of K m and V max , in particular, K m was like those previously reported by other authors (See Table 3; Arica et al., 2000; Bahar and Çelebi, 2000, Silva et al., 2005; Riaz et al., 2012; He et al., 2017; Banerjee and Ghosh, 2017), but V max was far below the reported data. This is because our data were calculated using Andrews kinetic model, which takes kinetic substrate inhibition behavior into account. With this method, a relatively low K i value was obtained, which is directly related to the low V max result. However, it is necessary to carry out more tests to confirm these values and purify the enzyme to obtain the real values.
Regarding molecular analysis, comparing the sequences of glaA, part of the promoter of glaA, and the SBD of the HDP-2 strain with those reported in the NCBI using Nucleotide BLAST, no differences were found, especially in the creA boxes that are directly related to catabolite repression by carbon sources (See Supplementary Table 3; Verdoes et al., 1994; Zhong et al.,1994; Pel, et al., 2007). These results strongly suggest that the synthesis of glucoamylase is deregulated, probably related to changes in some other gene that regulates its expression, such as the creA gene or transcription factors of the Amy family.
Another possible explanation is that the positive regulation by the presence of glucose 6-phosphate on the CreA gene could be affected and that the enzyme necessary for this phosphorylation could also be affected at some level of its synthesis (Strauss et al., 1999). In addition, the presence of extracellular enzymatic activity of glucoamylase in a medium was confirmed not only by finding glucoamylase activity in filtered culture medium once A. niger HDP-2 has grown, but also detecting the transcripts of the glaA gene by rt-PCR. It is necessary to highlight that these results, although partial due to the fact that a purified enzyme is not yet available, are encouraging to continue studying this enzymatic model and the secreting strain of this enzyme. As previously mentioned in the introduction, glucoamylases are important enzymes in the food industry, and the characteristic kinetic parameters of HDP-2 glucoamylase make it attractive for use since its optimal temperature and pH could prevent contamination by bacterial growth of the substrates that are being processed with this enzyme.
Conclusions
The glucoamylase produced by the A. niger strain HPD-2 is deregulated in its synthesis since the presence of enzymatic activity was verified in a non-inducing medium and said activity is greater in the medium containing glucose as a carbon source. The analysis of the sequence and comparison with the database did not demonstrate any change in the sequence of the promoter region, so it is thought that the presence of glucoamylase could be related to changes in some other gene that regulates its expression, such as creA gene or Amy family transcription factors. The apparent kinetic parameters of the enzyme (V max = 6.66 mM, and K m = 66.5 mM/min) are comparatively competitive with those reported in the literature, and its optimal activity pH and temperature values (3 and 70 °C) can be an important advantage to reduce the risk of microbial contamination in industrial hydrolysis processes.


 nueva página del texto (beta)


