1. Introduction
Plant biomass is one of the potential carbon precursors used to prepare carbon nanomaterials or carbon nanostructures (CNS). The plant biomass usually contains cellulose, lignin, and hemicellulose. Those substances are rich in aromatic structures which can be improved by pyrolysis. All carbon nanomaterials consist of aromatic structures which form various shapes, such as fullerenes (the ball shapes) (Nasir et al., 2018), carbon nanotubes (tube shapes) (Rahman et al., 2019; Zaytseva & Neumann, 2016); graphene (individual aromatic layer) (Nasir et al., 2018), carbon dot (a polyaromatic carbon core-shell surrounded by amorphous carbon domains) (Haryadi et al., 2018), a graphitized sp2 in the core and abun dant functional groups in the shell (Liu, et al., 2017).
Each carbon nanomaterial or CNS has different characteristics which gives them different performance. For example, CNT has good mechanical, electrochemical, electrical, and thermal properties. Those characteristics make carbon nanotubes (CNT) useful for various applications, such as sensors, semiconductors, drug delivery, superconductive electrodes (Asnawi et al., 2018), optics, composites, biomedical and biomaterials devices (Szabó et al., 2010). Their properties as metals or semiconductors are determined by rolling of graphene sheets (Rahman et al., 2019). Graphene has large surface area, high electro/thermo conductivities, chemical/electrochemical stability, flexibility and elasticity, and surface hydrophobicity (Jia et al., 2017), excellent both chemical reactivity and light transmittance (Asnawi et al., 2018), graphene is very good for water purification and filtration, sensor, medicine, and renewable energy (Seo et al., 2017).
In the agriculture field, the CNS can be used as fungicides and disinfection agents. For example, single-wall carbon nanotubes (SWCNT) are strong antifungals, graphene and graphene oxide (GO) are antimicrobials. Graphene is used as sensor to detect Cd, CNT to detect Ni and ammonia, GO or MWCNT to detect herbicides and pesticides (Zaytseva & Neumann, 2016).
The various methods have been applied to produce CNS, such as laser ablation, chemical vapor deposition (Szabó et al., 2010; Seo et al, 2017), arc-discharge, sonochemical /hydrothermal, electrolysis (Szabó et al., 2010), high-pressure (Jia et al., 2017), and microwave (Asnawi et al., 2018; Haryadi et al., 2018). Pyrolysis by microwave gives advantages, such as selective heating (Kim et al., 2014), volumetric heating, rapid reaction, economic, and environmental friendliness (Kure et al., 2017). Microwave is an electromagnetic radiation between radio and infrared frequencies at 300 MHz to 300 GHz, (Kim et al., 2014). The hydrothermal method has also some advantages, such as low temperature process, no carrier gas or hydrocarbon (Szabó et al., 2010), environmentally benign, simple, and rapid (Razali, 2016). This research is part of HPU - UB research 2019 (Setianingsih et al., 2021).
In this research, we synthesized carbon nano material applying 2 different sequential methods i.e reflux - microwave and hydrothermal microwave. Reflux and hydrothermal have similar treatments but different apparatus with different pressure, i.e. pressure of the hydrothermal process is higher than the reflux. Effect of those conditions toward properties of the CNS was studied, especially related to surface functional groups, crystalinity, morphology, and dispersion stability.
Stability of colloid is a strong requirement for using nanocarbon as aditive of liquid fertilizer because condition as colloid is needed for easy spraying of the liquid fertilizer in paddy field. There are 3 kinds of dispersing techniques were compared in their each performance to form colloid system, i.e sonication, blending, and blending - sonication.
2. Materials and methods
2.1. Materials
This research has used carbon precursor of sugarcane leaf biomass. Chemicals for research include ZnCl2 (Merck) as chemical activator in pyrolysis and destilated water.
2.2. Procedure
2.2.1. Preparation of biomass
The sugarcane leaf was washed by water, then dried under sun light, crushed, and sieved to get particle size of > 60 mesh.
2.2.2. Pyrolysis of biomass
This procedure is based on the modified previous research (Syarif & Prasagi, 2016). The biomass (50 g), ZnCl2 (1 gram) and the destilated water (100 mL) were mixed and homogenized for 3 minutes, then refluxed at 200oC for 6 h using heater of the boiled coconut oil (Figure 1A). The pyrolyzed product was pyrolyzed again in microwave (Panasonic, NN-GT35HM) at 800 W for 40 minutes (4 X 10 minutes) in the almost closed porcelain crucible (Figure 1B).
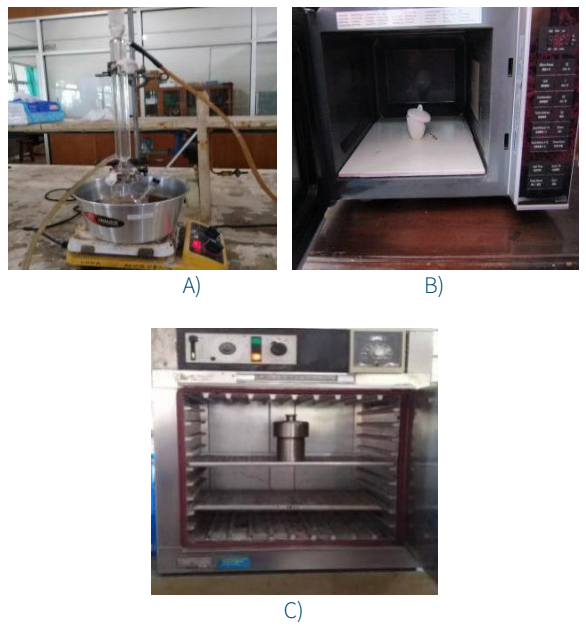
Figure 1 Tools for pyrolysis: A) Reflux, B) Microwave with porcelain crucible, C) Oven with autoclave.
For the hydrothermal - microwave method, a 10 g of biomass, 0.2 g of ZnCl2 and 20 mL of water, were mixed in outoclave and heated at 200oC for 5 h in the oven (MEMMERT) as shown in Figure 1C. The product was pyrolized in the almost closed porcelain crucible by microwave (Figure 1B) at 800 W for 40 minutes (4 X 10 minutes).
The carbon precursor and the pyrolyzed products were labeled as follows:
2.2.3. Characterization
Surface functional groups of the carbons were characterized with FTIR spectrometry (Shimadzu) at 400 - 4000 cm-1 using KBr pellet. Crystalline structure of biomass and the carbons were characterized by X-ray diffractometer (PANalitical type XPert PRO). Measurement was done from 10 to 80o, at 40 kV, 35 mA with a scan step time of 0.7 s, and Cu-Kα (λ=1. 54021 Å) Crystalinity index of cellulose for the biomass and the carbons were calculated using formula 1 (Lätt et al., 2010; Poletto et al., 2013):
I200 is the maximum intensity of diffractogram related to diffraction plane with hkl of 200. The Iam is the diffractogram intensity at 18° related to amorphous structure. Morphologies of the products were characterized using SEM (FEI type Inspect-S50). Based on those morphologies, we identified the nanomaterials.
Aromaticity (fa) is the carbon atom fraction in aromatic rings toward total carbon atoms in both aliphatic chains and aromatic rings. Aromaticity (fa) is calculated using formula 2 (Manoj & Kunjomana, 2012):
Under wide peak of carbon product, there are 2 Gaussian peaks, i.e. 20o (γ-band) and 26o (π-band; d002). Theoretically, the areas of the γ and П peaks are equal to the number ofaromatic carbon atoms (Car) and aliphatic carbon atoms (Cal) respectively. When the same baseline lengths of π and γ peak are assumed, areas of those peaks are replaced by peak intensity (I) in calculation of aromaticity (Titirici & Antonietti, 2010).
For characterization by UV-Vis spectrophotometry, the dispersion was prepared by immersing the carbon products (2 g) in water solvent (50 mL) and were stirred using a magnetic stirrer for 1 h. Then, each colloid (5 mL) was mixed with the destillated water at volume ratio of 1:1 and measured with UV-Vis spectrophotometer (Shimadzu).
Three different techniques were applied to prepare dispersion systems, including sonication (S), blending (B), and blending - sonication BS). The sonication was conducted using the sonicators (Krisbow - model 303306, RRC). The blending was performed with the blenders (Matsunichi, MSI-T2GN, RRC). Each blending or sonication technique was conducted for 1 h.
Qualitative dispersion test was conducted by observing the colloid stability every about 30 minutes during 3 h using photograph (CANON PowerShot SX430 IS; Wuxi; RRC). Quantitaive dispersion test was conducted by measuring TDS for each the CNS colloids before and after keeping them for 11 hours.
3. Results and discussion
3.1. Color of carbon
The pyrolysis of sugarcane leaf biomass by 2 different method combinations sequentially have been conducted. There is changing of material color from yellow brown to black as shown in Figure 3.
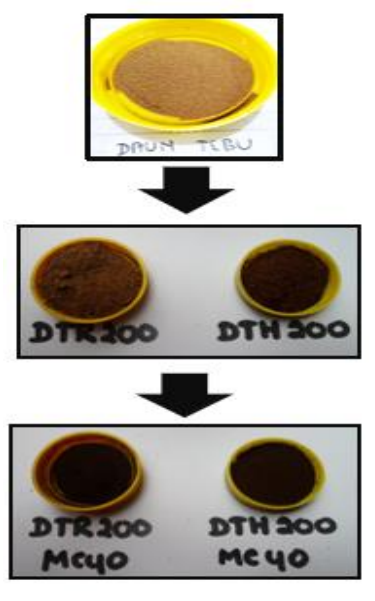
Figure 3 Biomass (DT) and pyrolyzed biomass by reflux (DTR200), hydrothermal (DTH200), reflux - microwave (DTR200-MC40), and hydrothermal - microwave (DTH200-MC40).
The color alternation is caused by carbonization reaction which transforms biomass to carbon due to the carbonization reaction of lignocellulose substances in the biomass (Setianingsih et al, 2021b). Based on the chemical analysis in Public Analysis Laboratory in Department of Chemistry Brawijaya University, the sugarcane leaf which was used in this research contained substances of hemicellulose of 17.19 ± 0.90 %, lignin of 34.24 ± 0.39 %, and cellulose of 22.65 ± 0.34 % (Setianingsih et al., 2021a).
Figure 3 shows that the carbon which was produced with the hydrothermal pyrolysis method (DTH200) tends to darker than the reflux method (DTR200). It is probably because temperature and pressure in outoclave reactor of the hydrothermal process are higher than in the flash of the reflux method. It causes more completed pyrolysis reactions by the hydrothermal than the reflux treatment.
After pyrolysis in microwave, the products were darker due to further carbonization reactions. The combination of the hydrothermal - microwave pyrolysis (DTH200-MC40) provided darker carbon than the reflux - microwave one (DTR200-MC40).
3.2. Surface functional groups
Functional groups of the pyrolyzed biomass were characterized with FTIR spectrophotometry (Figure 4). This characterization is needed to identify difference of the chemical characteristics between 2 kinds of the products resulted by the different method combinations, especially related to their surface functional groups. Interpretation was performed by comparing the FTIR spectra of the biomass and the products to carbon nanostructures (Titirici & Antonietti, 2010; Sevilla & Fuertes, 2009).
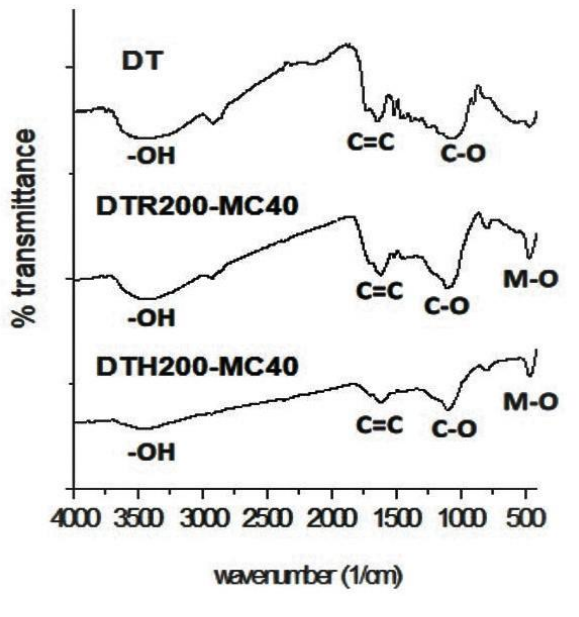
Figure 4 FTIR spectra of sugarcane leaf (DT) and the CNSs resulted by reflux-micowave (DTR200-MC40) and hydothermal - microwave pyrolysis (DTH200-MC40).
Presence of M-O bands are related to the ionic bond vibration of Zn2+ and O2- ions attached on graphene layers of the carbon. Those weaker FTIR spectra bands indicate lower content of those functional groups in the products. This less content of the functional groups indicated that the pyrolysis reaction by hydrothermal - microwave method was more completed than reflux - microwave method.
3.3. Crystal structure
Crystal structures of the carbons were characterized with X-ray diffraction method. The characterization was performed in LSUM Malang State University. The X-ray diffractograms of the products are presented in Figure 5. All patterns of those X-ray diffractograms are like cellulose (Li et al., 2014; Tsaneva et al., 2014), cellulose nanofiber (He et al., 2018), and raw wood sawdust (Chowdhury et al., 2016). It indicates that pyrolysis reaction of the biomass is still not completed so that structure of cellulose is still detected by XRD.
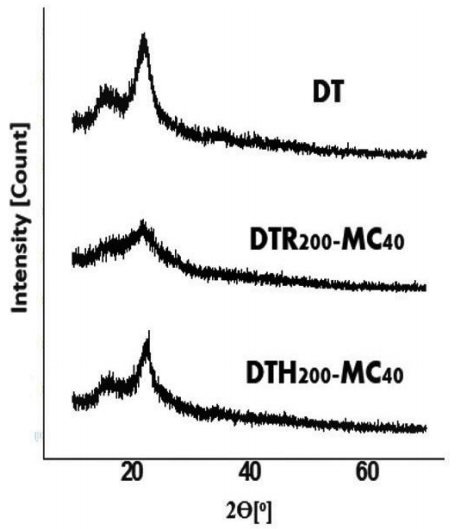
Figure 5 X-ray diffractogram of sugarcane leaf biomass (DT) and the CNSs resulted from pyrolysis of sugarcane leaf by reflux - microwave method (DTR200-MC40) and hydrothermal - microwave (DTH200-MC40).
However, both the carbons (DTR200-MC40 and DTH200-MC40) show lower intensity. It is similar condition with the X-ray diffractograms of the hydrothernmally pryrolyzed cellulose (Sevilla & Fuertes, 2009). It means that both products have lower crystalinities of cellulose than the biomass, as listed in Table 1, probably due to decomposition reactions during pyrolysis process. Those values decrease by sequence of biomass > the hydrothermal - microwave carbon > reflux - microwave carbon.
Table 1 Crystalinity index of cellulose in biomass and the pyrolyzed biomass.
| Sample | I (2Ө = 22°) | I (2Ө = 18°) | CI (%) |
|---|---|---|---|
| DT | 3 | 1 | 67 |
| DTR200-MC40 | 2.1 | 0.8 | 62 |
| DTH200-MC40 | 1.4 | 0.8 | 43 |
Determination of the carbon aromaticity is based on the diffractograms as resulted in data in Table 2. There is decreasing of the aromaticity. Based on the structure, lignocellulose contains aromatics structure.
Table 2 Aromaticity of the carbon based on their X-ray diffractograms.
| Sample | I (2Ө = 26°) | I (2Ө = 20°) | fa |
|---|---|---|---|
| DT | 0.9 | 1.7 | 0.65 |
| DTR200-MC40 | 1.5 | 1.9 | 0.56 |
| DTH200-MC40 | 1.5 | 1.9 | 0.55 |
Decreasing of aromatics probably because part of them was decomposed in pyrolisis process. It indicates that carbonization process is still not complete although it involved sequential methods. This indication was supported by existence of oxy functional groups and aliphatic C-H detected in FTIR spectra.
In other side, based on the X-ray diffractogram patterns and the peak positions, the pyrolyzed biomass diffractograms (2 thetha = 22o and 14o) are like patterns of carbon nano dot pattern (2Ө = 12o and 24o (Haryadi et al., 2018) and composite of PVD-CNT (2Ө = 18.3° and 20.5°) (Dhand et al., 2019). Based on FTIR spectra, especially related to the -OH bands, -COOH bands and C=C bands, fraction of each -OH and -COOH group toward C=C can be calculated. The -OH and COOH groups describe polarity of the biomass and carbons.
Figure 6 describes more linier correlation between aromaticity and polar groups of material than between the cellulose crystalinity and polar groups of material. It means that correlation of 2 chemical properties based on both XRD and FTIR spectra is more linier than of physical and chemical properties based on the XRD and FTIR spectra, respectively.
3.4. Morphology
Morphologies of both pyrolized biomass were characterized using SEM. The SEM images of the products are presented in Figure 7-8. Those morphologies show the sphere shapes in the product of hydrothermal-microwave pyrolysis. In other side, the reflux - microwave product shows the block shapes. Number of the spheres are many more than the block shapes. It indicates that formation of the CNS by the hydrothermal - microwave is better than the reflux - microwave.
3.5. Dispersion test
3.5.1. Qualitative dispersion test
Dispersion test was conducted to identify formation of product nanosize. Nanomaterial is included in the dispersion system because the colloid is formed by the dispersed particles which has size of ~ 1 - 10 nm to ~ 500 - 1000 nm (Lubrizol Life Science, 2019). A dispersed system consists of the dispersed phase (particulate) which is distributed throughout a continuous phase (dispersion medium). Based on the dispersed particle size, the dispersion can be classified to 3 kind ones, including molecular dispersion (<1 nm), colloidal dispersion (1-500 nm), and coarse dispersion (> 500 nm) (Sinko & Singh, 2006). The other reference states that dispersion is formed by nanofluid which contains nanoparticles with size less than 100 nm (Mahbubul et al., 2014).
The colloid can be used for characterization with UV-Vis spectrophotometer. The CNS colloids for UV-Vis spectrophotometry are presented in Figure 9 after prepared by stirring at dissolution of 1:1. The UV-Vis spectra is shown in Figure 10 and 11.
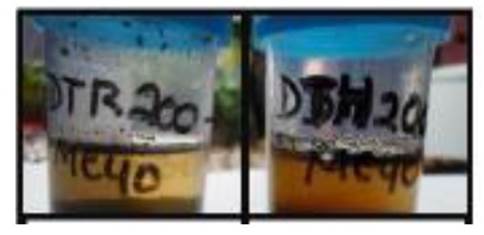
Figure 9 The CNS colloids of the CNSs formed by technique of stirring with magnetic stirrer for 1 h and dissolution of 1:1.
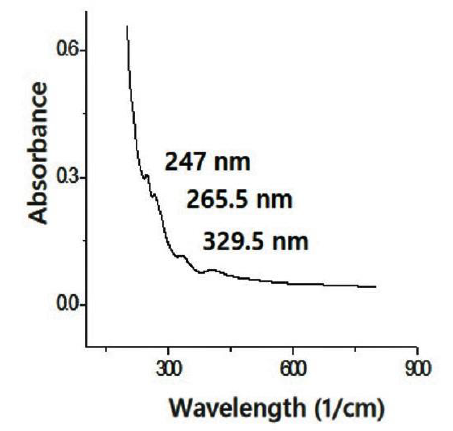
Figure 10 UV-Vis spectra of the CNS from the pyrolized sugarcane leaf by the reflux - microwave method.
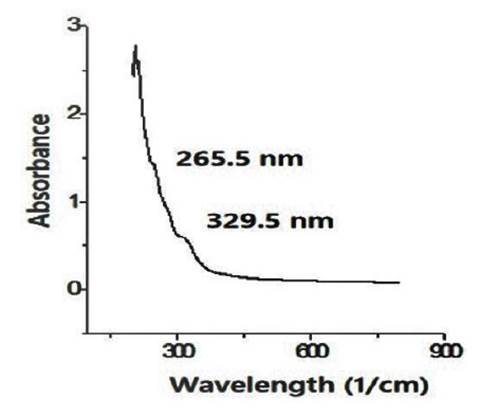
Figure 11 UV-Vis spectra of the CNS from the pyrolyzed sugarcane leaf by the hydrothermal - microwave method (DTH200-MC40).
The UV-Vis spectra shows that the pyrolyzed biomass by hydrothermal - microwave method has 2 peaks in 265.5 nm and 329.9 nm. In other side, the pyrolyzed biomass with reflux - microwave method has 3 peaks, including 247 nm, 265.5 nm, and 329.5 nm. The peak at 265.5 nm is closed to peak of 275 nm in spectrum of carbon dots which indicates π-π* transitions of the C=C bond in aromatic system (Roshni & Divya, 2017). The other peak at 329.5 nm are near to 343 nm related to n-π* transition of C=O vibration (Carvalhoa et al., 2019). The peaks of UV-Vis spectrum at 215-275 nm is an indication of the carboneous material existence because those spectra are resulted by π plasmon resonance in the free electron cloud of carbonaceous material π electrons. This is associated with collective π electron excitations at range of 150-310 nm (Ghanbaria et al., 2013).
For test of colloid stability, the colloids were kept and observed for every about 30 minutes as shown in Figure 12. Three dispersing techniques were studied, including sonication (S), blending (B), and blending - sonication (BS). Observation was done by facing the colloids toward sunlight and the photographs were picked up from the opposite side. The coarse dispersion particles inhibited the sun radiation for penetration of the colloids and made the colloids looked black. In other side, the colloidal dispersion scattered the sun radiation so that the colloid looked transparant.
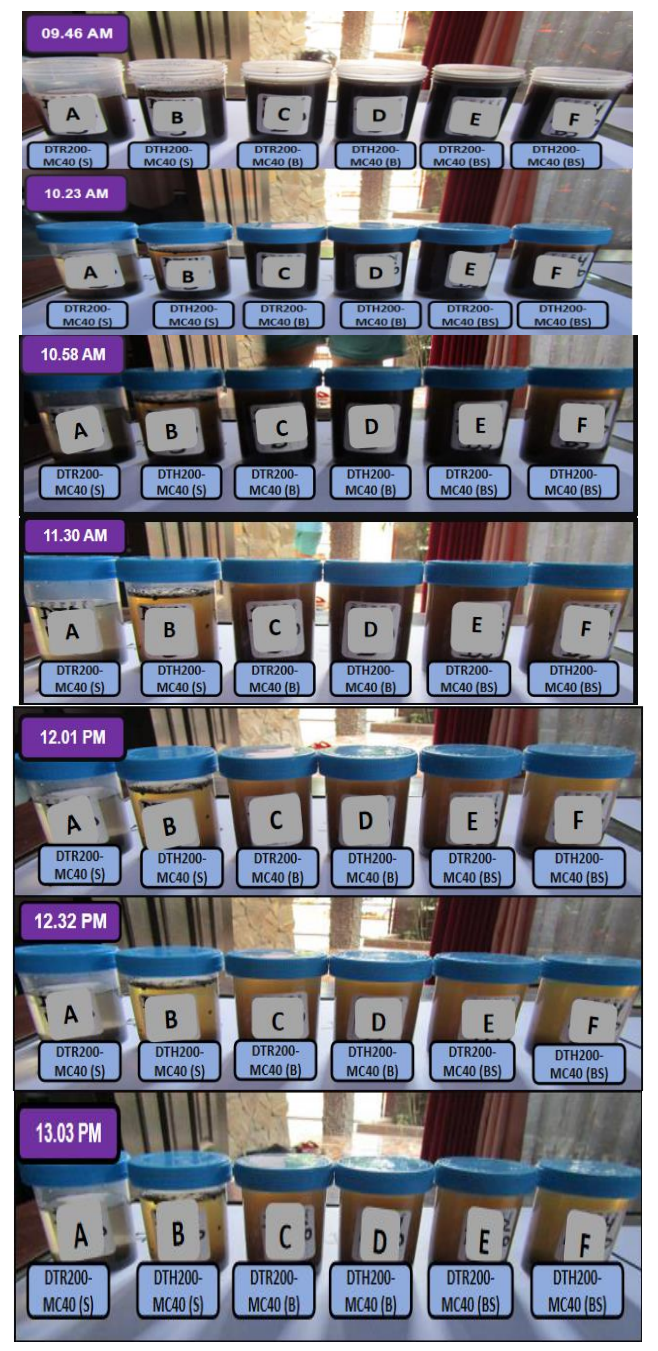
Figure 12 Test of nanocarbons dispersion stability by techniques of sonication (S), blending (B), and blending - sonication (BS).
At the beginning time (at 09.46 AM), Figure 12 shows different influence of the dispersing technique toward physical appearance of the carbon colloids. The colloid which was formed by blending technique (B) looked more black than by sonication (S). It indicates that blending technique is better than sonication to form the colloid. Dispersion by sonication is based on microturbulences due to fluctuation of pressure and cavitation (Hielscher, 2005). Dispersion by blending is based on fast stirring mechanically. Those different actions are responsible toward reduction of solid particle size in dispersion system and produced the different concentration of the colloid.
The colloid includes the coarse colloid (> 100 nm) and the colloidal sol (1-100 nm). The coarse colloid is opaque and can settle down by its own. The colloidal sol is transparant and can be suspended by centrifugation (Young, 2016). By test of stability, presence of both types can be verified. The settling down of the colloids by themselves indicate presence of the coarse colloid which settle down by both gravitation and colloid particle attraction. Therefore, the brown transparant colloids indicate presence of the carbon nanostructure as the dispersed phase which has particle size of 1-100 nm.
From time to time (from 09.45 AM to 13.03 PM), the colloids are supended continuously. This falling down of the particles is probably due to both gravitation attraction and the attraction force of the colloid particles which form the aggregate. Based on the FTIR spectra, the carbon surface has the -OH, C-O, and M-O functional goups. Presence of -OH groups makes the colloid attract each other trough hydrogen bond, including among -OH and between -OH and C-O functional groups. Presence of metal oxide creates possibility to form more attraction force through ion - dipole one.
Test of dispersion stability from 09.46 AM to 13.03 PM shows that the colloid which were prepared by blending (B) and blending - sonication (BS) are more stable than by sonication (S). Qualitatively no significant difference of appearance about concentration of the colloids for the colloids which were prepared by both blending (B) and blending - sonication (BS). The mechanics treatment in blending process may reduce the solid particles better so that create more brown colloid than sonication. However, the concentration of the colloids still needs more verification quantitatively and discussed further in section of 3.5.2.
The different pyrolysis methods also gave influence toward the colloid stabilities. For preparation by sonication, the carbon which was prepared by hydrothermal - microwave (DTH200 -MC40) has better stability than by reflux -microwave (DTR200-MC40). Based on the FTIR spectra, the CNS from pyrolysis of the reflux - microwave method has richer -OH and C-O than the one from pyrolysis by the hydrothermal - microwave. These richer functional groups make stronger dipole - dipole attraction force among surfaces of the CNSs so that improve the aggregation.
For preparation of the colloids by blending (B) and blending sonication (BS), qualitatively no significant influence of the pyrolysis methods toward stability of the colloids. It indicates that influence of the dispersing technique is more dominant than the pyrolysis method. The pyrolysis methods affect formation of the functional groups as verified by FTIR spectra. The dispersing techniques especially affect the size of the dispersed phase particles. Effect of the functional groups towars smaller particles is lower than bigger particles. It may be related to weaker gravitation force on smaller particle solids than on bigger ones.
According to Newton law, each particles of the matter in the universe attract each other proportional to their masses and inversely proportional to the square of the distance between particles (Danby et al., 2017). In the case of colloid, the bigger colloid particles the larger mass of the carbon, the larger gravitation force.
Based on Newton law, another influencing factor is distance of the particles. The nearer the distance of the dispersed particles the larger gravity. This distance is influenced by concentration of the dispersed particles. The higher concentration the colloid the shorter distance of the particles the larger gravitaional force.
3.5.2. Quantitative dispersion test
Quantitatively, the dispersion system can be measured with TDS meter. TDS (Total Dissolved Solid) is defined as a measurement of all inorganic and organic substances in the liquid in molecular, ionized or micro-granular colloidal suspended form which pass through a sieve inwhich the size of two micrometer or 2000 nm (Iccontrols, 2014).
In this research, TDS analysis was conducted using mini TDS meter. Measurement was done before keeping and after keeping the colloids for 11 h (21.00 PM to 08.00 AM). The colloids and TDS measurement process were shown in Figure13 and 14.
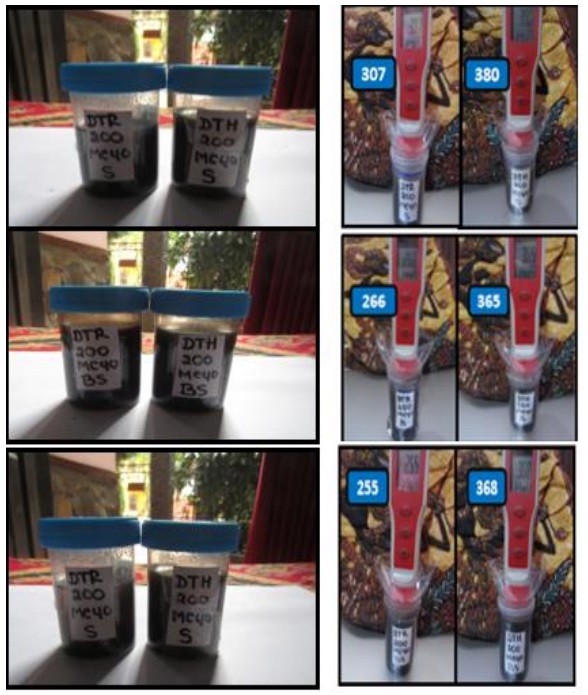
Figure 13 The CNS colloids prepared using the reflux-microwave (DTR200-MC40) and the hydrothermal - microwve (DTH200-MC40) and TDS mesurements using mini TDS meter.
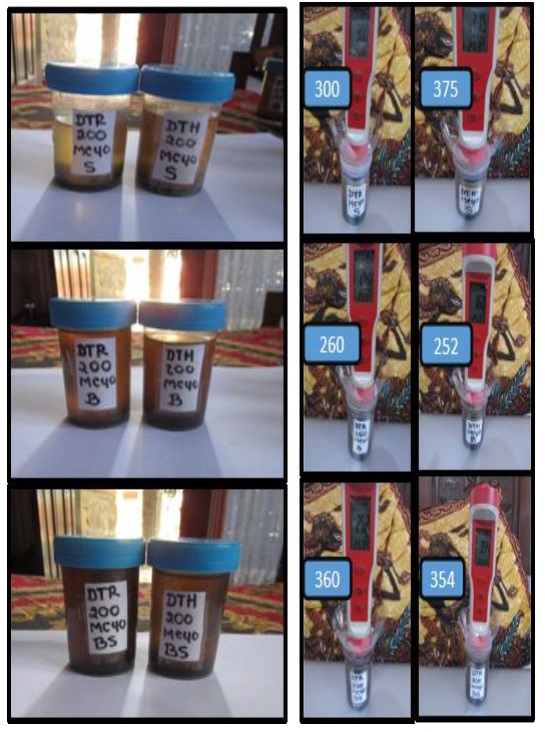
Figure 14 The CNS colloids prepared using the reflux-microwave (DTR200-MC40) and the hydrothermal - microwve (DTH200-MC40) and TDS mesurements using mini TDS meter.
The colloids which were used for measurement of TDS are same with the colloids which were used for test of stability in Figure 12. Before the keeping for 11 h, the appearances of the colloids are same with the colloids at the beginning time of stability test in Figure 12 (at 09.46 AM). However, after re-stability test of the colloids by hand shaking for several times then keeping them for 11 h, the colloid which was prepared by the reflux - microwave method and dispersing technique of sonication (DTR200-MC400) looks more brown than the same colloid after keeping them for about 3 h in Figure 12.
The colloids in Figure 12 were the fresh colloids but the colloids in Figure 13 and 14 are the repeated usage of the same colloids for re-experiment. The keeping of the colloids for almost 1 year probably have reduced the precipited particles as the consequence of attraction force between the water dipoles and the CNS surface dipoles. Reduction of the particle sediment size improve concentration of the colloidal particles in the dispersion system.
Data of TDS for all the colloids before and after keeping for 11 h are presented in Figure 15 and 16. Although appearance of the colloids at the beginning are similar black but the TDS values of the colloids as shown in Figure 15 are different. Based on the different pyrolysis method, generally the TDS of the colloids prepared by the hydrothermal - microwave method (DTH200-MC40) is larger than the TDS of the ones prepared by the reflux - microwave method (DTR200-MC40). The average TDS of the DTH200-MC40 colloid and the DTR200-MC40 colloids are 371.00 and 309.33 ppm, respectively. Higher TDS for the DTH200-MC40 than the DTR200-MC40 indicates content of more colloidal sol particles than coarse colloid particles due to higher pressure of the hydrothermal pyrolysis than the reflux.
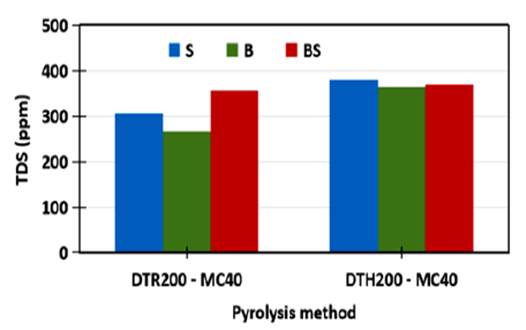
Figure 15 TDS of the CNS colloids resulted by different microwave pyrolysis and different dispersion techniques.
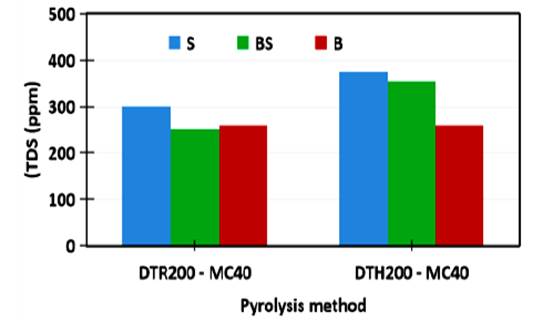
Figure 16 The CNS colloids and TDS of the CNS colloids resulted by different microwave pyrolysis and different dispersion techniques after keeping for 11 hours
Figure 16 shows that after keeping for 11 h, The average TDS decreased to become 329.67 and 270.67 ppm for the DTH200-MC40 and DTR200-MC40, respectively. This changing is related to the physical changing of the color from opaque - black to transparant - brown in Figure 13 and 14. By consideration that:
The reflux - microwave pyrolysis can produce larger carbon particles due to lower pressure pyrolysis
The coarse colloid can be settled down by gravitation or without centrifugation like the colloidal sol
Therefore, decreasing of more TDS for DTR200-MC400 after keeping 11 h indicates the decreasing of the coarse colloid. It is probably caused by aggregation of the coarse colloid particles to form the sedimented particles chemically through intermolecular force such as hydrogen bonding as ilustrated in Figure 17 and also by gravitation physically
Before keeping for 11 h, the sonicated colloid (S) gave higher TDS than the blended colloid (B) whereas no significant different appearance. After keeping for 11 h, the sonicated colloids (S) had higher TDS than the blended one (B), whereas the sonicated colloid (S) has more transparant and lighter brown than the blended colloid (B), so that TDS mainly described the colloidal sol concentration more than the coarse colloid concentration. It indicates that sonication is more effective to poduce the colloidal sol than the blending technique.
The blended - sonicated colloids (BS) had same or higher than the blended colloid (B) for DTH200-MC40 and DTR200-MC40, respectively. Higher TDS is caused by the significant influence by sonication treatment. The influence of sonication is more significant for DTR200-MC40 than DTH200-MC40 because its polarity (based on fungtional groups) is higher than DTH200-MC40 so that effect of sonication is more effective.
4. Conclusions
This research has conducted some experiments, including synthesis of carbon nanomaterial from sugarcane leaf biomass by different combination of the hydrothermal - microwave method resulted in the darker product, higher crystalinity index, less oxy surface functional groups, and higher concentration of colloid, many more nanoparticles than the reflux - microwave one. The different method combination caused the different nanoparticle shapes, i.e carbon nanosphere the hydrothermal - microwave pyrolysis method and carbon nanoblock by the reflux - hydrothermal one. Correlation of aromaticity and polar group fraction was more linier than of cellulose crystalinity index and polar groups fraction. The test of dispersion stability showed that qualitatively sonication gave the most transparant brown colloid and after keeping for 11 h, the sonication gave the highest TDS.


 nueva página del texto (beta)


