


 nueva página del texto (beta)
 Inglés (pdf)
 Artículo en XML
 Referencias del artículo
 Enviar artículo por email
 Citado por SciELO
  Similares en
SciELO
Similares en
SciELO 
 Permalink
1. Introduction
Membrane filtration technology is used extensively in industrial applications. Nonetheless, fouling of the membrane is the biggest issue in membrane applications because it involves relatively high capital, operational and membrane costs (Ghernaout, 2018). Membrane cleaning has been widely studied and practiced to solve the fouling problem and ultimately reduce costs in membrane technology application. Fundamentally, fouling of the membrane can be classified as either reversible or irreversible fouling (Chang et al., 2002; Zularisam et al., 2006). Physical or chemical cleaning are options to remove foulants and contaminants attached to the membrane surface or within the pores of the membrane using various cleaning agents and techniques (Fujioka et al., 2018; Goosen et al., 2005; Gul et al., 2021; Le-Clech et al., 2006; Loganathan et al., 2015; Wang et al., 2014). As a result, membranes can be reusable after their cleaning and disinfection without disposing of or replacing them with new membranes. Chemical usage for membrane cleaning should be optimized to reduce recovery costs and safety concerns.
Different membrane materials have different degrees of water permeability to transmembrane pressure (TMP) and respond differently to types of chemicals used for cleaning procedures (Cheryan, 1998; Lee et al., 2016). Starchy suspensions as effluents usually are treated by conventional methods, and few reports are found in the literature related to membrane technology (Moghaddam & Sargolzaei, 2012).
Microfiltration has been applied for the extraction of amaranth starch from starch milk containing 2.16% total solids, 1.10% starch, 0.54% non-starch polysaccharides, 0.33% protein, 0.09% fat, 0.10% ash, and a pH of 6.7. A water flush to remove loosely bound material and a hot 0.2 M NaOH solution wash to remove adsorbed organic material were ineffective methods to recover membrane permeability. The membrane used for all trial work was a Pellicon 2 Ultracel PLCXK membrane (Millipore). This had a flat plate (cassette) configuration, a filtration area of 0.1 m2, a nominal molecular weight limit (NMWL) of 1000 kDa and was constructed of regenerated cellulose (Middlewood & Carson, 2012). Following the two-step cleaning cycle, the membrane was stored overnight in 0.1 M NaOH, recovering permeability up to only 66%. Further cleaning using Triton X-100 and phosphoric acid washes recovered permeability up to 76%. The use of Triton X-100 was basically because amaranth starch contains proteins, and this detergent is used to extract proteins from cells and used in membranes clogged with proteins.
It is reported that after processing high starch concentration suspensions, the combination of low crossflow velocities and/or high transmembrane cleaning procedure functioned better to recover membrane permeability. For the experiment, a module of four tubes with an internal diameter of 18 mm and a length of 1.83 m, offered an effective membrane area of 0.35 m2. (Shukla et al., 2000). In addition, Shukla and coworkers found that the effectiveness of a sequence of chemical and enzyme cleanings somehow depended on the order in which the chemicals were applied. The most used chemical for cleaning fouled membranes is NaOH; however, its usage is limited by the properties of the material used for the manufacturing of the membranes (Antón et al., 2015). The most efficient membrane cleaning procedure recovered almost 90-96% permeability, depending on the application and membrane type (Filloux et al., 2015; Jepsen et al., 2018).
This study sought to find the most efficient process for cleaning the MF membranes used for the concentration of sago starch suspensions. At the end of the MF process by tangential flow filtration, the membranes were rinsed with tap water. The methods were evaluated with respect to their normalized permeate flux (NPF) and normalized water permeability (NWP).
2. Materials and methods
2.1. Microfiltration membrane cassettes
A microfiltration polysulfone flat sheet membrane filter cassette (Centramate cassette, Pall Corporation, USA) with a surface area of 0.1 m2 and pore size 0.45 m (PSM45C110.45 m) was used. Initial water permeability analysis, reported as NPF and NWP of a clean MF membrane cassette (Pall Corporation, USA), was necessary prior to any experiment for purposes of comparison. Dirty MF membrane cassettes (cassettes used in the tangential filtration process for the concentration of 1% and 3% model sago starch suspensions) were the focus of this study.
During processing of the starch suspension by TFF, the membranes were clogged by starch granules, and these were designated “dirty membranes”. Firstly, the dirty membrane was washed with tap water to remove the starch on the membrane surface, which was an easy process, then the membranes were rinsed with distilled water. The permeability was measured to ascertain the efficiency of the first cleaning. After the first cleaning, we proceeded to wash the membrane by a backflushing or suction method and the permeability was measured. Finally, after completing the second cleaning permeability, the chemical method and the same process to measure the permeability were applied. The permeating flux was measured as a function of the membrane area and the transmembrane pressure applied, and then the third permeability was reported.
All the procedures for TFF, starch suspension preparation, and membrane cassette characteristics are reported elsewhere (Siong et al., 2019). The chemical used for cleaning MF membranes was NaOH, and in order to neutralize it, 1 MH2SO4 solution was used (Fisher Scientific, Pittsburgh, PA)and rinsed with distilled water to eliminate all residual chemicals.
2.2. Membrane cleaning protocols
Table 1 summarizes the six different cleaning processes used for recovering permeability. Each cleaning process was tested using distilled water on three different dirty membranes labelled 1, 2, and 3. All procedures were repeated two times to evaluate the NPF and NWP using distilled water and the average of these two repetitions was reported.
Table 1 Chemical and physical cleaning processes for membrane permeability recovery.
| Cleaning type | Cleaning process | Process time per unit* | Cleaning agent |
|---|---|---|---|
| Chemical | 1-h Forward flush | 1- h | 0.2M NaOH |
| 12-h Forward flush | 12 - h | ||
| Agitation | 1 day | ||
| Soaking | 1 day | ||
| Physical | Suction | 10 minutes | Distilled water |
| Backward flush | 10 minutes |
*Each run of the cleaning process was applied the same way for the 1st, 2nd or 3rd time.
2.3. Forward flush
This process follows the membrane cassette care and use procedures (Pall Corporation) user guide. As illustrated in Fig. 1A, the feed, retentate, and filtrate tubes were placed in the same 0.2 M NaOH solution at 70-80 °C. Used membranes were stacked together in a TFF cassette holder when cleaning. A 0.2 M NaOH solution at feed flow of 4.5 L/min (2.7 m/s) was recirculated in the forward direction in the TFF for 1 h. Meanwhile, the retentate and filtrate generated were recirculated and reused as feed suspension to keep the volume constant. Similarly, another cleaning process used was the same as described above, but with the cleaning period extended from 1 h to 12 h.
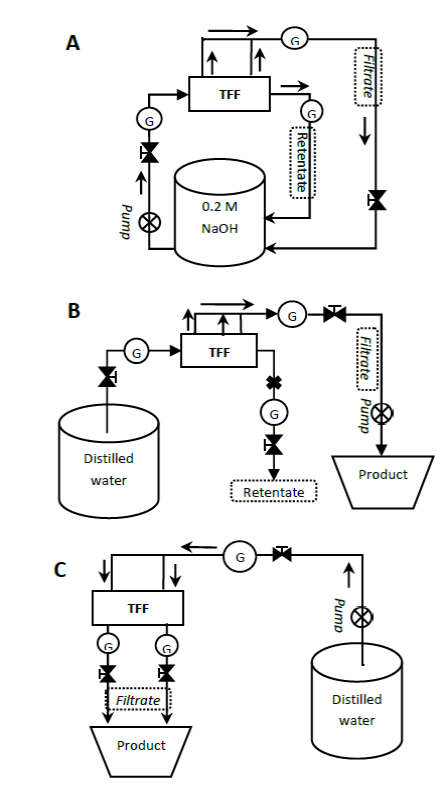
Figure 1 Schematic diagram of the experimental setup for the cleaning methods of the membranes. A) 1-h or 12-h forward flush method where the retentate and filtrate were returned to the same source to keep the volume constant. B) Suction method. Distilled water was used as a cleaning agent. C) Backward method. Membranes were treated by reversing the flux of distilled water via the permeating route. Symbols: G Pressure gauge; ⊗: Peristaltic pump; X: Route closed; →flow.
2.4. Agitation method
Initially, all used membranes were soaked in a 5-L plastic jug containing a 0.2 M NaOH solution at 70-80 °C and agitated at 100 rpm using an orbital shaker (Yihder TS-560D) for one day.
2.5. Soaking method
Used membranes were soaked in a 2 L graduated measurement cylinder containing a 0.2 M NaOH solution at 70-80 °C in a static condition for one day.
2.6. Suction method
A 2 L volume of distilled water was used as feed while an empty measuring jug was placed at the filtrate exit for collection as depicted in Fig. 1B. The retentate valve was kept closed while sucking. The pump rotation was set in a clockwise direction and operated for 10 min per cleaning cycle at an initial speed of 50% of its capacity.
2.7. Backwashing method
Membranes were treated by reversing the flux of distilled water via the permeate route for 10 min as illustrated in Fig. 1C. The pump was operated at approximately 3.5 L/min (40% of the capacity) in the reverse direction. The membrane was backflushed with distilled water from permeate to feed and retentate. With all valves open, the dirty flux was collected from feed and retentate exits. The addition of distilled water to the 2-L measuring jug was necessary to prevent loss of water for pumping.
2.8. Post-cleaning and membrane permeability recovery
After completing the chemical cleaning, the remaining NaOH in the membrane cassette was neutralized using 1 M H2SO4 and rinsed using distilled water through the TFF system to eliminate all residual chemicals. Permeate flux was also measured at TMP of 0.125 bar, 0.25 bar, 0.375 bar and 0.50 bar. For every process described, NPF versus TMP, NWP versus TMP and membrane permeability recovery were graphed to find the most efficient process.
Table 2 shows the calculations used for membrane recovery.
| Equation | Description |
|---|---|
|
Permeate flux
(L/m2h) (Eq. 1) Q: Filtrate flow (L/h) S: Filtration area (m2) |
Volume of permeate generated during processing time of filtration per membrane surface area. (Adham et al., 2006; Water Environment Federation, 2006) |
|
Normalized permeate flux
(L/m2h) J T : Actual flux at temperature T (L/m2h) |
The actual permeate flux at temperature T is corrected to a standard temperature of 20oC for microfiltration (WEF, 2006). |
|
Normalized water permeability
(L/m2h/bar) TMP: Transmembrane pressure (bar) |
The normalized permeate flux at 20(C per unit pressure of driving force (WEF, 2006). |
|
Transmembrane pressure (bar) P F : Feed pressure (bar)P R : Retentate pressure (bar)P P : Permeate pressure (bar) |
The driving force for the water to pass through the membrane in a crossflow membrane system (Ognier et al., 2002; WEF, 2006). |
2.9. Model analysis
The general form of the resistance-in-series model represented by Equation 5 was used to quantify the contribution of each fouling mechanism to overall flux decline:
where J = flux [mˑs-1]
ΔP = applied transmembrane pressure [Pa].
Rt = total resistance.
Rm= intrinsic membrane resistance (pure water resistance) [m-1].
Rcp = resistance removable by rinsing (concentration polarization exerted by the feed solution and removed by rinsing) [m-1].
Rpr = resistance removable by backwashing (cake formed on the surface or in the pore, not removable by rinsing but removable by backwashing) [m-1].
Rcr = chemically reversible resistance (internal fouling, a portion of the total resistance removable only by chemical cleaning) [m-1].
Rif = chemically irreversible resistance (residual resistance after chemical cleaning) [m-1].
Each resistance was obtained by designing a series of filtration experiments measuring the flux at the end of each filtration step at a given temperature and pressure. Rcp term was obtained from the difference between the final feed flux and the pure water flux after rinsing the membrane using distilled water. Rpr was calculated after backwashing the membranes. The operating pressure when the remaining resistance is Rt-Rcp-Rpr, Rcr was obtained after chemical cleaning from the residual resistance (Rt-Rcp-Rpr-Rcr), and finally Rif was back-calculated from the difference between Rt and the sum of resistances calculated so far, i.e., Rm, Rt, Rcp, Rpr, and Rcr.
2.10. Statistical analysis
The means of the data were compared using two-way analysis of variance (ANOVA) to examine the significant differences (p=0.05) between treatments (TMPs) and membrane conditions (clean, clogged and recovered). Tukey’s test for multiple comparisons among all group mean values was also conducted and the normality of the data was assessed by the Shapiro-Wilk test. All statistical analyses were performed using GraphPad Prism version 5.
3. Results and discussion
3.1. 1-h Forward flush method
Fig. 2 illustrates the effect of employing 0.2 M NaOH recycling process for 1 h in recovering NPF and NWP for membranes 1, 2, and 3. After filtering sago starch suspensions in the laboratory, NPF of the three used membranes significantly reduced up to 80% (Fig. 2: A, B, and C ). The NWP of clogged membranes also declined at least 76% and remained consistent with increase of TMP (Fig. 2: D, E, and F ). The low flux is the consequence of the clogging of the membrane surface and pores with sago starch. Internal membrane blocking would be an important mechanism responsible for the decrease of permeating flux (de Bruijn & Bórquez, 2006).
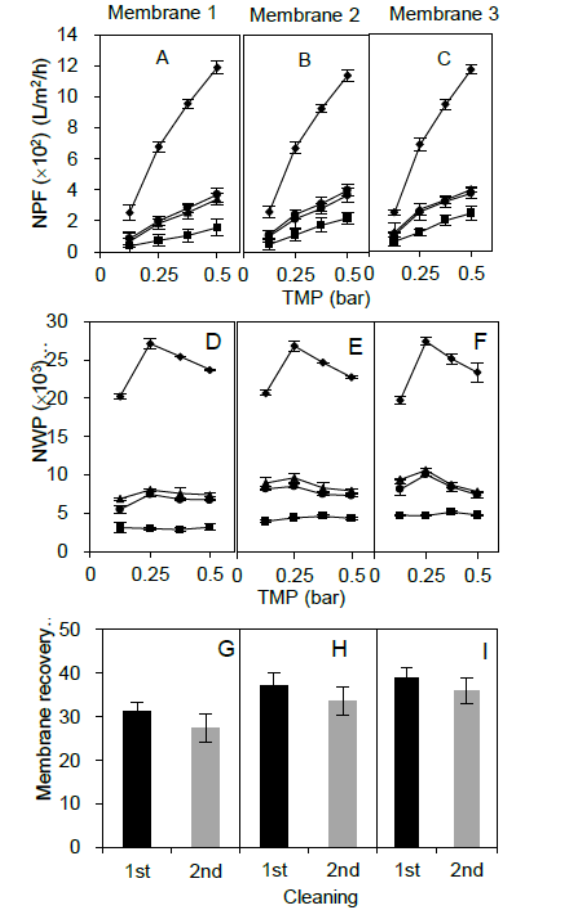
Figure 2 Effect of the cleaning protocol on the membrane permeability using 0.2 M NaOH solution for 1-h recycling method. NPF (A, B, and C), NWP (D, E, and F) and membrane recovery (G, H, and I) of three different membrane cassettes (1, 2, and 3). Symbols: ■ dirty membrane performance; ▲ membrane performance after 1st cleaning procedure; ● membrane performance after 2nd cleaning procedure; ◆ clean membrane performance.
The first h of recycling restored the permeated flux and water permeability of the membrane from 31 to 39% (Fig. 2: G, H, and I ). Concordant with the recovery of permeability, the effluent of NaOH solution contained starch residues. The presence of starch residues was a result of the reaction between NaOH and starch since NaOH can hydrolyze starch and weaken the attachment of foulants to membrane materials (Lim & Bai, 2003). Hence, the NaOH not only facilitated the removal of the starch entrapped on the membrane surface but also drove starch out of the membrane itself.
The second run of membrane cleaning, however, could not further enhance the water permeability of the membrane; on the contrary, membrane recovery reduced by 3 to 4% during second cleaning (Fig. 2: G, H, and I ). This effect was mainly due to the starch fragments remaining in the NaOH solution that were initially derived from the first cleaning and being reintroduced into the membrane during the second-time recycling. Not only the impurities present in the water but also the cleaning agent itself can certainly affect the recovery of the efficiency of any membrane, as studied by Tran-Ha and Wiley, (1998) . Relatively high significant differences were discovered between membrane conditions (clean, dirty, and recovered) (p<0.001) except between first recovery and second recovery, where lower significant difference was found (p<0.05).
3.2. 12-h Forward flush method
Extending the time to 12 h of NaOH recycling slightly improved water permeability and permeated flux for all membranes (Fig. 3). Unlike a clean membrane, the NPF of clogged membranes increased gradually with TMP (Fig. 3: A, B, and C) due to low permeation drag during permeation caused by retained starch on the membrane surface and in membrane pores. After the first cleaning, the mean of recovered fluxes (L/min/h) was in ascending order of 128.4±15.8 < 277.0±28.5 < 328.6±25.7 < 371.0±6.3 with every 0.125 bar of increased TMP. After second cleaning, the fluxes became 111.0±21.9 < 254.4±18.1 < 305.0±16.6 < 343.1±20.3. Membrane permeability recovered from 37% to 43% in the three membranes after the first 12 h cleaning (first recovery). In contrast, NWP recovery after the first 1 h cleaning was only from 31 to 39% (Fig. 3: G, H, and I ). Results demonstrated that a longer period of membrane cleaning with this method removed more entrapped starch particles in the membrane due to a possible hydrolysis of the starch. Overall, recovery percentage was like the 1 h recycling technique where the three membranes showed a small decrement in NPF and NWP after the second cleaning (Fig. 3: A and D ).
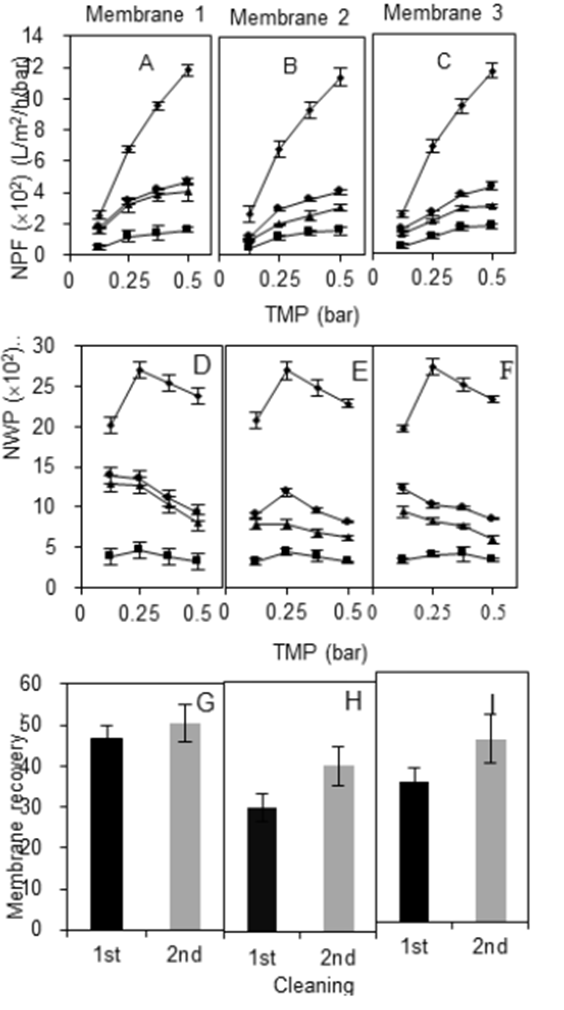
Figure 3 Effect of the cleaning protocol on the membrane permeability using 0.2 M NaOH solution for 12-h recycling method. NPF (A, B, and C), NWP (D, E, and F) and membrane recovery (G, H, and I) of three different membrane cassettes (1, 2, and 3) after the first and the second cleaning. Symbols: ■ dirty membrane performance; ▲ membrane performance after 1st cleaning procedure; ● membrane performance after 2nd cleaning procedure; ◆ clean membrane performance.
The lower NPF effect was due to starch residues in the NaOH solution from the first recovery producing a lower quality cleaning agent and thus degrading the cleaning efficiency. There were significant differences in NPF and NWP between membrane conditions (clean, clogged and recovered) (p<0.05). Meanwhile, the NPF and NWP between first and second recovery were barely significantly different (p<0.05). Water permeability after first and second recovery averaged 40% and 36%, respectively (Fig 3: G, H, and I ). However, the difference in recovery between long (12 h) and short (1 h) durations was not significantly different.
Therefore, not much improvement was shown in flux and recovery of permeability despite a longer forward flushing duration. It was also discovered that the colorless NaOH solution had turned to a pale-yellow color after being recycled (Fig. 3 E ). Due to the high pH, the starch residues were washed out or partially removed from the membrane surface, and the residues could be clearly observed with the naked eye.
3.3. Agitation method
Soaking the membranes in 0.2 M NaOH and agitating the membranes in a rotary shaker yielded better results than the previous techniques. As presented in Fig. 4, the recovered NPF and NWP of membranes 1, 2, and 3 achieved higher values than the previous methods.
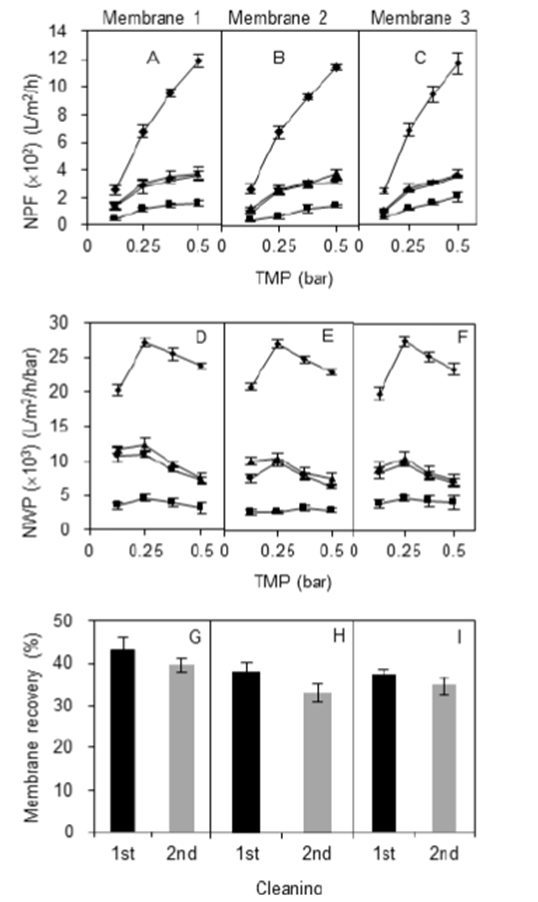
Figure 4 Effect of the chemical cleaning protocol on the membrane permeability using gentle agitation. NPF (A, B, and C), NWP (D, E, and F) and permeability (G, H, and I) of three different membrane cassettes (1, 2, and 3). Symbols: ■ dirty membrane performance; ▲ membrane performance after 1st cleaning procedure; ● membrane performance after 2nd cleaning procedure; ◆ clean membrane performance.
In the first cleaning, the NPF of membranes 1, 2, and 3 increased in the order of 125.1±33.1 L/m2h < 240.7±68.9 L/m2h < 306.9±68.9 L/m2h < 335.1±58.8 L/m2h at respective fixed TMP of 0.125 bar < 0.25 bar < 0.375 bar < 0.50 bar. After the second cleaning, permeate flux increased and became 23% higher than the first recovery. The mechanical agitation improved the efficiency of cleaning by promoting the separation of starch loosely attached to the membrane. Then, the occluding material was swept through the entrance and exit of streams of the membrane (feed, filtrate and retentate) while the membrane was still soaking in NaOH solution. The color of NaOH solution changed to pale yellow after cleaning, like Fig. 5.
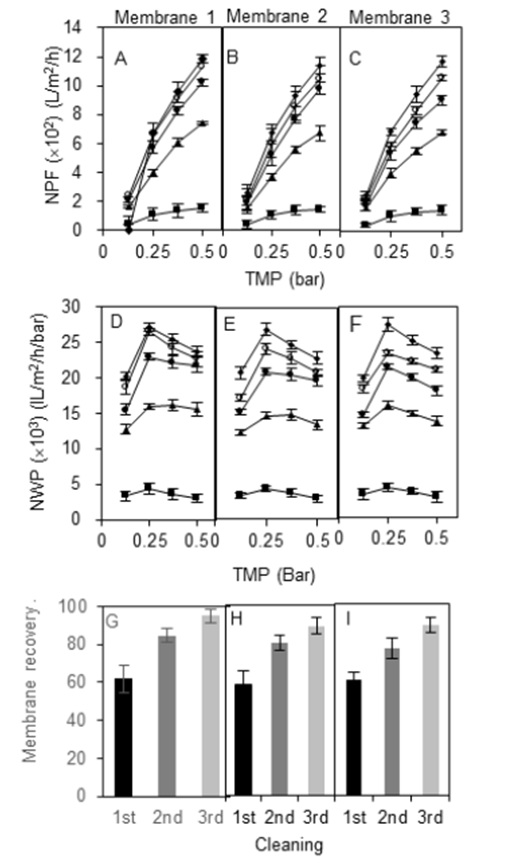
Figure 5. Effect of the cleaning protocol on the profile of membranes permeabilities after their soaking in stagnant 0.2 M NaOH solution. NPF (A, B, and C), NWP (D, E, and F) and permeability (G, H, and I) of three different membrane cassettes (1, 2, and 3). Symbols: ■ dirty membrane performance; ▲ membrane performance after 1st cleaning procedure; ● membrane performance after 2nd cleaning procedure; ◆ clean membrane performance.
After first cleaning, 47%, 30% and 33% of NWP was recovered from membranes 1, 2, and 3 respectively, increasing to 50%, 40% and 44% during second cleaning (Fig. 4: D, E, and F ). Almost all the NWP and NPF estimated among the membrane conditions were significantly different (p<0.05). However, the restoration of water permeability of the three membranes by using this method was still relatively poor.
3.4. Immersion method
Soaking the membranes under stagnant conditions showed the best result among the chemical cleaning methods. The degree of improvement in NPF, NWP and percentage recovery is shown in Fig. 5.
The longer the immersion of the membrane in 0.2 M NaOH solution, the greater the recovery of permeability. After the first cleaning, membrane permeability could reach approximately 60% with NWP from 12720±426 to 15520±702 L/m2h/bar (Fig. 5: D, E, and F ). Recovery increased to 80% after the second cleaning, with NWP falling in the range of 15410±956 to 21720±1063 L/m2h/bar. Since the degree of improvement of NPF and NWP was encouragingly high with this method, a third round of cleaning was conducted. Soaking for the third time indeed further recovered water permeability by 91% on average. Furthermore, NPF also showed a significant increment for each membrane (Fig. 5: D, E, and F ). High significant differences at p < 0.05 were found in NPF and NWP among membrane conditions.
These results demonstrated that a stagnant NaOH solution is more efficient to remove most retained starch under both reversible and irreversible conditions. In many published studies, the chemical cleaning process has been the main defouling method of the materials used in the manufacturing of the membranes (Luján-Facundo et al., 2015).
Other factors may have contributed to the effectiveness of this method. For instance, the vertical position of membranes placed in a cylinder (Fig. 5: A and B ) facilitated the release of starch via possible opening holes (feed, filtrate or retentate) located at the bottom of the membrane due to simple gravity force.
This procedure tended to restore more flux and NWP after the third cleaning compared with the other three cleaning methods. Studies have clearly reported that chemical cleaning has high potential to restore the flux to almost 100% water permeability of the membrane. For instance, the technique of soaking the fouled membranes in 0.1 M NaOH for 18 h has been applied without finding significant recovery of the permeability (Middlewood & Carson, 2012). The enhancement of the permeability was evident after soaking the membrane in 0.1 M NaOH followed by soaking in a solution of glucoamylase and a final step of washing with a hot solution of 0.2 M NaOH. The entire protocol they applied to recover the permeability up to 90% was intensive, using various reagents. In this study, the soaking technique using only 0.2 M NaOH was enough to recover permeability.
A clean membrane should have the best trend line of NWP, which usually looks like the head of an arrow as TMP increases (Fig. 5: B, E and H ). Initially, as performed by the clean membranes, NWP increased as TMP increased from 0.0125 to 0.25 bar, with 0.25 bar having the highest and most efficient permeability. Then, it declined moderately when TMP continued to increase from 0.375 to 0.50 bar. In contrast, the trend line of NWP for clogged or dirty membranes became almost a straight line as TMP increased, indicating abnormal permeability. However, the trend line returned to its original pattern after several rounds of the recovery process (Fig. 5: B, E, and H ). Among the chemical cleaning methods, soaking was most effective in recovering permeability yielding the trend line most like a clean membrane.
The NaOH solution changed its color while soaking from colorless to pink after a day of immersion not immediately but gradually, depending on the dirtiness of the used membrane. This data is presented as supplemental material (Fig. S1). For example, membranes used to treat 1% starch suspension turned the NaOH solution to a soft pink color (Fig. S1A) compared to the darker pink color developed during the treatment of 3% starch suspension (Fig. S1B). This color change happened due to the chemical reaction between NaOH and the hydroxyl groups (-OH) present in the polyphenolic compounds in the sago palm fibers, mainly DL-epicatechin and D-catechin (Okamoto et al., 1985). catechins. This effect was confirmed by the formation of radicals during the autoxidation of four tea catechins, (-)-epicatechin (EC), (-)-epigallocatechin (EG), (-)-epicatechin gallate (ECg) and (-)-epigallocatechin gallate (EGg) in their alkaline solutions, following the change of intensity of colored substances by oxidation (Yoshioka et al., 1991).
It was observed that before the immersion (soaking) of the cassettes in the NaOH solution, the permeate obtained from the cleaning process of the membrane using NaOH solution, changed from colorless to a light pale-yellow color after a certain time, as shown in Fig. S1C. The remaining fibers in the starch are the reason for developing the color of the suspensions, especially when NaOH is used as a cleaning agent.
Fig. S1 shows the brown-colored surface of the membrane cassette observed in all used or clogged membranes. High starch concentration (3%) caused over-fouling of the membrane with starch deposited at the opening hole on the feed side of the membrane (Fig. S1C).
This phenomenon prevented the suspension from flowing into the membrane cassette and thus significantly reduced filtrate flux and increased TMP. However, the main reason was the attachment of sago tree fiber particles. During the manufacture of the sago, the process used to separate the starch is a wet process, essentially by washing. Although the quality of the starch is as high as 86%, it contains around 0.5±0.1% fiber mixed with it. The recovery of bioactive compounds could be important for medical use (Ruengdech & Siripatrawan, 2021). For instance, using tubular ceramic membrane with pore diameter of 0.2 μm at 30-40 °C, a crossflow velocity of 5 mˑs-1 and a ΔP of 2.6 bar, the impact of the process was assessed focusing on bioactive compounds and physical characteristics of the concentrates (carotenoids, lycopene, hesperidin, and pectin) (Hammad et al., 2021).
3.5. Suction method
Suction is a physical cleaning process that is both safer and potentially cost-effective since it does not use any chemical reagent. However, there were zero improvements after first and second cleaning (Fig. S2: C, F, and I), with NPF and NWP in the range of 49.54±0.91 to 176.97±0.83 L/m2h (Fig. S2: A, D and H) and 3962.67±72.57 to 3539.67 L/m2h/bar (Fig. S2: B, E and H) respectively. The percentage of recovery also remained constant between cleanings. This occurred because the equal air pressure between the atmosphere and within the TFF system created a non-vacuum condition. Eventually, the distilled water failed to enter the feed route of the filtration system by suction. Thus, water was absent for flushing the membrane while the remaining water within the membrane cassette was sucked out. At the same time, the remaining water carrying some portion of starch particles was discharged from the membrane cassette. However, this small amount of starch removal did not cause any significant changes in NPF and NWP.
No significant differences were found between dirty and recovered membranes (p>0.05) after first or second cleaning. Results show that the suction method was entirely ineffective in removing starch residue or recovering permeability. However, Schoeberl et al., reported that a suction time of 8 min has a higher potential for fouling removal than both backwash time (25-45 seconds) and aeration intensity (0.3-0.9 m3/m2. H) (Schoeberl et al., 2005).
3.6. Backwash method
Backwashing is another physical cleaning process that is often effective in removing foulants deposited on the membrane surface. It is a chemical-free and safer method that does not require a long time (< 1 h). In this study, however, the result was relatively weak (Fig. S3), in part because only distilled water was used as a cleaning material (Nguyen & Roddick, 2011).
After the first backwash, partial improvement was seen, with NPF and NWP falling respectively in the range of 96.0±6.0 to 321.8±18.1 L/m2h (Fig. S3: A, D, and G) and 7681.0±482.0 to 6435.3±360.9 L/m2h/bar (Fig. S3: B, E and H) respectively from unrecovered (dirty membranes) flux (47.8±4.8 to 161.3±5.1 L/m2h) and NWP (3825.0±384.5 to 3225.3±102.0 L/m2h/bar). The average between unrecovered (dirty membrane) and first recovered flux and NWP were significantly different at p<0.05. However, no significant differences were found between cleanings (p>0.05), since most reversible starch granules were removed by the first cleaning, leaving only irreversible starch granules which are typically removed by chemical agents (Lin et al., 2010). For example, flat sheet type membranes fouled by complex organic soluble materials were effectively cleaned in only 60-90 min using sodium hypochlorite (100-600 mg/L) as an oxidant chemical (Lee et al., 2016). They demonstrated that membrane resistance is governed by chemically enhanced backflush bulk reaction and the transport, penetration, and back transport of sodium hypochlorite.
In this study, NWP was restored to only 31-35% by backwashing (Fig. S3: C, F, and I). Furthermore, the trend line pattern of NWP was dissimilar to the clean pattern, meaning the water did not permeate properly. Upon backwash, some amount of starch was dislodged from membrane pores and surfaces and lastly released from the membrane cassette (Johnson, 2008). In this study, the backwash sample contained mainly starch residues instead of clear distilled water, causing an increase in flow area for permeation (Liao et al., 2004). Therefore, backwashing performed more effectively and efficiently than suction as a physical membrane cleaning method.
This study found that 10 min backwashing with a total flow of 3.5 L/m2h caused a large amount of distilled water loss during backwash. Longer duration, greater frequency and higher pressure have been shown to improve membrane cleaning, but this would likely result in greater loss of permeation during backwash (Judd & Judd, 2011; Mores & Davis, 2002). Moreover, increases in backflushing period, as well as backflushing frequency, were found more efficient on fouling removal (Le-Clech et al., 2006). Developing an effective backwashing method would likely entail high consumption of energy and permeate.
3.7. Fouling index
The cleaning protocol, evaluated in terms of membrane resistance as reported in Table 3, showed that resistance removable by rinsing (Rcp) at 58% of the total resistance reached the highest value, Thusly, resistance is dependent on process time. A longer processing time promoted a thicker layer of starch on the membranes. While this resistance was not difficult to remove, it controlled the overall efficiency of the filtration system. It was also dependent on the concentration factor where the removal of water increased the accumulation of the starch. The rest of the resistance was distributed proportionally and was eliminated by applying the cleaning protocol. It is worth noting that the longer the membrane cassettes were immersed in NaOH, the deeper the cleaning of the membrane.
Table 3 Resistance of each fouling mechanism to overall flux decline
| Resistances of the membrane [L/m] | Membrane resistance (%) |
| Rm= intrinsic membrane resistance | 8.6 ± 0.6 |
| Rcp = resistance removable by rinsing | 58.3 ± 3.3 |
| Rpr = resistance removable by backwashing | 13.9 ± 1.2 |
| Rcr = chemically reversible resistance | 10.2 ± 1.0 |
| Rif = chemically irreversible resistance | 9.0 ± 0.7 |
Δp = applied transmembrane pressure [Pa]
The main finding of this research is that for the processing of starch suspension by TFF, it is not appropriate to work at high transmembrane pressures because it results in a more severe degree of clogging. Consequently, this level of clogging is more difficult to remove because it becomes an irreversible resistance. Middlewood and Carson (2012) used 0.1 M NaOH, and did not obtain good results in removing this resistance by immersing the membranes in the solution, firstly because of the nature of the starch and because of the low NaOH concentration. Another effect that possibly helped to eliminate the seemingly irreversible resistance was the NaOH solution, used at 70 °C, and the exposure time until the solution reached room temperature (around 26 °C). The duration of chemical cleaning has not been adequately discussed in the literature. During cleaning, sufficient time is required for the reaction of chemical agents with the clogged materials. Flux recovery increases by increasing the cleaning time at the early stage of cleaning (Gul et al., 2021). Under these conditions it is very possible for the starch to gelatinize and be converted to glucose which was demonstrated qualitatively (data not shown) by the Miller method (Miller, 1959) . Then, it emerged that 12 h immersion was enough to recover permeability. Furthermore, the effect of NaOH on starch granules is well documented in the literature. Microscopic studies revealed that addition of NaOH solutions to a starch dispersion induced immediate and rapid swelling of the starch granules at room temperature. On heating, granule swelling was more pronounced in the presence of NaOH. At high temperatures, the granule remnants were smaller and more dispersed in the presence of NaOH (Roberts & Cameron, 2002). The gelatinized starch acquires an amorphous conformation as the gelatinization phenomenon proceeds (Ratnayake & Jackson, 2008) and could be expelled from the membrane pores by transmembrane pressure. It is important to remember that MF membranes have an anisotropic structure, and this makes their plugging somewhat irregular. However, as reported in Table 3, Rcp represented a high percentage of clogging, though it was relatively easy to remove it. Another explanation about permeability recovery is that the design of the filtration system allowed an increase in the number of cassette units, then it was possible to work with 0.1, 0.2, and 0.3 m2. It was observed that increasing the membrane area and keeping the transmembrane pressure constant made it much easier to clean the membranes. This effect was because the granules of sago starch are big, in the range of 9-42 μm (Siong et al., 2019). Thus, it was clear the starch granules could be retained by the membrane used, and then it was possible to take advantage of the TFF principle. Contrary to other works, for example using a MF ceramic membrane with a pore size of 0.2 mm to process wheat starch suspensions, the best combination was maximum transmembrane pressure (3 bar), maximum flow rate (500 L/h) and minimum concentration (5 g/L). This research suggests that, for starch suspensions, permeate flux increases with TMP until equilibrium state is reached (Ikonic et al., 2011). It is difficult to compare the results of different starch suspension treatments due to the composition of the effluents. For instance, Fane and Fell carried out an extensive analysis of wheat starch process effluent typically contains 0.85 to 1.2% of total solids, mainly sugars, amino acids, ash and pentosan levels of 65.0, 18.0, 6.3 and 5.1%, respectively. These characteristics complicated the treatment of wheat starch waste streams due to low solids content and pH and high total volume to be processed. For the conditions tested in our experiments, the soaking method in NaOH solution produced the best results and the permeability of the membrane was restored efficiently. This fact allowed the enhancement of the membrane cleanliness and, at the same time, expanded the shelf-life of the membrane.
4. Conclusions
Cleaning membranes used for TFF of starch suspensions has demonstrated that soaking membranes in a stagnant NaOH solution for up to 72 h is the best way to recover water permeability. Effectiveness of the various cleaning methods expressed as NWP was immersion (91%)> agitation (45%)> 12 h recycling (36%)> backwashing (32%)> 1 h recycling (17%).
Comparative cleaning experiments of membranes used for TFF of starch suspensions performed in a laboratory setup were carried out to recover the membrane permeability. Soaking membranes in a stagnant NaOH solution for up to 72 h was the best method to recover the water permeability. Partial hydrolysis of the starch granules, soaking time and NaOH concentration were the factors that facilitated the membrane cleaning. In general, the order of the effectiveness of the various cleaning methods expressed as NWP was immersion (91%)> agitation (45%)> 12 h recycling (36%)> backwashing (32%)> 1 h recycling (17%). Moreover, the cleaning protocol, evaluated in terms of membrane resistance, showed that resistance removable by rinsing (Rcp) at 58% of the total resistance reached the highest value, therefore, the resistance is dependent on process time. Recovering the membrane permeability allows the reusability as well as expanding the shelf life of the membranes which could be beneficial for the treatment of the effluent of starch producing companies.

