1. Introduction
The enzymatic hydrolysis of proteins is of great industrial interest since hydrolysates are widely used in the manufacture of prepared foods, dietary products, and infant and clinical nutrition, among others. Modifying the structure of food proteins by enzymatic hydrolysis allows for improving the functional, nutritional, and immunological properties of the original food without losing nutritional value. Hydrolysis increases solubility, foaming power, and the emulsifying capacity of proteins. It also augments protein digestibility and reduces its allergenic character. Some peptides of proven biological activity can also be obtained by enzymatic hydrolysis (Zambrowicz et al., 2015).
Hydrolysates with distinctive characteristics have been obtained by tunning the reaction conditions of the enzymatic process (Noman et al., 2018; Pokora et al., 2013; Samsudin et al., 2018). Foaming and emulsifying properties and increased solubility are the most reported in research on enzymatic protein hydrolysis reactions (Chabanon et al., 2007). The hydrophobicity, polar groups and molecular size of the hydrolysates can also depend on the hydrolysis conditions (Klompong et al., 2007). The main variables that influence enzymatic hydrolysis are pH, temperature, type, and enzyme concentration as well as substrate nature (Gbogouri et al., 2004). The effective control of such factors makes it possible to optimize the enzymatic process. Response surface methodology (RSM) is a useful technique widely used to optimize processes in which the response variable of interest is affected by several factors (Singh et al., 2019). RSM has been successfully used in the optimization of the enzymatic hydrolysis of several proteins, from the visceral of Catla (Bhaskar et al., 2008), egg white (de Castro & Sato, 2015), shrimp by-products (Guerard et al., 2007), Momordica charantia L. (Yuan et al., 2008), Jellyfish (Sun et al., 2018), Lizard Fish muscle (Wu et al., 2012), rice bran (Singh et al., 2019) and dogfish (Diniz & Marti, 1996). However, no work has been found on the optimization of egg yolk protein hydrolysis by using RSM. Low-fat egg yolk protein is a by-product obtained from the egg yolk lecithin extraction process. It is sold at low costs, wasting its high protein content that can be used to produce bioactive peptides through enzymatic hydrolysis. Park et al. (2001) found that peptides from egg yolk hydrolysates with molecular weights (MW) between 5.5 kDa and 1 kDa had higher antioxidant activity than α-tocopherol. Other workers have also determined antioxidant activity in peptides with MW lower than 3.5 kDa from egg yolk protein hydrolysates (Peñaranda-López et al., 2020; Zambrowicz et al., 2012).
The enzymes used in the production of egg yolk protein hydrolysates include unconventional proteinase from Asian pumpkin (Cucurbita ficifolia) (Ecker et al., 2014), and conventional ones like pepsin (Zambrowicz et al., 2015), Protex and, Protamax (Wang & Wang, 2009), and alcalase (Park et al., 2001). However, the egg yolk used in those works was not previously submitted to a lecithin extraction process where some denaturation of proteins might have occurred.
Alcalase is a serine protease of bacterial origin that acts on aromatic amino acids. It is produced by the fermentation of Bacillus licheniformis (Demirhan et al., 2011). This enzyme is among the most efficient proteases to produce bioactive peptides which is why it has been used in the production of protein hydrolysates from different protein sources. It also achieves elevated levels of hydrolysis and has a strong tendency to produce hydrolysates with small peptides since it can recognize a wide range of amino acids. Alcalase has shown high specificity for basic (Lys) and hydroxyl (Ser), aromatic (Tyr, Phe, and Trp), acidic (Glu), sulfur-containing (Met) and aliphatic (Leu and Ala) residues (Klompong et al., 2007; Quist et al., 2009; Yuan et al., 2008), many of which are found in egg yolk proteins (Doucet et al., 2003).
The course of hydrolysis might also be affected by the protein concentration used during the reaction. Hydrolysis of egg yolk protein has been conducted by using protein dispersions lower than 130 g/L, but it has been found that the hydrolysates obtained with alcalase, at a higher protein concentration (200 g/L), contained smaller peptides than those from 100 g/L protein dispersions (Peñaranda-López et al., 2020).
In this work, the reaction conditions to produce hydrolysates from concentrated (200 g/L) dispersions of lecithin-free egg yolk protein with alcalase were optimized by using RSM. Hydrolysates were analyzed by size exclusion chromatography (SEC-HPLC) to determine the molecular weight profile of peptides obtained under the optimized hydrolysis conditions.
2. Materials and methods
2.1. Materials and chemicals
The raw material, lecithin-free egg yolk (LFEY) was supplied by Fresenius Kabi Deutschland GmbH. The enzyme Alcalase 2.4 L (Sigma-Aldrich) was stored at 4 °C. The reagents and chemicals used for analysis included di-sodium hydrogen phosphate dihydrate (Sigma-Aldrich), Kjeldahl catalyst tablets having 3.5 g K2SO4 and 0.4 g CuSO4 per tablet (FOSS), boric acid, sodium hydroxide, and sulfuric acid (Meyer, México).
2.2. Lecithin-free egg yolk (LFEY)
The lecithin-free egg yolk byproduct was defatted with hexane twice (1:4 w/v) at 45 °C and 200 rpm by using a shaker for 10 min. Vacuum filtration was used to separate the miscella from egg yolk. The defatted egg yolk was dried at 60 °C and 60 kPa for 6 h and stored at -20 °C for further analysis. The proximal composition (fat, protein, and moisture) of the raw material and the final product was determined according to AOAC methods. The protein content in all samples was evaluated by the Kjeldahl method (AOAC, 1995).
2.3. Enzymatic hydrolysis
The hydrolysis reaction was conducted in a 0.1 L bioreactor in a pH-STAT automatic titration system (TritroLine°R 7000) branched to a circulation water bath to control the temperature throughout the hydrolysis. 200 g/L protein dispersions were prepared by dispersing the defatted lecithin-free egg yolk protein byproduct in phosphate buffer (0.1 mol/L, at pH 7, 8 and, 9) and mixed with the enzyme volume needed to reach every enzyme to the substrate (E/S) ratio evaluated (between 0.25-0.35 AU/g). The reaction mixture was maintained under stirring at 50-60 °C for 180 min. The enzymatic reaction was ended by heating for 10 min at 90 °C and hydrolysate samples were kept at 4 °C for further analysis.
2.4. Degree of hydrolysis.
The degree of hydrolysis (DH) is the ratio between the number of cleaved and total peptide bonds (Ruan et al., 2010). It was estimated according to the pH-stat method, where DH is linearly dependent on the volume added of the base to keep the pH constant during hydrolysis, according to Eq. 1 (Adler-Nielsen,1986).
Where B is the base added in mL; Nb is base normality; α is the average degree of dissociation of the α-NH2 groups in the proteins; Mp is the mass (g) of protein (N x 6.62), and hTot is an estimated value of the number of peptide bonds allowable for proteolytic hydrolysis (7.33 meq/g).
2.5. Initial reaction rate
The initial reaction rate (V0), expressed in g/L h, was computed from the DH value observed at 5 min (% DH5min) and the initial concentration of proteins S0 (g/L) by Eq. 2 (Adler-Nissen, 1986).
The reaction rate (Vr) profile during hydrolysis was determined by the finite-element method.
2.6. Experimental design and statistical analysis
The effect of three independent variables; Temperature (X1), pH (X2), and the E/S ratio (X3), at three levels on the dependent variables (DH and V0) was investigated by using a factorial design (Table 1). The levels were adopted from single factor experiments and coded -1, 0, and +1. To maximize the effect of unexplained variability in the obtained responses, the experiments were randomized.
Table 1 Independent variables and their actual and coded levels are used in the optimization of the hydrolysis of DEY protein with alcalase by using RSM.
| Factor | Levels | ||
|---|---|---|---|
| -1 | 0 | +1 | |
| Temperature, OC (X1) | 50 | 55 | 60 |
| pH (X2) | 7 | 8 | 9 |
| E/S ratio, AU/g (X3) | 0.25 | 0.3 | 0.35 |
The response DH and V0 were analyzed employing the Design Expert program (Singh et al., 2019). A second-order polynomial model was fitted to the experimental data according to Equation (3).
Where Y represents the dependent variables (DH or V0). β0 is the constant coefficient, βi is the linear effect, βii represents the quadratic effect, βij is the interaction effect, and Xi and Xj are the independent variables. The suitability of this model was evaluated by the correlation coefficient (R2) and the variance analysis (ANOVA).
2.7. Peptide molecular weight (MW) profile of hydrolysates
The peptide MW profile of hydrolysates was determined by using size exclusion chromatography (SEC-HPLC) with a PL-Aquagel-OH 20 column. The detection was performed at a 220 nm wavelength. The column was gauged with cytochrome C (12327 Da), insulin chain B (3495. 89 Da), and HPLC peptide standard mixture (1046; 573; 555; 379; 238 Da) by using water as the mobile phase.
3. Results and discussion
After the fat extraction process, the protein concentration of the lecithin-free egg yolk protein byproduct raised to 85.45±0.33%, and the fat concentration lowered to 3.98±0.50%. This defatted egg yolk protein (DEYP) was the substrate used in all experiments.
3.1. Optimization of the hydrolysis reaction by RSM
The effect of temperature, pH, and E/S ratio on the DH and the initial reaction rate (V0) was determined by using a factorial design. The optimal reaction conditions were predicted by RSM. Results point out that the DH varied from 16 to 36 % and the V0 varied from 69 to 287 g/Lh under the tested reaction conditions. These values are in the range of those reported for the hydrolysis of various proteins with alcalase. For instance, Normah et al. (2004), optimized the hydrolysis of threadfin bream protein and reported that the degree of hydrolysis varied from 18 to 28% after 240 min, by using alcalase concentrations between 0.5 and 4 % (w/v). While Bhaskar et al. (2008) reported up to 49 % DH from visceral waste proteins after 105 min of reaction under pH 8, 55 °C, and 1.5 % (v/w) of the enzyme concentration.
According to the related ANOVA analysis for DH, P-values<0.05 indicate that the model terms are significant (Table 2). The regression analysis of experimental data showed that temperature and the E/S ratio had a linear and positive effect on DH while the pH effect was positive and quadratic. A positive interaction between temperature and the pH on the degree of hydrolysis was also observed. The largest value of the estimated regression coefficient of pH (912.97) for the DH data pointed out that pH was the main variable influencing the degree of hydrolysis. Related results were found for the initial reaction rate (56365.75), except that a positive interaction between the pH and E/S ratio was also obtained.
Table 2 ANOVA analysis of the optimization of temperature, pH, and the enzyme-to-substrate ratio (E/S) during the hydrolysis of defatted LFEY protein with alcalase.
| Degree of hydrolysis | Initial reaction rate | ||||||
|---|---|---|---|---|---|---|---|
| Source | Sum of Squares | F-value | p-value | Source | Sum of Squares | F-value | p-value |
| Model | 1052.24 | 56.31 | <0.0001 | Model | 79240.78 | 26.49 | <0.0001 |
| T | 64.29 | 30.97 | <0.0001 | T | 12064.71 | 36.30 | <0.0001 |
| pH | 912.97 | 439.7 | <0.0001 | pH | 56365.75 | 169.6 | <0.0001 |
| E/S | 16.06 | 7.74 | 0.0128 | E/S | 3721.19 | 11.20 | 0.0038 |
| T-pH | 12.54 | 6.04 | 0.0250 | T-pH | 2009.40 | 6.05 | 0.0250 |
| T-E/S | 0.0261 | 0.0126 | 0.9120 | T-E/S | 1030.74 | 3.10 | 0.0962 |
| pH-E/S | 0.2098 | 0.1010 | 0.7545 | pH-E/S | 1565.16 | 4.71 | 0.0445 |
| T2 | 0.0636 | 0.0306 | 0.8632 | T2 | 231.47 | 0.696 | 0.4156 |
| pH2 | 46 | 22.16 | 0.0002 | pH2 | 1831.64 | 5.51 | 0.0313 |
| E/S2 | 0.0808 | 0.039 | 0.8460 | E/S2 | 420.71 | 1.27 | 0.2762 |
| R2 | 0.968 | -- | -- | R2 | 0.9334 | -- | -- |
| *R2 | 0.950 | -- | -- | *R2 | 0.8982 | -- | -- |
| **R2 | 0.913 | -- | -- | **R2 | 0.8411 | -- | -- |
| C.V. % | 5.96 | -- | -- | C.V. % | 11.78 | -- | -- |
R2: determination coefficient, *R2= adjusted value; **R2= predicted value.
The dependency of DH on the three variables (X1: temperature, X2: pH, X3: E/S ratio) during hydrolysis of the DEY protein by alcalase was described by Eq. (4).
Equation (4) fitted the data with a regression coefficient R2 equal to 0.968, which agrees with the adjusted R² = 0.9504. The predicted values of the regression model and experimental data were plotted and observed to vary uniformly around the diagonal (Fig. 1a) which validates further the model.
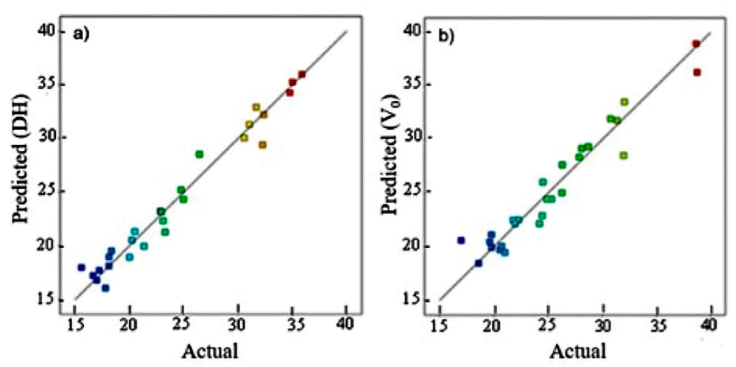
Figure 1 Relationship between the predicted observed and experimental data of the degree of hydrolysis (a) and the initial reaction rate (b) of the hydrolysis of the defatted LFEY protein with alcalase.
Similarly, Eq. 5 fairly described the dependency of V0 on temperature (X1), pH (X2), and the E/S ratio (X3) during hydrolysis of the DEY protein by alcalase.
Figure 1 (b) shows a fair agreement between the predicted values and the experimental data of V0. Besides, the coefficient R2=0.93 reveals a fair description of the hydrolysis reaction by the model (Eq. 5).
The three-dimension response surface graphs were also obtained, based on the proposed model for DH, where varied two independent variables, while keeping the third independent variable at the zero coded levels (Fig. 2).
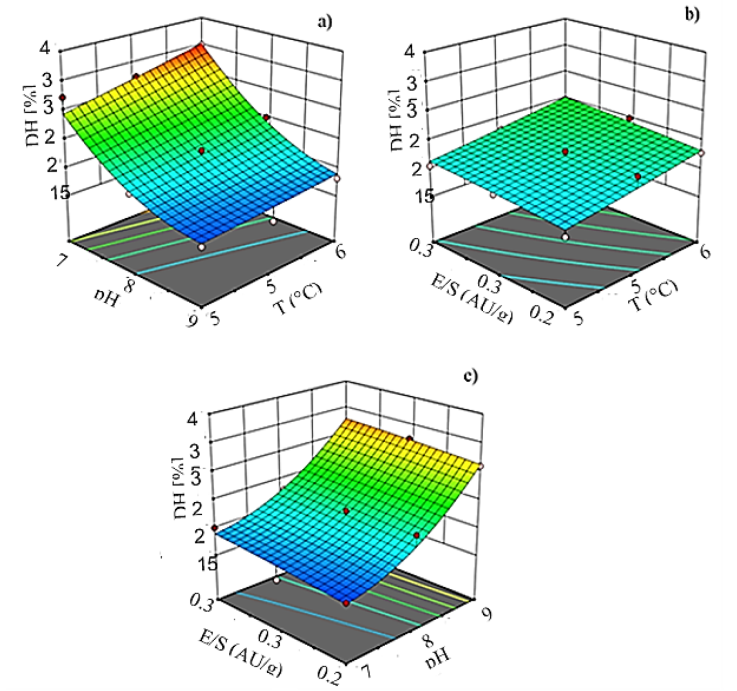
Figure 2 Degree of hydrolysis (DH) as a function of (a) pH and temperature when E/S ratio was kept at the center value, (b) E/S ratio and temperature when pH was kept at the center value, and (c) E/S ratio, and pH when the temperature was kept at the center level, during hydrolysis of defatted egg yolk with alcalase.
Figure 2a shows that DH increases with an increase in temperature and pH. Temperature increments of 10 °C induced about a 19 % higher degree of hydrolysis while pH and E/S ratio are at the center of their levels. This result confirms that temperature affects the hydrolysis reaction rate, hence higher temperatures favored the unfolding of proteins and exposed the peptide bonds, which increased the enzymatic activity and decreased the activation energy for the conversion of the substrate to the product (Adler-Nissen,1986). The optimal temperature is specific for maximum enzyme activity and changes with different substrates. Results from this work point out that the optimum temperature for the hydrolysis of DEY protein with alcalase is around 60 °C. This temperature has been reported for the hydrolysis reaction of different proteins with this enzyme (Klompong et al., 2007; Normah et al. 2004; Quist et al., 2009).
Similarly, increments in the E/S ratio produced a higher degree of hydrolysis (Fig. 2b). DH increased by about 8% by raising the enzyme concentration from 0.25 to 0.35 AU/g, while the temperature and the pH are kept at their central values. At higher enzyme concentrations, more active sites are available and that results in a prominent cleavage of the peptide bonds and higher dissolution of the protein (Kurozawa et al., 2008).
However, results from this work suggest that pH was the variable with the greatest influence on DH, hence increments up to 48% on the DH were observed when the pH was raised from 7 to 9 while maintaining the temperature and the E/S ratio at their center values (Fig. 2c). These results pointed out an optimum enzymatic activity at pH 9. Similar optimum pH values for alcalase were reported by other workers. Yuan et al. (2008) found an optimum pH of 9.2 in the hydrolysis of Momordica charantia L. protein, while Guerard et al. (2007) reported an optimum pH of 9.7 in the hydrolysis of shrimp processing discards also with alcalase. pH affects both the enzyme and the substrate because it changes the conformation and the charge distribution of the molecules (Adler-Nissen, 1986). The enzyme activity depends on the active sites and the molecular spatial structure which are very much affected by pH. In the optimum pH interval, the spatial structure of proteases changes, and more active sites can be exposed. This favors the breaking of more peptide bonds in the protein and increased DH (Yu et al., 2012). However, the pH at which this phenomenon occurs the most depends on the substrate.
3.2. Optimization using the desirability function
The optimal conditions to hydrolyze the low-fat egg yolk protein sub-product with alcalase were determined by using the response desirability (Fig. 3).
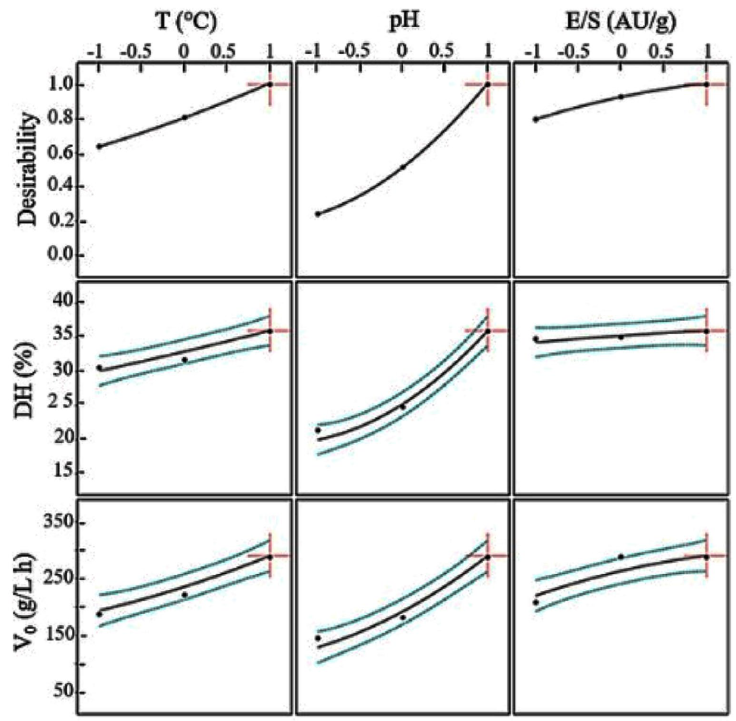
Figure 3 Predicted values and desirability profiles for the optimum degree of hydrolysis (DH) and the initial reaction rates (V0) in the hydrolysis of defatted egg yolk with alcalase.
The desirability profile is formed by setting the highest level of the predicted desirable response at 1.0 and the lowest level at cero. The coded optimal values were: X1 =1; X2 =1; X3 =1.
The uncoded optimal conditions were 60 °C, pH 9, and E/S=0.35 AU/g. Under these conditions, the obtained degree of hydrolysis was 34.08 % and the initial reaction rate was 287.63 g/L h.
3.3. Kinetics of optimized hydrolysis and composition of hydrolysates
Under the optimized conditions, the degree of hydrolysis raised steeply in the first 10 min of the reaction followed by a sudden drop in the reaction rate. At this time, the DH reached 14.5 % which is about 42 % of the maximum DH (34 %) obtained after 180 min (Fig. 4) and the chromatographic analysis of hydrolysates showed that most of the peptides had MW<12 kDa (Fig. 5a). These results suggest that the enzyme begins the reaction by breaking bonds from the main proteins, which might be related to its endoproteases nature. Then, it continues reducing the size of large peptides (Fig. 5b) up to the point where most of the peptides have a molecular weight between 12kDa and 3.5 kDa (Fig. 5c-f).
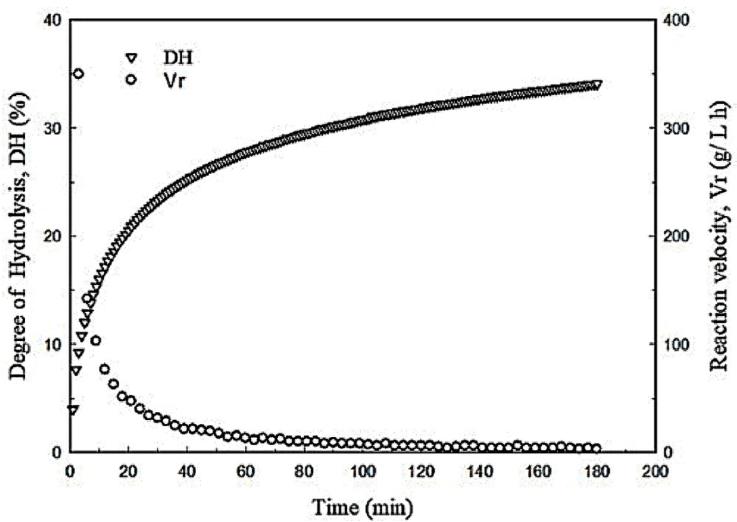
Figure 4 Kinetics of the egg yolk protein hydrolysis reaction conducted under the optimized conditions.
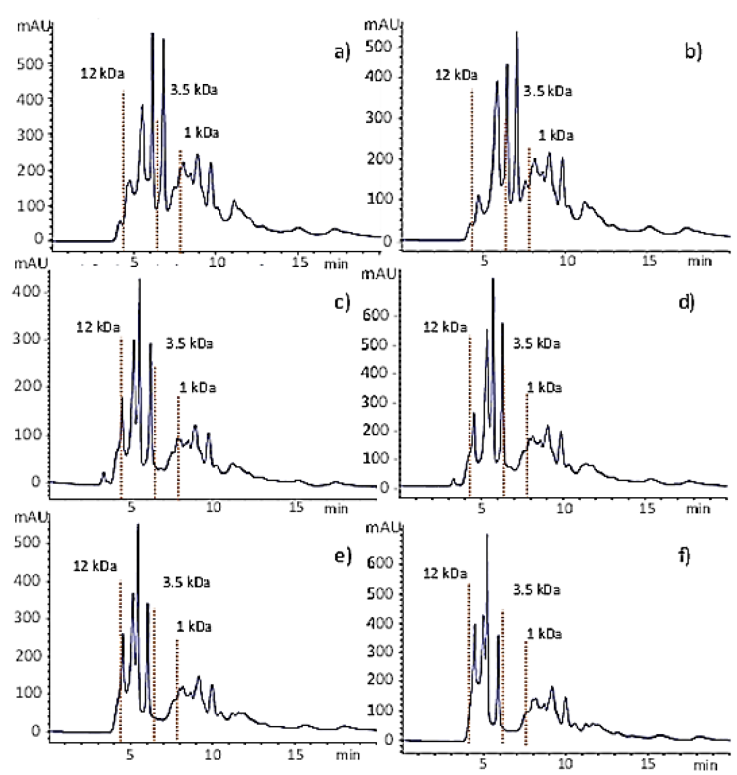
Figure 5 Molecular size distribution of hydrolysates obtained by gel filtration chromatography under optimized conditions at different reaction times: a) 10 min; b) 20 min, c) 40 min, d) 60 min, e) 120 min, and f) 180 min. The red dotted vertical lines show the time at which the molecular weight standards elute, i.e., cytochrome C (12327 Da), insulin chain B (3495. 89 Da), and one of the peptides from the HPLC standard mixture (1046Da)
Figure 5 also shows that after 40 min there was a small concentration of molecules having MW>12 kDa, which were hydrolyzed in the following minutes of reaction (Fig. 5d). Figures 5d to 5f show slight changes in the hydrolysate composition after 60 min of hydrolysis. The small peak of large peptides (MW > 12 kDa) from samples obtained since the first min of reaction (Fig. 5) suggests that the enzyme follows a zipper-type mechanism of hydrolysis, where the native protein molecules are rapidly converted to the intermediary form which is then more slowly degraded to end products (Adler-Nielsen,1986). The size of the peptides found in the hydrolysates depends on the degree of hydrolysis and it is important because some functional and biological properties depend, at least in part, on the molecular size (Wasswa et al., 2007). In this work, the high-DH hydrolysates produced with alcalase after 60 min of reaction under the optimized conditions contained mostly peptides with MW lower than 3.5 kDa which may include oligopeptides with antioxidant activity (Park et al., 2001; Peñaranda-López et al., 2020; Zambrowicz et al., 2012). Therefore, hydrolysates could be ingredients of high-protein nutritional supplements or in the formulation of clinical nutritional products.
4. Conclusions
The degree of hydrolysis of concentrated lecithin-free egg yolk protein dispersions with the enzyme alcalase was significantly influenced by pH, temperature, and the E/S ratio, but pH was the variable with the greatest effect. Under the optimal conditions (60°C, pH 9, and E/S=0.35 AU/g), most of the peptides in the hydrolysates had an MW lower than 12 kDa in the first 10 min of reaction. The size of peptides decreased with reaction time indicating that the enzyme followed a zipper-type mechanism of hydrolysis. The hydrolysates obtained under the optimized conditions contain oligopeptides (MW<3.5 kDa) which might be used in different industrial applications (i.e high protein nutritional supplements or in the formulation of clinical nutritional products).


 nueva página del texto (beta)


