Introduction
Superoxide dismutase (SODs) are metalloenzymes that play a major role in antioxidant defense against oxidative stress in the body [1]. In living organism, superoxide dismutases (SODs) are the first line of defense against reactive oxygen species (ROS), e.g. O2-, which at the cellular level may damage DNA and proteins. SODs catalyze the conversion of superoxide radicals to oxygen and hydrogen peroxide through a set of reactions detailed below [2]:
Here, oxygen radical is consumed, and molecular oxygen and hydrogen peroxide are produced. There are three different SOD known in the human body: (1) CuZn-SOD (SOD1) [3], generally located in the cytosol and in charge of protecting proteins, lipids, and nuclear DNA, (2) MnSOD (SOD2)[4], located in the mitochondrial matrix where it protects the respiratory machinery and mitochondrial DNA from oxidative damage; and (3) extracellular CuZn-SOD (ecSOD or SOD3) [5], found extracellularly and in plasma membrane, expressed in endothelial cells of blood vessels where its main role is to maintain the superoxide/nitric oxide balance [6]. SODs are widespread in the human body, including at human skin [7] and plays a fundamental role in protecting cells from free radicals, such as superoxide anion, hydroxyl, nitric oxide radical, hydrogen peroxide, and singlet oxygen.
Imbalances in the levels of the SODs has been linked to different disease states [6]. SODs have also been shown to be potential biomarkers of disease progression. Increases in MnSOD overexpression have been linked to lung, gastric and colorectal cancers [8]. A direct correlation has been observed, where increases in MnSOD are linked to advance stages of gastric and colorectal cancer. Furthermore, MnSOD overexpression increases concomitant to increases of metastatic disease severity [8a]. Early detection of SOD2 in the circulatory or lymphatic system may help early diagnosis and prognosis of these types of cancer. A highly sensitive in vivo detection method would be useful for tracking cancer biomarkers, such as MnSOD.
Recently, single entity electrochemistry (SEE) has permitted the detection of individual cells and viruses [9]. Since SODs’ are involved in the dismutation of oxygen radicals serving as catalytic promoters, SEE could prove them useful as diagnostic tools for monitoring SODs’ levels where they might be linked to disease severity or progression as in the case for a number of distinct cancers [8]. Here, the electrochemical behavior of individual CuZnSOD dimer was evaluate when the enzyme was in close proximity to the Pt ultramicroelectrode (UME, r = 5 μm) surface. CuZnSOD is a 32.5 kDa enzyme, and its radius can be estimated to be 2.1 nm, although its accurate size has been difficult to be empirically determined by electrochemical methods [10].
Because of CuZnSOD small size, a nanometric UME would be needed for the direct sensing of this soft nanoparticle. However, because of its catalytic feature, this enzyme is ideal for electrocatalysis. Although CuZnSOD is 3 orders of magnitude smaller than the Pt UME, electrocatalysis due to the oxidation of superoxides at the enzyme gives the continuous electron transfer current for the signal amplification to be detected [11]. The obtained amplitude of current (Δi) was interpret as the distance from the active site catalyzing the dismutation step. The data variation interpretation correlates with active center depending on the way the enzyme strike to the electrode. Further, analysis of the frequency of collision vs concentration was used to determine the experimental diffusion coefficient and compare it with the theoretical diffusion coefficient calculated with the Stokes-Einstein equation.
Experimental
Materials and Methods
Chemical
All chemicals used were of high purity and used as received. Reagents and solvents used during these experiments such as: bovine CuZnSOD, KCl, NaH2PO4, Na2HPO4, K4Fe(CN)6·3H2O, NaOH, HCl, alumina powder of different sizes, Nafion perfluorinated resin solution, isopropyl alcohol, were bought from Millipore Sigma (Sigma Aldrich). The UMEs were prepared following published procedure [12].
Analysis of CuZnSOD protein concentration
BCA assay was performed to the commercially acquired bovine CuZnSOD from erythrocytes vial obtained from the manufacturer, to calculate the specific concentration of the protein in the sample. The BCA analysis gave a protein concentration of 0.05615 mg/mL. This concentration was used for further dilutions during sample preparation. The standard used to prepare the calibration curve was bovine serum albumin (BSA) also commercially available.
Transmission electron microscopy (TEM)
Transmission electron microscopy (TEM) images were obtained using a FEI Tecnai T12 BioTwin 120kV TEM and FEI Tecnai G2F20 200kV TEM/STEM at Cornell Center for Material Research (CCMR) facilities and Cornell University. The 2.30 nM CuZnSOD stock solution was analysed. A negative staining treatment using uranium was applied to enhance the enzyme contrast. The TEM grids used for these samples were made of a carbon thin film over copper.
Linear sweep voltammetry
Several glassy carbon electrodes, with 3 mm in diameter, were cleaned to a mirror-like finish by smooth polishing with 1 μm, 0.3 μm, and 0.1 μm alumina for 3 minutes and thorough washing with nanopure water with a resistivity of 18.2 Ω-cm. The cleaned glassy carbon electrodes, before being surface modified, were treated, to avoid hydrophilicity, by holding a reducing potential for 5 minutes under continuous nitrogen bubbling. The electrodes were then modified with a nZVI ink via 5 μL drop cast and allowing the electrodes air dry overnight. The inks were prepared using a mixture of 500 μL of Nano pure water + 5 μL of 10 % Nafion perfluorinated ion- exchange resin from Sigma Aldrich + 100 μL of 2.30 nM CuZnSOD. The GCE modification was performed by 5 μL drop casting of this ink on the GCE surface. The modified electrodes were left to dry overnight. The LSV was performed next day, using a 3 electrodes cell with a Pt wire as counter, Ag/AgCl (3 M KCl) as reference, and both (bare and modified) glassy carbon electrodes were used for comparison purposes. The LSV parameters used were 10 s equilibrium time and 0.01 V/s potential scan rate from 0.1 V to 0.5 V potential window. These measurements were done in a 100 mM phosphate solution at pH 7.8.
Catalytic amplification
The instrument used for these analyses was a CHI 6044E Electrochemical Analyzer with picoamp booster and a faraday cage. This setup provides current range between ±10 pA to ±0.25 A in 12 ranges. In addition, the current resolution is 0.0015 % of current range, with a minimum current resolution of 0.3 fA (CH Instruments, Inc.).
The technique used for this analysis was chronoamperometry, i.e. current (i) vs. time (t) curves. The electrochemical cell system was a 3 electrodes cell using an r = 5.00 μm Pt ultramicroelectrode (UME), Pt wire, and Ag/AgCl (3 M KCl) as the working, counter, and reference electrodes, respectively.
Consecutively, 15 mL of 2.30 nM CuZnSOD stock aqueous solution was prepared using 100 mM phosphate buffer at pH 7.8 as the solvent. Dilutions of 0.9 fM, 3.3 fM, 5.0 fM, 7.5 fM, 10 fM, 50 fM, 100 fM, and 500 fM were prepared using the℃ same 100 mM phosphate buffer at pH 7.8 as the dilution solvent. The sample dilutions stayed in a bath at 25 for 15 minutes or until they were ready to be analysed. Each sample was analysed in triplicate, starting with the least concentrated (blank, phosphate buffer without the enzyme). Also, the analysis was repeated multiple times to increase the data acquisition of signals (peaks). The Pt UME behaviour was evaluated by cyclic voltammetry (CV) with a standard solution of 15mM K4Fe(CN)6•3H2O between each chronoamperometric run. Heating conditions: two concentrations (3.3 fM and 5.0 fM) were chosen for their initial activity in the amperometric (i vs. t) curve, and where heated in a bath at 80 ℃ for 30 minutes. These concentrations were analysed again using chronoamperometry under the exact previous conditions (triplicate, starting with the phosphate buffer solution used as blank). Their i vs. t curves were further interpreted.
Results and discussion
TEM analysis of CuZnSOD solutions
Transmission electron microscopy (TEM) images were taken using a negative staining process with uranium acetate. The image at 50 nm resolution (see Fig. 1 top) shows enzymes in a range between 2.5 nm and 6.5 nm, with mean value℃ and standard deviation of 4 ± 1 nm, respectively. TEM images after samples were exposed to heat (80 ) for 30 minutes were also taken (see Fig. 1 bottom). The image after heating exposure shows agglomeration of the protein in the dimensions ranging from 30 nm to 650 nm.
Linear sweep voltammetry (LSV) monitoring of CuZnSOD
Linear sweep voltammetry (LSV) (see Fig. 2) was used to find CuZnSOD electroactive redox potential for the single particle experimental conditions, with anodic current taken as negative. For this procedure, glassy carbon electrodes (GCE) were cleaned to a mirror-like finish, followed by smooth polishing of their surfaces with different alumina sizes. An ink containing the CuZnSOD was prepared using Nafion perfluorinated ion exchange resin and the GCE surface modification was done through a drop casting procedure. The LSV was done in a 100 mM phosphate buffer solution at pH 7.8, giving 10 s of equilibrium time, and using a 0.01 V/s potential scan rate between 0.100 V and 0.500 V potential window; for both bare and CuZnSOD modified GCE. Although anodic and cathodic peaks of CuZnSOD have been previously reported, the LSV was performed to discard differences to previously reported values that can arise from enzyme preparation and the experimental conditions employed. The LSV was started at 0.5 V instead of the open circuit potential value for reproducibility purposes [10]. The obtained value correlates with the previously reported. An anodic peak was observed at 0.23 V vs. Ag/AgCl for the CuZnSOD modified GCE corresponding to the electron transfer of the SOD. This finding correlates with the data obtained by other groups for the same enzyme [10]. The obtained potential value result was used as a reference for the experimental parameters in the catalytic amplification experiment of single CuZnSOD collisions.
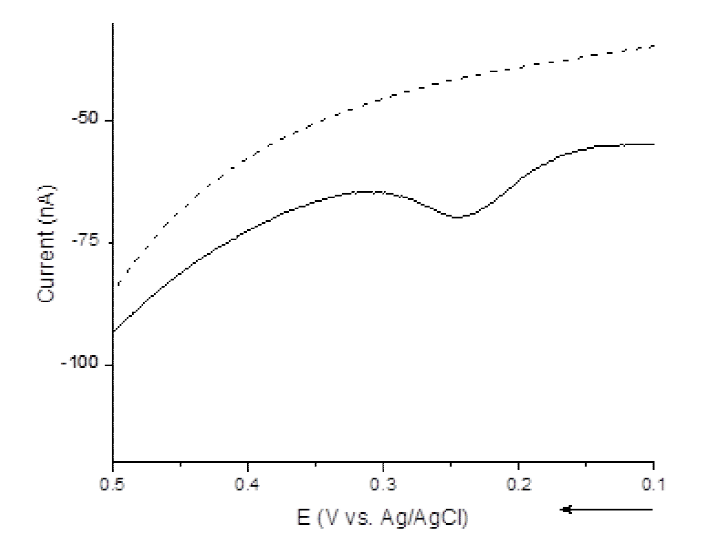
Fig. 2 Linear sweep voltammogram (LSV) of a clean ( dash line) and CuZnSOD modified (solid line) glassy carbon electrodes (GCE). The LSV was done in 100 mM phosphate buffer at a pH of 7.8. After applying the initial potential, a 10 s equilibrium time was done prior to a potential sweep at 0.010 V/s between 0.100V to 0.500V vs. Ag/AgCl (3 M KCl). The arrow shows the LSV scanning direction (anodic current taken as negative).
Catalytic amplification
A highly sensitive method would be optimum for detecting very low concentrations of CuZnSOD. To our understanding, detection of SODs with linearity have been attained only in the μM -nM range [13]. The approach below detects one CuZnSOD collision at a time when 0.2 V potential is applied to the electrode upon electrocatalysis of oxygen radicals at the enzyme in a fM concentration range. The current transient is generated when the CuZnSOD impacts the ultramicroelectrode’s (UME) surface, followed by the catalysis of the superoxide to molecular oxygen and hydrogen peroxide. The proposed mechanism of action is that one CuZnSOD collides on the UME, and reactions (1 or 2) take place in separate steps, each step giving rise to one observed current shift in the amperometric (i vs. t) curve (see Figures 3 and 4), due to the catalytic process.
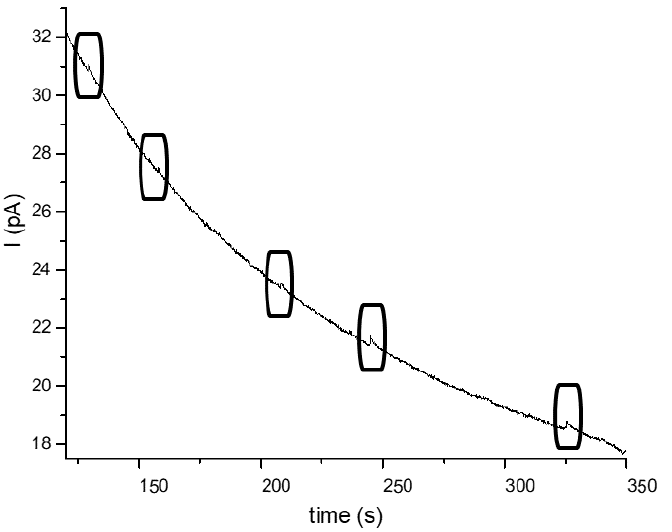
Fig. 3 Amperometric i vs t curve of a 3.0 fM CuZnSOD solution in phosphate buffer at pH 7.8, with an applied potential (E) of 0.200 V vs. Ag/AgCl (3 M AgCl).
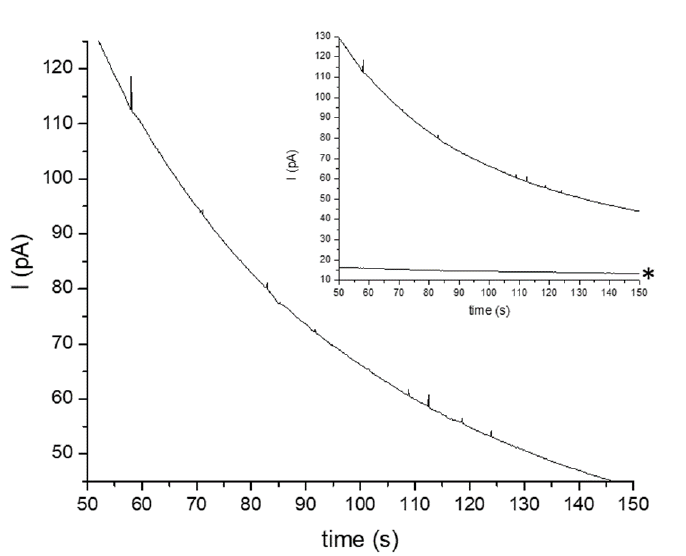
Fig. 4 Amperometric i vs t curve of a 5.0 fM CuZnSOD solution in phosphate buffer, pH = 7.8, at an applied potential (E) of 0.200 V vs. Ag/AgCl (3 M AgCl). Inset showing i vs t curves of: 5.0 fM CuZnSOD solution (upper) and a blank of phosphate buffer solution, pH = 7.8 (bottom *).
The observed shifts of current are further interpret to evaluate the accuracy of the calculated CuZnSOD distance from the active site named here as “radius”(rCuZnSOD) (see Figures 3 and 4) using the steady state limiting current, to a sphere on a plane,
where n is the number of electrons transferred during the process, F is the Faraday’s constant, DO is diffusion coefficient of oxygen in water according to literature (1.44 x 10⁻⁹ m2/s) [14], CO is the concentration of dissolved oxygen in water (2.67 x 10⁻⁷ mol/cm 3) [15], and r CuZnSOD is the “radius” of the CuZnSOD [11a, 11b]. This equation has risen controversy among the scientific community regarding its ability to describe the current of a single enzyme, and the detection of a single enzyme if at all [11c, 16]. Previously, Lin et al. compared simulated data for the detection of the enzyme catalase with experimental data obtained for the detection of free catalase activity using nano-impact technique concluding that Michaelis -Menten model does not predict the catalytic ability of a single enzyme, and that in fact the catalytic ability of a single enzyme can temporarily reach higher levels which can be observed by the nanoimpact method [16b]. Also, Sekretaryova et al. answering the polemic raised on the electrocatalytic detection of one laccase enzyme based on the difference between the catalytic constant calculated for one enzyme vs the bulk, expressed several reasons why these two values should not be compared, and supports the detection of one laccase enzyme at a time [17]. The physical interpretation of the current signals using the obtained electrocatalysis data suggests that in this specific case the “radius” rCuZnSOD should not be interpret as the enzyme’s radius but as the distance from the active site when an enzyme collides on the electrode’s surface; and it depends on the way the enzyme collides on the electrode’s surface and which active site is catalyzing the reaction step at that particular moment. The diameter range using the catalytic amplification technique was 1.05 nm - 6.93 nm, giving an average value of 3.15 nm. A careful statistical analysis was performed using a z test analysis to obtain the best representative population of peaks. The data was then segregated into ranges of 0.5 nm - 1.5 nm, 1.6 nm - 2.5 nm, and 2.6 nm - 3.5 nm; and the mean, standard deviation, and mean square error (MSE) were calculated to understand the distribution of sizes, uncertainty, and error from the compared values (1 nm, 2 nm, and 3 nm), respectively. The peaks in the range of 0.5 nm - 1.5 nm radius have an average of 1.0 ± 0.3 nm, with a MSE of 0.08 nm. These peaks are interpreted as an enzyme catalyzing a reaction step with the active site closer to the electrode’s surface upon collision. The obtained values for the 1.6 nm - 2.5 nm range had mean value of 2.0 ± 0.3 nm and MSE of 0.08 nm. This range of values is interpreted as an enzyme colliding in a flat orientation on the electrode’s surface. The 2.6 nm - 3.5 nm ranges had mean value of 3.2 ± 0.3 nm and MSE of 0.1 nm (see Table 1). This range of values is interpreted as the active site catalyzing the reaction being the farthest from the electrode’s surface (see Fig. 5). The selected values of 1 nm, 2 nm, or 3 nm are theoretical representative locations of the active site depending on how the enzyme collides on the electrode’s surface, and which active site subunit is catalysing the reaction based on crystallographic studies (see Fig. 5) [18]. Crystallography data has suggested that each subunit works independently, and that one unit can be oxidizing while the other unit is reducing. Also, crystallography has located the Cu atoms not at the center of the enzyme but ~ 1nm from the enzyme’s edge [2, 18, 19]. The statistical values obtained from the Δi analysis suggest that the obtained distance is not the enzyme radius but the distance from the active site that is catalysing the reaction depending on the way the enzyme impacts the electrode which is in agreement with the crystallographic data. The current amplification factor was calculated using (4π(ln2)/16)(DOCOrUME)/(DNPCNPrNP)[11a], obtaining a magnification of 1.3 x 10¹⁵. The parameters used for this calculation were DNP = 1.24 x 10 -6 cm2/s (as described by Stokes-Einstein equation), theoretical size of the enzyme rNP ~2.1 nm, and a CNP = 3 x 10-18 mol/cm3 which was one of the concentrations used in the herein study. A theoretical estimation of the enzyme’s size was used to compare it with the value obtained from the electrocatalysis analysis (Δi), using the following equation,
Table 1 Statistical analysis of the CuZnSOD radius range values, compared to their active site distance depending on the way they collide on the electrode’s surface.
| Statistical value | 0.5 nm - 1.5 nm range | 1.6 nm - 2.5 nm range | 2.6 nm - 3.5 nm range |
| mean | 1.0 nm | 2.0 nm | 3.2 nm |
| standard deviation (σ) | ± 0.3 nm | ± 0.3 nm | ± 0.3 nm |
| MSE | 0.08 nm | 0.08 nm | 0.1 nm |
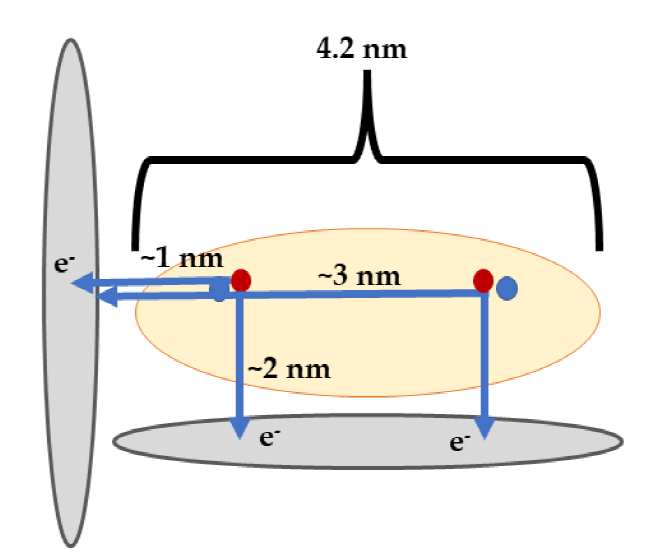
Fig. 5 Schematic representation of CuZnSOD (orange) colliding on a Pt UME disk electrode (grey); red and blue dots representing the copper and zinc atoms, respectively. The arrows show the distances from the active site depending on the enzyme’s way of striking the electrode.
The CuZnSOD theoretical size was ~4.2 nm.
In this equation, MM is the enzyme molar mass [20]. The value obtained by this method suggests that the enzyme size is about 4.2 nm in diameter. Following the rule of thumbs for a collision experiment, the convenient electrode radius (relec) should be nanometric. However, the Pt UME used in these sets of experiments had a radius of 5.0 μm, making the detection challenging. Regardless of this fact, the continuous electron transfer process taking place during the catalytic event provided for amplification of the current and the CuZnSOD detection was observed.
Table 2 Calculated value interpreted as distance from the active site for CuZnSOD using parameter rCuZuSOD.
| Distance from the active site (nm) |
| 2.1 |
| 1 |
| 1.1 |
| 3.3 |
| 2 |
| 2.9 |
From the literature and the LSV seen in Fig. 2, the ∆E0 of CuZnSOD is ~ 0.21 V vs Ag/AgCl. In these set of experiments, the applied potential was 0.2 V. Working at the redox potential, the change in polarity can provide for both processes, an oxidation/reduction panorama. CuZnSOD possess redox- active metal centers that undergo reversible oxidation and reduction processes. However, when the potential applied exceeds the redox potential, there is a risk of causing irreversible damage to the protein structure, leading to changes in its activity or even denaturation. By working within the range below the redox potential, we can study the reversible redox processes while minimizing the risk of detrimental effects on the protein. In our case, this applied potential permitted observable cathodic and anodic peaks (see Fig. 6), suggesting concurrent independent processes taking place at the two metal centers. Every sample was run in triplicates. The change in polarity, as seen in Fig. 6, was obtained when the same sample previously run (named as trial 1(red)) is run again under the same exact conditions (named trial 2 (black)). This change in polarity and the direction of the spikes suggest oxidation and reduction taking place and is indicative of CuII reduction and further regeneration (oxidation) to CuI in the enzyme which continues its catalytic activity. Crystallographic data has shown the independent activity of the active sites, observing that Cu in one active site can be in its Cu I state while Cu in the other active site is in its CuII state [18]. The cathodic and anodic peaks in the same run supports this observation. Superoxide has been established as an intermediate in the oxygen reduction reaction (ORR) on Pt electrodes, which is the purposed source of superoxide in this work for the enzymatic catalytic activity to take place [21]. This is supported by the fact that every blank sample containing only the phosphate buffer at pH 7.8 showed a cathodic steady state current at the 0.2 V vs Ag/AgCl applied potential.
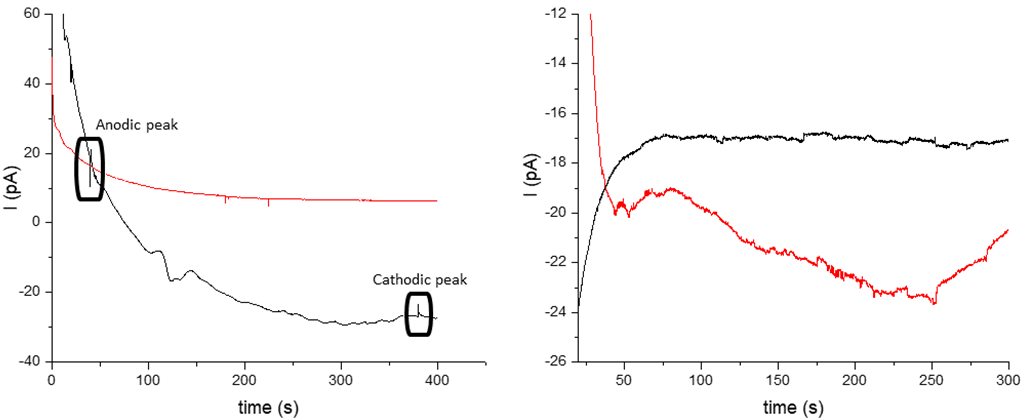
Fig. 6 Amperometric current (i) vs. time (t) curves of a 500 fM (left) and 10 fM (right) CuZnSOD solution in phosphate buffer at pH = 7.8, at an applied potential (E) of 0.200 V vs. Ag/AgCl (3 M AgCl) . Trial 1 (red), trial 2 (black). *Observe the change in polarity and direction of the peaks (anodic and cathodic).
A detection limit study was performed to understand the r = 5.0 Pt UME capacity of detection. The frequency of collision increases linearly with increasing concentration up to 5.0 fM concentration (see Fig. 7). It decreases linearly for concentrations higher than 5.0 fM, and no peak was able to be detected at 100 fM concentration. However, peaks were observed in the most concentrated sample (500 fM). The r = 5.0 Pt UME was able to detect CuZnSOD in concentrations as low as 0.9 fM (9 x 10-16 M) (see Fig. 8), the lowest reported for this enzyme to our knowledge! At 10 fM, the signal/noise ratio starts to be higher, this can be possibly due to passivation of the UME, provoking the electrodes efficiency decay. To create an efficient detection method, boundaries must be set. The lowest concentration detected in these sets of experiments was 0.89 f M (~0.9 fM). With an increase in concentration, an increase in noise is observed, the upper boundary needs to be further studied, perhaps using UMEs of different sizes. However, the bigger the size the more difficult for the enzyme to be detected, since the noise to signal ratio will increase. The collected data suggests that after 100 fM the detection of the enzyme becomes more challenging although spikes of current were obtained in the most concentrated 500 fM sample. However, safety boundaries can be set between 0.9 fM - 50 fM. The experimental diffusion coefficient was calculated using the positive slope of the frequency vs. concentration lineal regression at (0.9-5 fM) concentration range (see SI). The obtained value was compared to the diffusion coefficient by Stokes-Einstein giving 3.08 x 10⁻⁶ cm2/s and 1.24 x 10⁻⁶ cm2/s, respectively (see SI). The magnitude correlation of the experimental and theoretical value strongly reinforces one CuZnSOD colliding at a time.
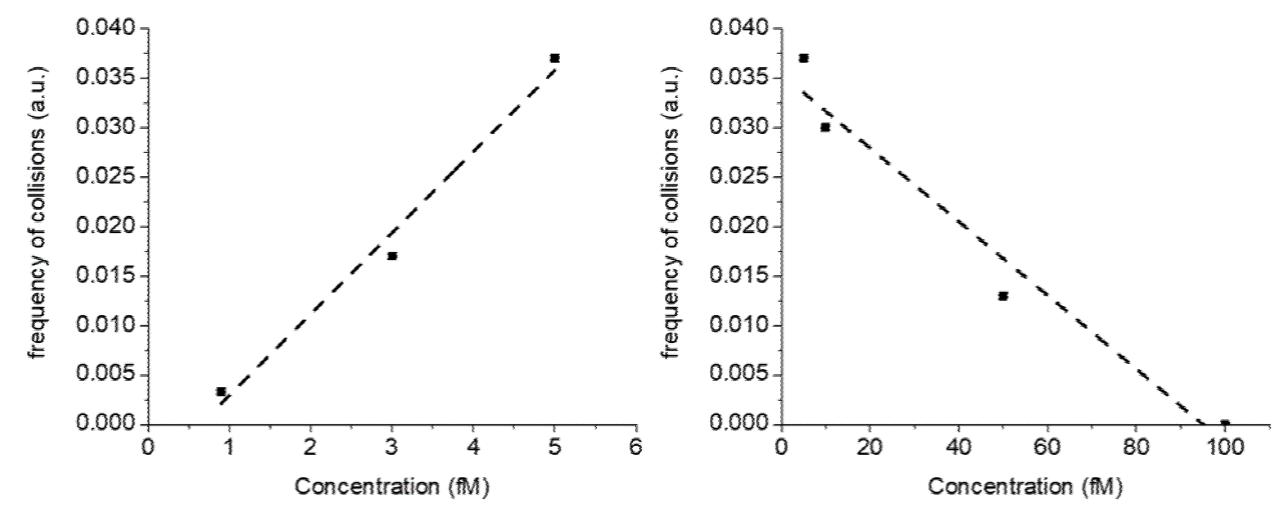
Fig. 7 Frequency of collisions at the UME vs. concentration showing that the detection increases linearly up to 5.0 fM, y = 0.00821x - 0.00524 (left) and decreases linearly after that concentration (right).
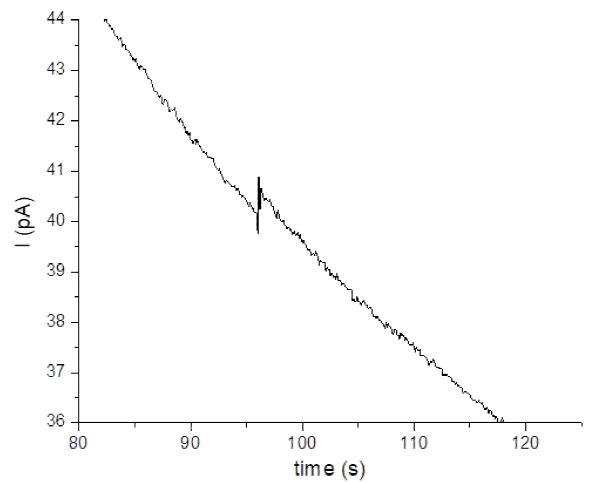
Fig. 8 Amperometric current (i) vs time (t) curve of a 0. 9 fM CuZnSOD solution in phosphate buffer with a pH of 7.8 at an applied potential (E) of 0.2 V vs. Ag/AgCl (3 M KCl).
A knock down experiment applying heat to the enzyme was performed to support that the observed peaks are from the enzyme’s activity. The prepared solutions were tested before and after 30 minutes exposure to 80 oC temperature.
Instead of a knock-off effect of the enzyme after expose to heat, spikes of increased magnitude of current were observed (see Fig. 9). The current transient peaks intensified after exposing the enzyme to an increased temperature environment. This data suggests that the enzyme is not only robust regarding its catalytic activity but also that agglomeration of the enzyme occurs after heat exposure; giving rise to higher peaks which would be interpreted as a larger size particle. Further analysis of these peaks offered a diameter range between 15 nm and 920 nm. Aggregation of enzyme after heat exposure, without losing its catalytic activity explains this behaviour. TEM images confirmed the agglomeration of the enzyme and the size range obtained with the electrochemical method analysis (see Fig. 1). A size distribution comparison with data from catalytic amplification and transmission electron microscopy (TEM) images was done (see Fig. 10). The data obtained with the TEM images gives majority of particles in a range of 2.5 nm - 4.5 nm, however, in such a small magnitude of size, limitations such as estimation and human eyesight need to be taken in consideration. Catalytic amplification technique gives majority of peaks in a 1 nm - 2.5 nm range, something very challenging to estimate from a TEM image. Moreover, the enzyme is a dimer with two active sites. Crystallography has proven that these active sites work independently, and that one Cu can be oxidized while the other is reduced. These active sites are not localized at the centre of the enzyme but ~ 1 nm from the edge correlating with the Δi analysis.
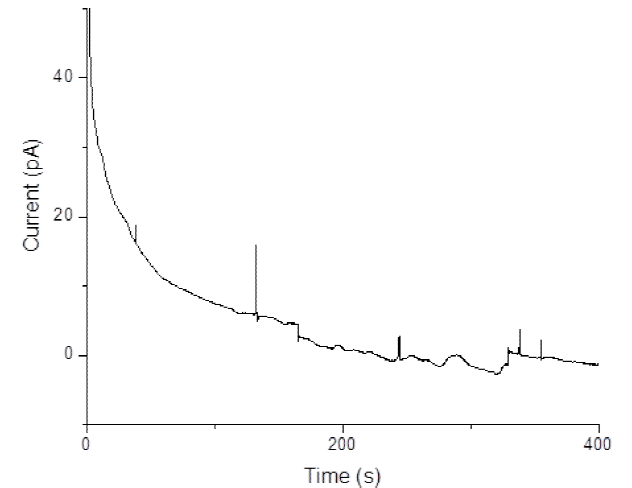
Fig. 9 Amperometric current (i) vs. time (t) curve of a 3.0 fM CuZnSOD solution after 30 minutes exposure to 80 oC temperature, in phosphate buffer at pH of 7.8 at an applied potential (E) of 0.2 V vs. Ag/AgCl (3M KCl). A three-electrode cell was used: a 10 μm Pt UME as the working electrode, Ag/AgCl as the reference electrode, and a carbon rod as the counter electrode.
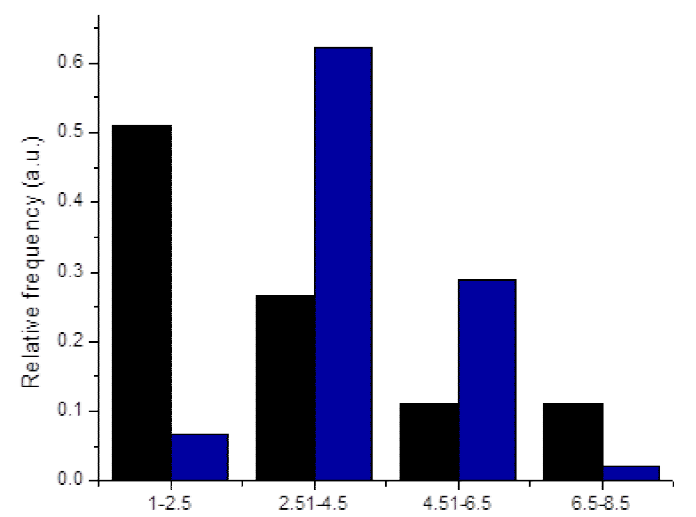
Fig. 10 CuZnSOD size distribution histogram comparing the obtained diameters through the catalytic amplification data (black), and transmission electron microscopy (TEM) (blue).
Taking in consideration the fact that the enzyme is not a solid homogeneous particle but rather a soft particle with two specific active sites, the radius obtained by the catalytic amplification method correlates with the distance from the Cu atom active site to the edge of the enzyme and varies depending on which of the subunits is catalysing the reaction (see Fig. 5, Tables 1 and 2), giving an insight of how the enzyme is colliding on the electrode’s surface. This is a revolutionary finding and observation for the catalytic amplification technique. Although stochastic events governed solely by diffusion would give a flat distribution of the different size ranges, since the probability of colliding one way or the other will be the same for each collision under no other affecting force; a non-normal distribution was obtained, showing a higher probability of collision in the range of 0.5 nm - 1.5 nm radius in a 3:1 ratio (see Fig. 11). This fact could be attributed to the electrostatic interaction between the electrode applied potential and the active site of the particle, driving the orientation of the enzyme since electroactive species are also affected by migration [22]. As the particle approaches the electrode, it can “feel” the potential stronger, and orientation of the enzyme can occur, redirecting the electroactive site in a position closest to the electrode’s surface. However, there is a competition between this orientation process and other factors such as the diffusion coefficient of the particle, and the kinetics of the catalysed reaction, thus every 1:3 times the particle impacts the electrode in a random manner, giving rise to the 1.6 nm- 2.5 nm, and 2.6 nm - 3.5 nm ranges, where the active site catalysing the reaction is not in closest proximity to the electrode’s surface. Other theories such as enzymatic turnover could explain the difference in Δi.
Conclusions
Catalytic reactions during catalytic amplification techniques provide the continuous electron transfer current necessary for the sensing of small particles that would be extremely challenging to detect by other methods such as direct particle oxidation/reduction. In this project, a 4 nm CuZnSOD enzyme was detected on a 5.0 μm Pt UME taking advantage of the electrocatalysis and nanoimpact methods. Moreover, the calculated current amplification factor was 1.3 x 10¹⁵! The analysis of the current blips obtained in the amperometric ( i vs. t) curve were analyzed and used to propose an insight of the process occurring during the collision event. The obtained distance suggests which subunit is catalysing the event and how the latter is impacting the electrode. The magnitude correlation of the enzyme’s experimental and theoretical diffusion coefficient supports the enzymes collision events one at a time. Moreover, the electrocatalytic activity is not lost after the enzyme’s agglomeration due to the heating process, showing the robustness of the enzyme regarding electrocatalysis. The electrocatalysis of the enzyme described the aggregation phenomenon before confirming with TEM images. Catalytic amplification is a revolutionary technique permitting the reliable detection of particle order of magnitudes under the rule of thumbs limit for an electrode. With the help of this novel analysis, sensitivity in the range of fM have been accomplished. This powerful technique with such low detection limit can be used for detection of proteins, enzymes and RNAs that can serve as biomarkers in different types of malignancies and give further details of its stage. A good prediction of cancer stage will enable physicians with adequate tools for more accurate diagnosis, prognosis, and better treatments.


 nueva página del texto (beta)


