Introduction
Today 80 % of the global energy demand is covered by fossil fuels [1]. This gives rise to shortages of these and the increase in environmental problems. That is why it is important to develop clean, cheap, renewable and sustainable energy resources. The breakdown of the water molecule to produce hydrogen (hydrogen evolution reaction, HER) is a promising way to solve these problems. Additionally, the oxygen evolution reaction (OER) is used in environmental remediation applications by generating useful species for pollutant degradation [2]. Of these two half-reactions, the OER is the one that requires the greatest energy demand by applying a large overpotential for its realization [3]. For environmental issues, it has been found that the combustion of hydrogen to generate energy produces water with2many advantages, without hazardous residues whose only residue is water and without causing the increase of [4]. In addition, it has higher energy per unit mass (Table I), it can be easily stored, obtained from water, and directly converted into thermal, mechanical, and electrical energy [5].
Table 1 Heat of combustion of different fuels [5].
| Fuel | Energy (kcal gr-1) |
|---|---|
| hydrogen | 34.0 |
| petroleum | 10.3 - 8.4 |
| paraffin | 10.3 - 9.8 |
| graphite ( coal ) | 7.8 |
| castor oil | 9.4 |
| wood | 4.2 |
It has been determined that the available solar energy striking the earth’s surface at any time is equal to ca. 130 million of MW. To cover the global energy demand, three main points must be met: conversion, storage and distribution of solar energy [6]. For this reason, the conversion of solar energy into other forms of energy represents a need and an interest today, within which solar water- splitting represents a promising option [7]. The production processes of hydrogen depend on the raw materials used. In Fig. 1 we see its origin from fossil fuels and renewable resources. For renewable resources, the breakdown of the water molecule is divided into electrolysis, thermolysis and photolysis [8]. Photolysis can be compared to photosynthesis where plants convert photon energy into chemical energy such as sugars and oxygen (Fig. 2) [9]. In natural photosynthesis, plants use sunlight and, from water and carbon dioxide are produced oxygen and carbohydrates. They collect light energy through an assembly of light-harvesting chlorophylls and pump electrons to a higher electronic state inside a reaction center. Photosystems are connected in series with an electron transfer chain. This electronic transfer (charge-separation processes) included type I and II reaction centers. This process is known as the Z scheme. The artificial photosystems reactions have three reactions: light-harvesting, charge generation and separation, with catalytic reaction processes [10]. Photocatalysis are reactions that use light and a semiconductor. When the semiconductor is exposed to light is generated an electron/hole pair. Exits two types of photocatalytic reactions: Homogeneous photocatalysis: semiconductor and reactant are in the same phase, and Heterogeneous photocatalysis: semiconductor and reactant are in different phases [11]. The processes involved in photocatalytic reactions have some notable points: the photon absorption, which generates an exciton, and the efficiency of this process depends on the electronic structure of the material irradiated. Different structure reveals different visible-light response, and the overall reaction is associated with defects on the surface and crystallinity. The geometric area, where the photon is striking, limits the quantity of electron-hole pairs on the semiconductor, and it depends on the thickness of the material and the wavelength used. The exciton binding energy dictates the energy required to ionize an exciton from the lowest energy state, and it is associated with the carrier lifetime is a crucial parameter to classify the effectiveness of photocatalysts. The generated free carriers are transferred to redox-active sites on the catalyst surface. This mobility requires carrier diffusion and transport through the bulk of the semiconductor. Electrocatalytic activity is generated when the accumulation of electrons/holes at redox-active sites happens, and the electroactive species reach these regions. Mass transfer influences overall efficiency by creating a concentration gradient, while its consumption leads to the depletion of reactant concentration at the surface. The mass transport flux is affected by the size of the species, the solution viscosity, the diffusion coefficient, and species activity. Additionally, overpotential causes an additional loss of overall efficiency [12] and is the difference between the quasi-Fermi level of holes and the electrochemical potential of the solution [13]. The semiconductor electrode under lightning must be stable. This stability depends on preparation, dopant, pretreatment, dissolution, and lighting conditions [14]. A fundamental factor to calculate in photocatalysis is the solar-to-Hydrogen (STH) energy efficiency. It is the energy conversion efficiency from input solar energy to produced chemical energy.
The equation shows us how the chemical energy is produced at the rate of 𝐻2 multiplied by the charge in Gibbs free energy (25 °C). The solar energy input is the energy flux of sunlight (𝑝𝑖n) multiplied by the effective area of incident light on the semiconductor (photoelectrode). It is important to highlight the importance to using an adequate photoelectroactive area. The light sources more used in photocatalysis are xenon (Xe) lamps, mercury (Hg) lamps, and light-emitting diodes (LED). Various incident photon fluxes produce different photocatalytic performances even for the same photocatalyst. Using lamps does not allow comparing the results with the authentic sunlight. Each light source has its own working lifespan, and the experiments have to be measured when is sure the stability of the light source (each lamp has itself stability time). Other experimental errors with light sources are when the reaction use different material of the reactor, the distance between the light and the reactor, and the irradiated area of the catalyst is unequal. In addition, light sources may lead to different reaction mechanisms when not using the same lamp. The thermal effects cause promotion or decay in the photocatalytic efficiency; artificial light is fundamental in this efficiency. The Xe and Hg lamps heat up the reactor more than LED light. Finally, the light calibration has to be constant, and the lamps should be replaced when the illuminance has decreased to 70 % of the initial value [15].
Fig. 3 describes a single semiconductor as a photocatalyst with HER and OER electrocatalysts on the surface. Initially, a photon is absorbed, producing an excited hole and electron in the valence and conduction bands, respectively. The lifetime is on the femtosecond time scale. After rapid relaxation to the edges of their respective band in femto- to picoseconds, an exciton (electron-hole pair) is separated into free carriers, and the semiconductor-catalyst interface guides the electron and hole to the HER and OER catalysts, generally in nano-to microseconds. Losses of potentials happen at the interface (interfacial loss) and may originate from entropic contributions of electrons and interfacial potential barriers generated by inadequate alignment. From millisecond to second-time scales, the electron/hole are transferred to the electrocatalyst shifts,2 and the2 potentials are maintained in steady-state, propitiating the electrochemical redox reactions to produce and [12]. Generally, the conversion equipment has a 30 % efficiency for the hydrogen photoconversion reaction [16].
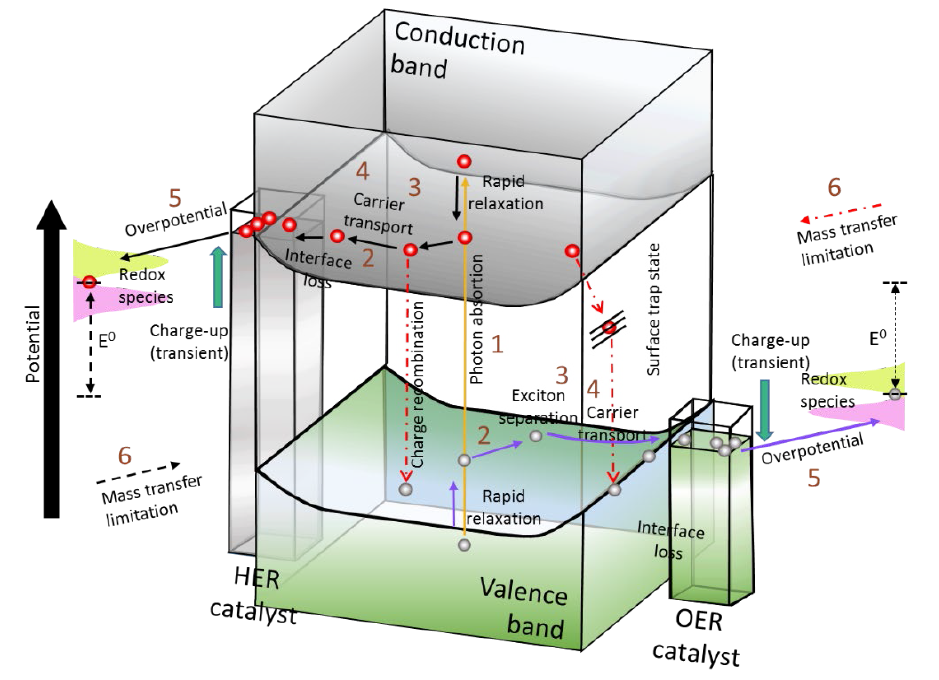
Fig. 3 Photocatalytic water splitting process, each number indicates the order of the photocatalytic process to be successful for overall water splitting. The parameters are (1) Photon absorption (Bandgap, Band positions, direct and indirect bandgap, absorption coefficient, optical penetration depth, refractive index, scattering reflection), (2) Exciton separation (exciton binding energy, dielectric constant), (3) Carrier diffusion (effective mass of carriers, carrier lifetime, carrier mobility, diffusion length), (4) Carrier transport (conductivity/resistivity, space charge layer/depletion width, flat band potential, surface state/potential determining ions), (5) Catalytic efficiency (electrocatalytic activity exchange current density, IR drop, transfer coefficient, Tafel slope, activation energy, charge transfer resistance) and (6) Mass transfer (pH gradient, diffusion “viscosity, effective ion size, activity coefficient”) [12].
These cells carry out non -spontaneous reactions, and light excitation gives the energy required to facilitate the process. However, if the selection of a semiconductor, as a working electrode, with optimum bandgap and energy levels for both conduction and valence bands, does not afford the Fermi energy required to allow the reaction to proceed spontaneously, an external bias potential should be applied to increase the efficiency of the reaction.
Transition metal oxides are widely used to perform photoelectrochemical water splitting [3]. A classical experimental setup consists of counter electrode (photocathode is usually Pt) and a semiconductor photoelectrode as working electrode (photoanode) that captures the light. −The/ℎ+photoelectrode can be n-type or p-type where it is possible to generate charge carriers (electron/hole pair) ( respectively) [1]. Following the separation of the generated charge carriers, electrons reduce water to hydrogen while holes oxidize water to oxygen [17]. A good photoelectrode must have: (1) a bandgap energy of approximately 2 eV to be photoactive with sun light and with good light absorption properties, (2) have a suitable position of the band bonds for the evolution of oxygen and hydrogen (0 and 1.23 V vs standard hydrogen electrode (SHE)), (3) efficient charge transport, (4) application of low overpotentials and (5) chemical and electrochemical stability in the aqueous environment under illumination [1,18].
It has also been found that the photocatalyst deposit structure, adhered to the surface of the transparent conductive oxide (TCO) mainly indium tin oxide (ITO) or fluorine dopped tin oxide (FTO), plays a very important role to increase the interaction between the substrate and the electrode. The use of inverse opals, given their structural arrangement generates a high active surface, and has opened a door for improving the efficiency of the reactions where this structure is used. The different methods to synthesize inverse opal structure have allowed to obtain photoelectrodes with enhanced behaviour and performance characteristics. In this review there will be analyzed the different methods to deposit templates on transparent crystalline semiconductors used as electrodes, the different semiconductor metal oxides used for water splitting with the inverse opal structure will be revised, and the2 different reaction mechanisms in the breakdown of the water molecule to obtain photoelectrochemically are discussed.
Opals and inverse opals in nature
The word opal comes from Sanskrit (upala meaning precious stone), Latin and Greek translated it as "to see a change of colour". Opals have been known since ancient times as precious stones where their most notable feature is their iridescent greenish-bluish colouration, which is due to the presence of internally trapped contaminants in their crystalline structure. This effect is known as opalescence. Natural opals consist of arrangements of silica spheres with a submicron size between 150 and 400 nm in diameter and with 𝐹e3+, 𝐴l3+ or 𝑇i4+ impurities. Between the silicate spheres, water molecules with a concentration of between 4 and 9 % are trapped, which gives it mechanical stability. The basic crystalline structure that these types of compounds present is the face-centered cubic (FCC), as can be seen in Fig. 4. The density of this type of compound is between 2.0 and 2.2 𝑔 𝑐m−3 and its hardness is between
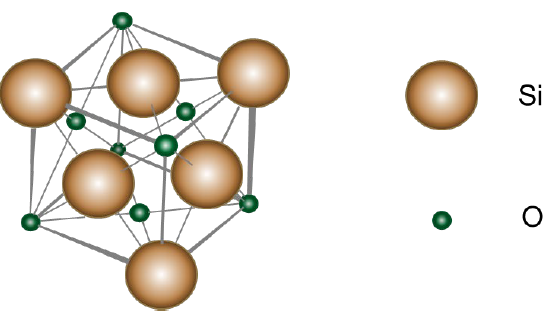
Fig. 4 Description of the general nanostructure of opals that present a Face Centered Cubic (FCC) crystalline structure [19].
In materials science, elements that have their elements with a similar arrangement of atoms to the one described above form compact systems known as opal systems. This arrangement can be built using organic2 compounds such as polystyrene (PS), polymethylmethacrylate (PMMA) or inorganics such as silicates ( ), where the spaces formed are filled with water that also contains silica. They are produced by the fusion-compression method, obtaining large crack-free films. The films formed use microspheres that are between 100 and 500 nm in diameter that have high porosity and specific optical properties. Fig. 5 shows the opaline arrangement [19,20].
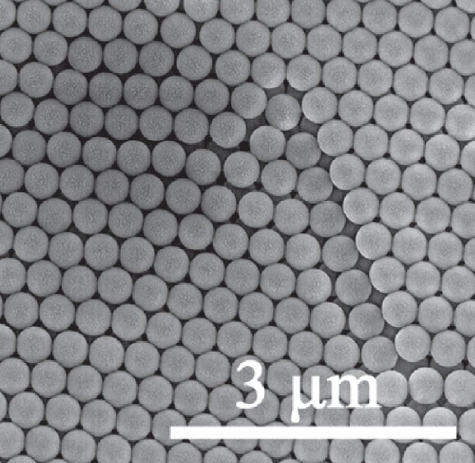
Fig. 5 Scanning electron microscopy (SEM) of the microstructure of the polystyrene template with opal arrangement [21].
The crystal structures of opal compounds include three types of basic geometries as shown in Fig. 6, one-dimensional (1D), two-dimensional (2D) and three-dimensional (3D) crystals [20].
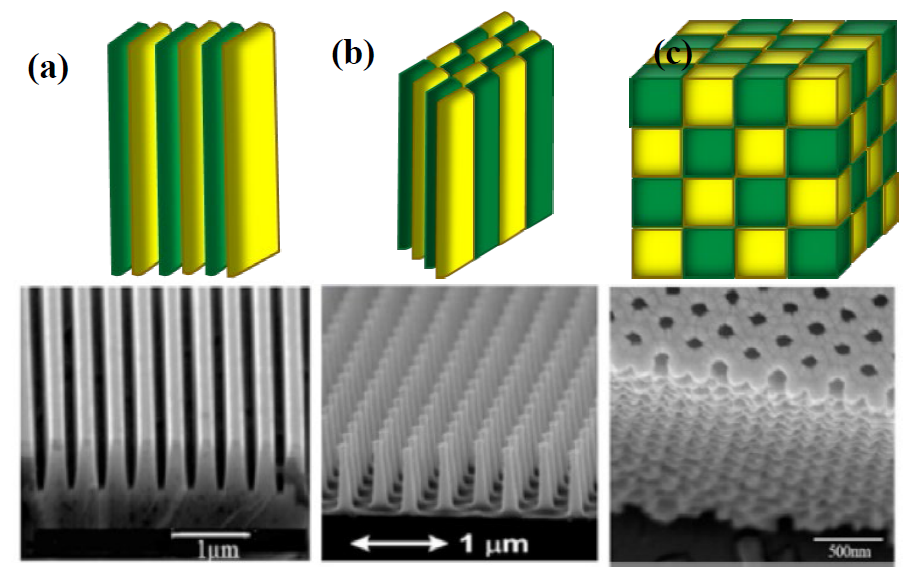
Fig. 6 Schematic representation of the opaline structures (a) 1D, (b) 2D, (c) 3D (green and yellow colors represent the periodicity of the 1D, 2D and 3D structure of the opaline structures) with their corresponding scanning electron microscopy (SEM) image [20].
Inverse opal is an inorganic material with a network of three-dimensional, organized, well-defined pores of different thicknesses. These macroporous and mesoporous structures are interconnected, increasing mass transport through it (Fig. 7). Their arrangement allows to increase the specific surface area, and with it the active sites increase, and the selectivity improves [22]. Applications whose activity or efficiency depend on the surface are benefited by using materials with this geometric arrangement.
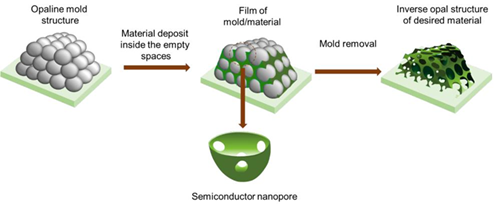
Fig. 7 Schematic diagram of the preparation process and structure of nanoporous films with inverse opal structure [26].
To obtain them, a series of steps are required according to Fig. 7. First is the synthesis of the monodisperse polymer, or the silicon colloids, via surfactant-free emulsion polymerization or by the Stöber method [23,24], respectively. These colloids are then crystallized to form a colloidal crystal template or synthetic opal (typically a FCC arrangement with a solid fraction of ~74 % by volume). By different methods, perfectly ordered coloidal crystals can be obtained from submicrometric spherical colloids, polymers and colloidal silicon, as will be seen later. The opal thus generated is used as a sacrificial template to fabricate inverse opal consisting of a FCC arrangement of air spheres (macropores) in a solid matrix. To obtain the inverse opal, the interstitial void in the colloidal crystal template (26 % volume of the structure) is filled with a solid material via sol-gel, electrochemical, or nanoparticle infiltration. The opal template is finally removed by dissolution or calcination [25].
The synthesis of inverse opals helps a greater stability of the material and improves properties that depend on the active surface, allowing them to be used as photonic crystals, materials in catalysis, solar cells, separation of compounds, optical sensors in optoelectronics [27,28], capacitors, gas sensors [29]. Inverse opals are of great interest because they present high and ordered porosity with adjustable periodicity and excellent optical properties [21,30]. In addition, the order of the holes in solid matrices increases the surface area and porosity [31], which increases their catalytic activity by increasing the catalytic sites and improving the diffusion of species in the medium redox pair material inside the electrode in the case of electrochemistry [26]. The average size of the pores depends on the template used3− 1(Table 2 and Table 3) and allows us to determine2−1 important factors such as the total pore volume ( = ), the specific surface area ( = ). Its characteristics help us to explain the amount of light absorbed by the material or photoelectrode, as well as the internal scattering of light [32,33]. There are different methods used to generate these and they will be analyzed in the next section [30].
Table 3 Comparison of pore diameters of inverse opals fabricated by different techniques [38].
| Template | Template diameter (n𝑚) | Synthesis method | Inverse opal pore diameter (nm) | Pore volume in inverse opal (x10-11 𝜇𝑚3 ) | Reference |
|---|---|---|---|---|---|
| PS sulfonated | ~80~120 | Ultrasonic spray pyrolysis | ~80 | 0.2144 | [39] |
| Polystyrene (PS) | 226 | Chemical bath | 148±14 | 1.357 | [34] |
| PS | 230 | sol-gel | 180 | 2.442 | [40] |
| PS | 270, 300 and 350 | sol-gel | ~250 ~260 | 6.545 7.362 | [41] |
| PS | 300 | Oil-water interfacial assembly | 280 | 9.195 | [42] |
Table 3 shows the fabrication of inverse opal by rapid crystallization at room temperatures and the calcination-induced shrinkage of the opaline matrix. The synthesis method coupled with annealing makes the monodispersity of the holes different from each other. The chemical bath gives us less control of decreasing inverse opal, and ultrasonic spray control shows better control for this board [38].
Table 4 is a compilation of the number of spheres of different radius that constitute 1 3 of opaline material. The catalytic behavior of the electrodes improves to have a high surface area, optimal electron pathway, and efficient mass transport. The inverse opal provides a large surface area and interconnected channels for rapid species transport. The sphere size limits area (active sites) and transport of mass (species). The superficial area depends on the number of spheres deposited on the surface of the electrode [43].
Synthesis of opaline (inverse opal)
The structure of the inverse opals depends on the homogeneity of the polystyrene or silicon template. The deposit of high-quality films must have well controlled synthesis parameters such as: hydrophilicity of the substrate surface, angle of inclination, temperature, humidity, solvent and added surfactant. High quality nanostructured photoelectrolytic opals allow easy filling of the precursor solution from the innermost to the outermost part of the opal [36]. Following the general diagram of Fig. 7, each of the stages is described in detail below.
Vertical submersion
The first step for the formation of the template is the self-assembly of the silica or polymer. Monodisperse polymethyl methacrylate (PMMA) can be used as a template. It is synthesized from°C methyl methacrylate (0.3 or 0.4 L)Ndissolved2 in 1.6 L of water. The solution is heated to between 70 and 80 with vigorous stirring and under a atmosphere. To start the polymerization, 1.5 g of 2’azobis (2-methylpropiamidine) dihydrochloride is added rapidly and the reaction is continued for three hours. Finally, the suspension obtained is immediately cooled, filtered through fiberglass, and stored in the absence of oxygen. To carry out the deposit of the polymeric template, the PMMA obtained is dissolved with water up to a volume of 500 mL where the TCO is manually submerged vertically, as seen in Fig. 8. For the formation of the PMMA template sheet, a peristaltic pump is used that works at a flow of 0.3 mL min−1. At this speed, template thicknesses between 5 and 7 μm are obtained. The PMMA template is removed by calcining the electrode up to a temperature of 300 °C with a rate of 2 °C min−1 and holding the temperature for 2 hours. Then the temperature is increased from 300 to 400 °C with a ramp of 2 °C min−1 and retaining the maximum temperature for 2 hours [25]. The vertical submersion method can also be done with Styrofoam as a template and without using the peristaltic pump for colloidal solution removal. This process is known as simple evaporation [30].
Traction method
This method involves submersion using mechanical assistance from the TCO in a polystyrene (PS) suspension. One way to prepare the polystyrene suspension is to add 30 mL of styrene to 150 mL of water with °C 0.2 mg of potassium persulfate dissolved in 20 mL of deionized water. The styrene is polymerized at 70 in an Ar atmosphere for 6 hours, the resulting solution is centrifuged, the PS is kept in deionized water. On the other hand, the TCO is washed with deionized water and absolute ethyl alcohol to be later submerged vertically by the equipment in the manufactured polystyrene dispersion, as can be seen in Fig. 9 cm.It miniskept−1 submerged for 3 minutes and then moved through the upper part of the container at a speed of 5 cm min−1, causing°C the polystyrene to adhere to the surface of the TCO. At the end of this operation, the sheet is dried at 40 for 10 min. Then the TCO/PS sheet is submerged again, repeating the operation described above until the appropriate thickness is obtained. A thickness of 6 μm of inverse opal has been obtained by doing three times the aforementioned operation with 1 μm diameter PS spheres in FTO [26].
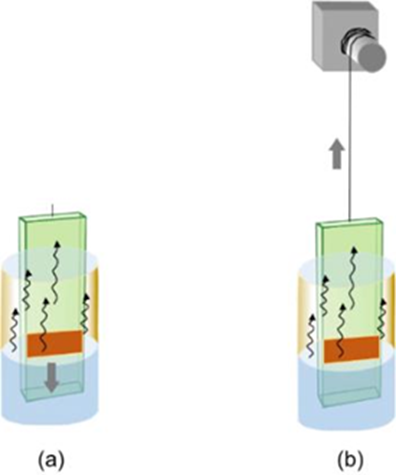
Fig. 9 Vertical deposit (a) original configuration, (b) combination with a slow lifting of the sample (traction) [19].
Electrophoretic deposit
The speed of formation of colloidal films turns out to be very slow, it can occur in weeks. Due to such a situation, it is not possible to carry out the formation of polystyrene template on an industrial scale. Electrophoretic deposition (EPD) is characterized by the migration of colloidal particles in a liquid that is under the influence of an electric field (electrophoresis) and their subsequent deposition on an electrode or polarizedNHsurface4OH as shown in Fig. 10 [44]. The polystyrene is dissolved in a 92.5 % ethanol and 7.5 % water mixture. A 30 % aqueous solution is added to the above solution until a pH of 10.5 is reached so that the polystyrene is negatively charged. The solution is stirred ultrasonically [45]. The use of ethanol as a solvent decreases the decomposition reaction of water and therefore the elimination of bubble formation. For the deposit, a TCO is used, which can be a FTO/glass sheet (anode) V cm and stainless steel as a counter electrode (cathode) (Fig. 10(a)). To use this technique, the distance−1 between the two electrodes is generally 1.0 to 2.5 cm and the appropriate voltage is between 3 and 5 direct current for 5 minutes. The negatively charged polystyrene will be deposited on the anode. For this process, the potential has been imposedmmbymeans−1 of pulses of determined duration (Fig. 10(b)). The substrate is withdrawn at a speed between 1.0 and 3.0 and the electrode is placed in a glass desiccator containing anhydrous calcium sulfate [45,46].
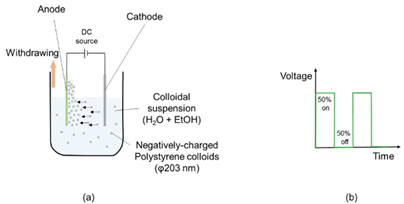
Fig. 10 (a) Schematic diagram of electrophoretic deposition (EPD) of colloidal polystyrene. Anode: FTO/glass or FTO/polyethylene terephthalate (PET), and cathode: stainless steel sheet. (b) Schematic of the voltage pulse program [44].
Centrifugal sedimentation method
Another way to obtain the inverse opaline structure is by centrifugal sedimentation, as shown by Nishijima Y., et. al. 2007. Firstly, a colloidal suspension of PS microspheres is made, which is placed in a cylindrical stainless steel container. In the internal base of the reactor, the electrode to be covered is placed submerged in the colloidal suspension. The stainless steel°C container is centrifuged, as shown in Fig. 11, at 5000 rpm for 10 minutes. It is then dried and annealed at 90 for 3 minutes.
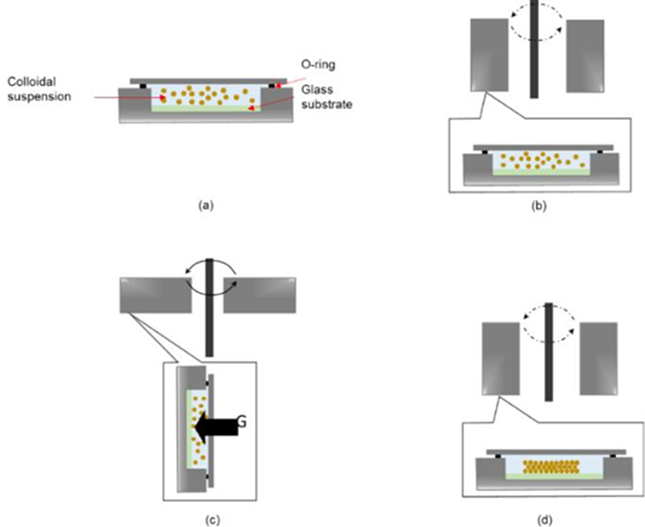
Fig. 11 Diagram of the centrifuged sedimentation process. (a) the glass substrate is attached to the bottom of a cylindrical container and the PS colloidal suspension is placed, (b) the open part of the container is sealed with a glass slide and the colloidal suspension is allowed to settle by gravity, (c) centrifugation begins and the samples are aligned horizontally, and (d) centrifugation ends where the cylindrical containers are vertically realigned, obtaining the opal with a uniform thickness on the glass substrate [28].
If the material in which the gaps will be filled is placed in the colloidal suspension, the gap between the spheres can be filled in the same process, giving rise to the formation of the template and its filling with the desired material in a single process.
Coating by centrifugation (spin coating)
This procedure can be done with silicon or PS spheres. To make the dissolution of the polymer, the forces of Van der Waals and the force of attraction of the surface are considered. The concentration of the solution will depend on the diameter of the spheres. Here it is necessary to have a polydispersity < 5 % to obtain a good packing. Fig. 12 shows us the addition of the solution containing PS spheres in a rotating disk with a sample of FTO on its surface. When a high concentration of spheres is used, several 3D layers are formed. Conversely, low concentrations form unwanted spaces and defects in the PS monolayer. The speed of rotation depends on the radius of the substrate and its mass, as the mass decreases the angular speed increases to compensate for the centrifugal force, which becomes less effective. Table 5 shows us how a smaller sphere size and less weight has a greater angular velocity acceleration than when it has a larger size and greater weight. Angular velocity can reach up to 6000 rpm.

Fig. 12 Self-assembly process of the colloidal crystal, infiltration with the PS sol-gel precursor [46].
Table 5 Optimized rotation parameters for different sphere sizes for a concentration example. Rotation time of 100 s [46].
| Sphere size (nm) | Wr % spheres | Rotational speed (rpm) | Acceleration (𝐫𝐬−𝟏) |
|---|---|---|---|
| 100 | 4.5 | 6000 | 6000 |
| 300 | 6.3 | 6000 | 400 |
| 480 | 7.1 | 6000 | 250 |
| 600 | 7.7 | 6000 | 200 |
Use of monodisperse silicon spheres
For the synthesis of the inverse opal can be from the formation of monodisperse silicon opals [47]. To do this, initially a saturated ethanolic solution of ammonium hydroxide is mixed. It is important to mention that ammonium works as a catalyst for the formation of spherical particles. As a second step, tetraalkyl silicate is added and stirred in an ultrasonic bath in order to keep the particles formed in suspension. Supersaturated silicic acid is then added for condensation to occur. This reaction can be corroborated by the opalescence that the solution takes, where from 1 to 5 minutes 𝑆iO2 spheres are obtained [48]. Different solutions can be used to form the silicon oxide suspension, such as ethylene glycol [49], ethanol-pentylester, methanol:propanol 1:3 mixture [48]. The diameter of the SiO2 spheres obtained depends on the reaction time, so the shorter the time, the smaller the diameter of the spheres obtained. Among the diameters that have been used for opal synthesis are: 440 nm [50], >500 nm [49], < 0.2 μm [48], 500 nm [51]. The SiO2 particles settle by gravity for a period of 5 to 20 days on the surface to be used as a support, this allows the growth of the solid phase of the opals, and finally the sediment is dried [50]. The formed opals are joined together giving mechanical stability to the template and controls the void volume of the opal helping in subsequent synthesis such as the formation of inverse opals. Finally, the silicon template is removed using a hydrofluoric acid-based etching procedure [49]. Another way to obtain silicon opals is by the confined convective assembly method (Fig. 13). An aqueous suspension of colloidal silica with a concentration of 10 % by weight and a diameter of 500 nm is synthesized. The colloidal suspension is placed in a stainless steel current collector with a 50 μm gap from the container. The back of the substrate is lifted at 30 𝜇𝑠−1 while air is added to the meniscus formed at the interface of the substrate and the colloidal suspension. The higher the speed, the less thickness of the silica monolayer and vice versa. The thickness is also controlled by the number of cycles applied, so we have that the greater the number of cycles, the greater the thickness obtained from the monolayer. Finally, the silica opals are removed using hydrofluoric acid [52,53]. This method has the disadvantage of the possible instability of the material used to generate the inverse opal when it is in contact with hydrofluoric acid and that in some laboratories the use of hydrofluoric acid is highly controlled.
Atomic Layer Deposit (ALD)
This technique infiltrates the sacrificial template (PS or SiO2), in the form of thin films. The inverted structure will be periodically ordered depending on the template obtained on the initially desired surface. Layers with controlled thickness can be obtained from water vapor precursors and substrates that can give rise to many materials with their own structural characteristics. The infiltrated structures are obtained at relatively low temperatures below 85 °C (lower than the glass transition temperature of PS 95 °C) to avoid damaging the template. Cycles are used where the substrate is dissolved in a chamber at a temperature above 80 °C (as shown in Fig. 14(a)), and the plate containing the opaline structure is located in another chamber at a temperature of 85°C and pressure of 5 x 10⁻¹ mbar. Nitrogen is used as stripping gas and it is found in containers at low pressures (9 x 10⁻² mbar). The residence time of each cycle can last up to 60 minutes and have a heating rate of 1 °C min−1 [54,55]. On the other hand, Scharrer M. et al. (2005) have used reaction times of 2.0 s per 30 s N2 purge followed by 4.0 seconds H2O exposure and again another N2 purge. This technique is easy to maintain since it does not require frequent cleaning, the generated residues are the chemical solutions used for the synthesis, therefore it generates low contamination; besides this technique controls the thickness of the films generated at the nanometric level and is easily deposited in a rough surface [56]. Finally, it is recommended to remove the polystyrene template calcining at 550°C for 30 minutes [57].
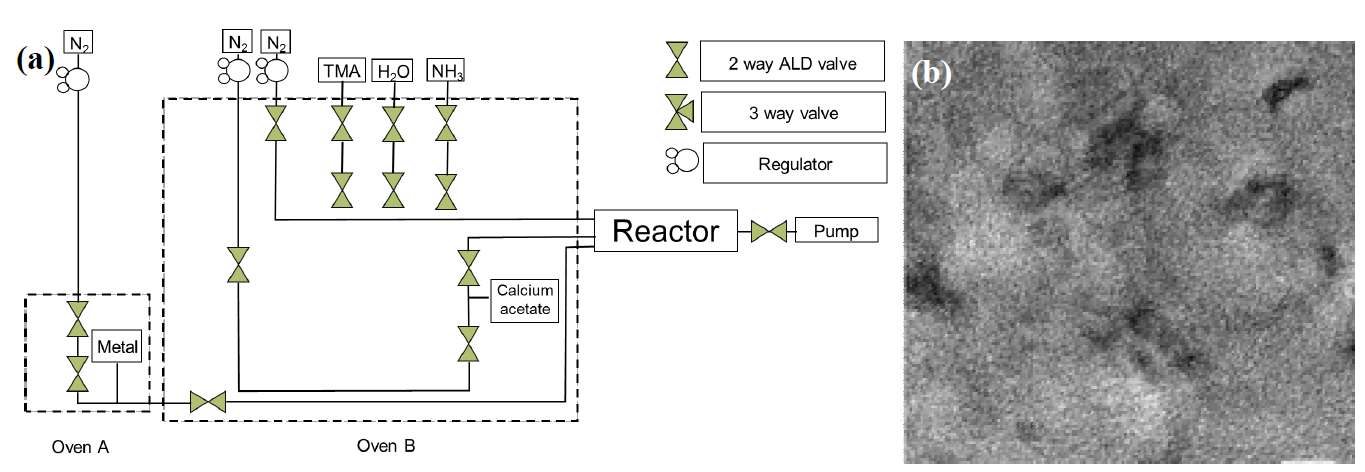
Fig. 14 (a) General diagram of the atomicMg0 . 25layerCa0deposition.75O/Si3N4(ALD) method. (b) transmission electron microscopy (TEM) micrograph of the membrane obtained by ALD [58].
Reversible periodic potential (pulses)
The current/potential is applied in the form of modulated waves (Fig. 15(b)) controlling the on and off time (ton and toff, respectively). The duty cycle helps control the electrochemical process that affects diffusion layer, grain size, and nucleation. This is defined as:
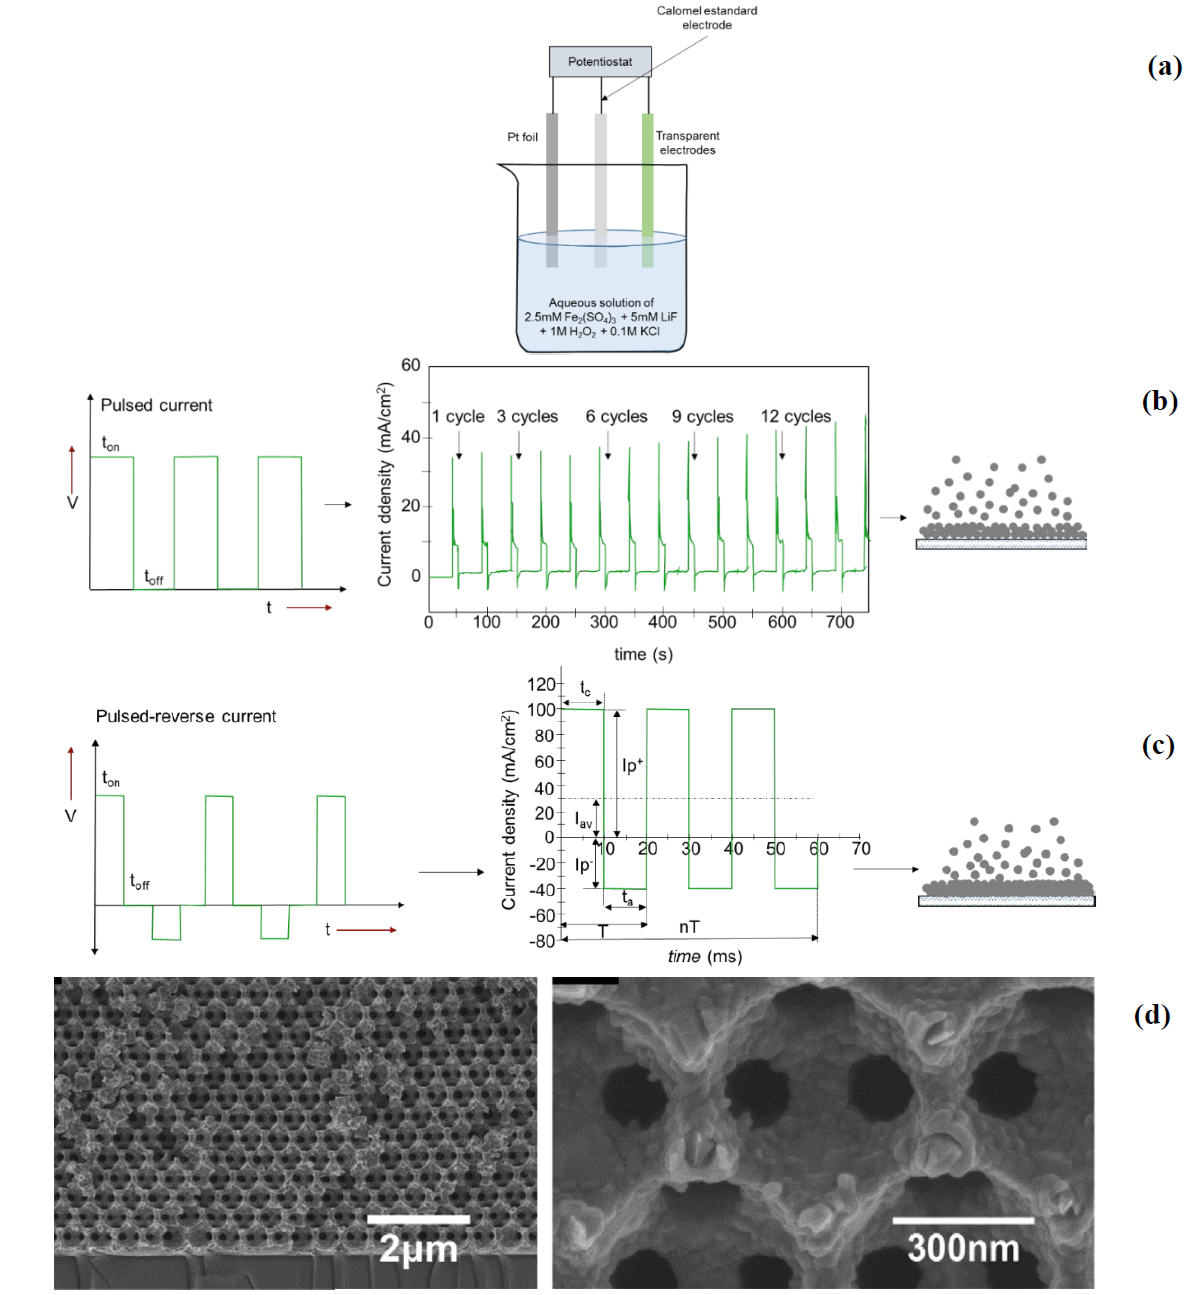
Fig. 15 (a) Three electrode electrochemical cell with FTO working electrode, Pt counter electrode and standard calomel electrode. (b) Scheme of pulsed electrodeposition and (c) and reverse pulse with the expected growth process. 𝐼𝐼p+ is peak positive current density, 𝐼𝐼p− peak reverse current density, 𝐼𝐼av average current density, T cycle time, 𝑡 c cathodic time, 𝑡 a anodic time [59,61,63]. (d) SEM image of hematite deposited by reverse pulse on a glass slide coated with Cr and Au and Ni opal on its surface [62].
toff helps the formation of new nucleation sites, decreasing the porosity and roughness of the deposit. The reverse pulse is when short anode pulses are applied alongside the cathode pulse (Fig. 15(c)). The anodic pulse causes electro-oxidation to occur on the deposited surface, removing impurities to obtain a smoother surface [59].
Conductive material or electrode is required to make the electrodeposition which is submerged in a neutral aqueous bath. The reaction is carried out in a three- electrode cell with FTO being the most common working electrode, a Pt sheet as the counter electrode, and Ag/AgCl the reference electrode for aqueous media (Fig. 15(a)). Before carrying out the deposition reaction the FTO is rinsed with deionized water and dried in a flow of air. With this technique it is recommended to carry out a cyclic voltammetry to the precursor solutions to know their behavior in the FTO, verifying that there are no alternate reactions in the working electrode once the potential has been selected based on the above. An anodic overpotential is applied followed by a cathodic overpotential for a certain time in each process, being only a few seconds as shown in the Fig. 15b. With the anodic overpotential, the elimination of the excess metal deposited on the working electrode is ensured [60], likewise, it allows the diffusion of the metallic ion from the electrolyte solution towards the working electrode, decreasing the concentration gradient when the cathodic potential is applied again [61]. The number of repetitions applied (cycles) will indicate the thickness of the inverse opal obtained. The greater the cathodic overpotential, the faster the cathodic deposition will be and the more anodic the dissolution of the deposited undesirable metal. The correct selection of the time of the cathodic and anodic process as well as its potential are crucial factors for the adequate deposition of the desired metal within the void space of the opal structure. The calcination of the template allows obtaining the structure of the inverseNi opal [60]. Fig. 15(d) shows electrodeposited hematite by SEM with inverse pulse voltage on a glass support and opal on its surface [62].
With fixed potential
Generally, both the applied overpotential and the composition of the electrolyte in the tank are controlled. In this technique the surface is subjected to a constant potential (Fig. 16(a)), which governs the shape of the crystal below or near the conditions of thermodynamic equilibrium. Above equilibrium (high overpotential) the shape of the crystal is dominated by mass transport and surface properties. Under these conditions, metal ions are consumed faster than their transport speed, so crystal growth is limited by the diffusion of these ions. For electrodeposition, a three-electrode electrochemical cell is used (Fig. 15(a)). A semiconductor crystal such as the FTO with PS template can be used as the working electrode. This semiconductor is rinsed by sonication for 20 minutes in deionized water and then dried under N2 flow. Graphite or Pt that has been rinsed with deionized water beforehand is used as the counter electrode. The reference electrode is Ag/AgCl with a 1 M KCl solution [64]. It is necessary to apply the cyclic voltammetry technique to know the potentials in which the metal or metal oxide deposit occurs from the solution in which it is prepared [65]. The calcination of the template allows obtaining the structure of the inverse opal deposited (Fig. 16(b)) (varying the potential low potential and high potential).
Sol-gel
The manufacture of inverse opals by this method requires high temperatures and allows easy control of the volume of the precursor. In addition, the reaction conditions that are used are easy to prepare. The precursor is prepared by sol-gel and is cleaned with distilled water. It is infiltrated into the template by the submersion method, as shown in Fig. 17. This allows the nanoparticles to be deposited on the walls and cavities of the template. The dipping process should be repeated one or two more times to ensure complete infiltration of the template into the precursor solution. Finally, it is calcined to eliminate the template [67]. Table 6 is summarized the methods of obtention of inverse opal in this review and its differences.
Table 6 Synthesis of inverse opals from opal systems.
| Method | Template | Characteristics | Conditions |
|---|---|---|---|
| Atomic Layer Deposit | PS or SiO2 thin films | Water vapor precursors and substrates in pressure chambers (0.5 mbar) | Conductive material inside the chamber and a fluid of 𝑁𝑁2 carrier gas at 85°C with water vapor precursor. Finally calcination is applied. |
| Electrodeposit (reversible periodic potential “pulses”) | PS | Three-electrode cell FTO - working electrode Pt sheet - auxiliar electrode Ag/AgCl - reference electrode | Conductive material submerged in a neutral aqueous bath and apply 1° anodic overpotential (large time) 2° cathodic overpotential (short time). Apply calcination. |
| Electrodeposit (fixed potential) | PS | Three-electrode cell FTO - working electrode Pt or graphite - auxiliar electrode Ag/AgCl - reference electrode | Conductive material submerged in a neutral aqueous bath and know the potentials apply an overpotential which the metal or metal oxide deposit occurs. Apply calcination |
| Sol-gel | PS or SiO2 | Crystal material | Precursor in sol-gel is infiltrated into template by the submersion and heated for evaporation and calcination. |
Materials with inverse opal structure of interest in photoelectrochemical water-splitting
In this section we will focus on the materials that have been used to develop photoelectrodes for water-splitting and where the inverse opal structure has been used.
Zinc oxide (𝐙nO)
The ZnO photoelectrode is classified as an n-type binary semiconductor due to the interstitial zinc and vacant oxygen atoms in its crystal lattices. It has been studied as a photodetector, photodiode, gas sensor, solar cells, supercapacitors, optoelectronic and piezoelectronic equipment, batteries for energy or hydrogen storage, biosensors to capture biological molecules (glucose and cholesterol) in aqueous solutions [68]. Their interest as a photocatalyst is due to their environmentally friendly, low cost, low toxicity, and efficient photoelectrocatalytic behavior [69,70]. It has a band gap of 3.37 eV (368 nm) [17] and presents different colors when annealed at different temperature ranges (100-400 °C dark color, ~550°C transparent) [71]. It presents an excellent electron mobility (up to ~ 1000 cm2 V −1) [69] being higher than that of TiO2. It has a great efficiency in the transfer of the electron, making the lifetime of the e−/h+ pair longer and decreasing the recombination rate. It absorbs 4 % of the solar spectrum (Fig. 18), which means that its photoactivity in the visible is very small. The minimum conduction band has an energy of -0.31 V vs NHE and the maximum valence band is 2.89 V vs NHE [4,72]. The main crystalline structure used in photoelectrochemistry is wurtzite, which presents a hexagonal close-packed crystalline structure (hcp) with space group C6cmc (Fig. 19(a)). It has planes composed of coordinated O2− and Zn2+ tetrahedral ions stacked along the c axis (Fig. 19(b)). The size of the wurtzite edges is a = b = 0.32 nm and c = 0.52 nm [69,73] and it has a binding energy of 1021 eV for Zn 2𝑝𝑝32and 1044 eV for Zn 2𝑝𝑝12 [74]. Its structure presents the following crystallographic planes (100), (002), (101), (110), (103) and (112) [75]. The compact hexagonal structure can intersect with another hcp to form tetrahedral arrangements, regularly occupied by four Zn atoms, and hexagonal arrangements with twelve atoms, as shown in Fig. 19(c). Crosslinking makes the crystal thermodynamically stable. The unit cell of this type of compounds exhibits two types of low index surfaces: (1) polar surfaces (001) terminated with oxygen and (001) terminated with zinc and, (2) nonpolar surfaces (100). It has a minimum conduction band with energy of -0.31 V vs. NHE and maximum valence band of 2.89 V vs. NHE allowing the oxidation of water [76,77]. ZnO has a low enthalpy of formation, causing it to present vacancies when oxygen desorption occurs near the surface of the crystalline system, thus we have:
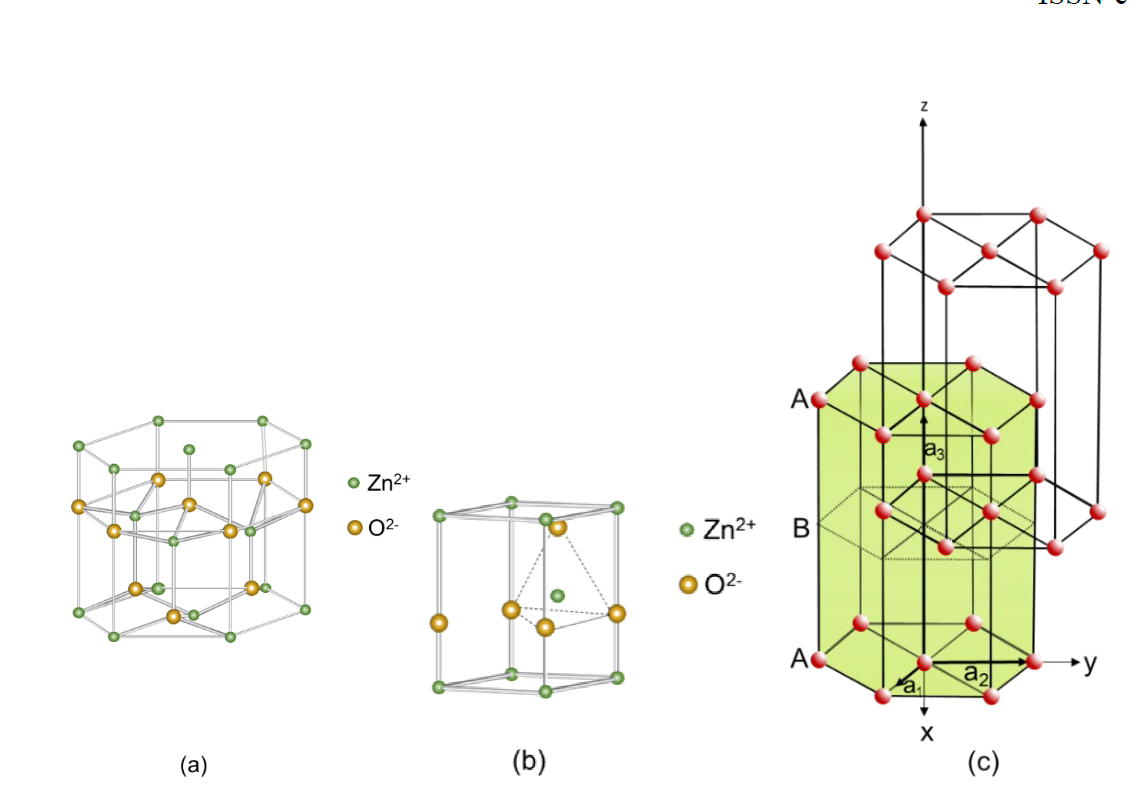
Fig. 19 (a) Close-packed hexagonal crystal structure of wurzite (ZnO) (b) ZnO tetrahedral crystal and (c) Penetration of two hexagonal structures for the formation of a close-packed hexagonal structure [69,77].
The amount of oxygen that is near the surface in the crystal arrangement depends on the morphology of the ZnO on the conductive surface. Table 7 shows that said morphology is subject to the electrolyte used for anodizing. The amount of oxygen will indicate the number of vacancies formed in the crystalline arrangement, this in turn influences the forbidden band of the photoelectrode [68], since the number of vacancies that trap electrons photogenerates changes, causing the recombination of the e−/h+ pair to decrease or increase. The greater the number of vacancies, the greater the charge transport, the greater the photocurrent density and consequently, the greater the oxidation reaction of water [74]. The vacancies formed by oxygen have an energy of ~1 eV on the edge of its valence band [17].
Table 7 Morphologies and bandgap of ZnO nanostructures reported in the literature, obtained by electrochemical anodization using various types of electrolytes [68].
| Electrolyte ( aqueous solution ) | Morphology | Band gap (eV) | References |
|---|---|---|---|
| NaOH + NH4 F + H2O + C2H6O2 | Nanowires | [ 3.19 - 3.22] | [68] |
| H2O, NaOH, H2C2O4 or CH3OH + HF | Nanopores | [ 3.10 - 3.87] | [78-82] |
| C2H5OH H2SO4,C2H5OH+H3PO, (NH4)2SO4 or (NH4)2SO4+NaOH | nanoflakes | --- | [83-86] |
| NaOH,C2H5OH+NaOH,C2H5OH+H2+C2+O4,CH3OH+HCl, C2H5OH+HNO3 or C2H5OH+HF | nanoflowers | ~3.50 | [82,84,85] |
| Nanosheets | --- | [87] | |
| Nanowires | 3.19 - 3.50 | [82,85,88-93] |
It has also been found that using different annealing temperatures can modify the ZnO electrode. For example, annealing at 700 ℃ helps the generation of p-type ZnO by increasing defects in the crystal grain arrangement. At this temperature there is a maximum concentration of interstitial oxygen (Oi) and a minimum concentration of interstitial Zinc (Zni). Zinc acts as a donor (VO, Zni), while oxygen acts as an acceptor (VZn, Oi) [94].
In Table 8 it can be observed the size in diameter of the ZnO inverse opal due to the use of different methods of depositing the polystyrene template. By the sol-gel method, from polystyrene spheres of 300 nm in diameter, the ZnO inverse opals obtained have a pore size of between 250-260 nm. By the oil-water interfacial assembly method, inverse opals obtained from ZnO have a pore size of 280 nm in diameter [38]. In Fig. 20 we see the inverse opal structure of ZnO with great softness and quality in its structure [95]. Table 9 shows the behavior of different types of ZnO nanodeposits with the corresponding current density.
Table 8 Comparison of the pore diameter of the ZnO inverse opal [38].
| Template | Template diameter (nm) | Synthesis method | Inverse opal pore diameter | References |
|---|---|---|---|---|
| Polystyrene (PS) | 270, 300 and 350 | sol-gel | ~250-260 | [41] |
| PS | 300 | Oil-water interfacial assembly | 280 | [42] |
| PS | 230 | sol-gel | 180 | [40] |
| PS Sulfonated | ~80-120 | Ultrasonic spray pyrolysis | ~80 | [39] |
| PS | 226 | Chemical bath deposit | 148 ??14 | [34] |
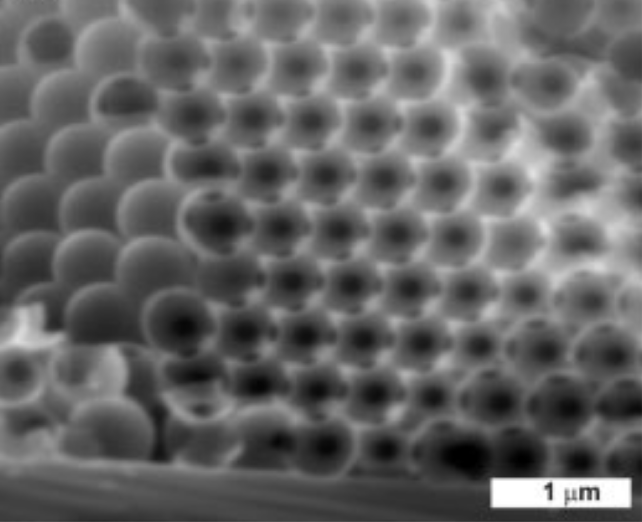
Fig. 20 SEM image of inverse opal of ZnO from opal of polystyrene spheres of 500 nm in diameter [95].
Nickel sulfide (𝐍iS)
Nickel sulfide is a p-type semiconductor [97]. Metallic sulfides are attractive because of their abundance in the earth, cheap, active in visible light, and small bandgap [98]. They present good thermal and mechanical stability, excellent redox reversibility, conductivity and capacitance. Nickel sulfides consist of different compounds with different phases and stoichiometry such as: NiS, Ni3S2, NiS2, Ni3+xS2, Ni3S4, Ni6S5, Ni4S3+xand Ni7S6. The most used phases are: Ni3S2, Ni3S4, NiS2 and NiS. NiS (also represented as Ni1−δS) presents two different crystalline arrangements: 𝛼𝛼−𝑁𝑁𝑁𝑁𝑁𝑁 (hexagonal nickeline phase) (Fig. 21(a)) with six sulfur atoms and one nickel atom and with cell parameters a = 0.34422 (3) nm, c = 0.53588 (3) nm, α = β = 90° and γ = 120° [99]. β−NiS (rhombohedron millerite phase) (Fig. 21(b) and Fig. 21(c)) with five coordinated sulfur atoms and one nickel atom. Of these two structures, β−NiS has a better catalytic efficiency than α−NiS. α−NiS is obtained by annealing at 200 ℃ at a ratio of 0.95:1.05 while at 400 ℃ β−NiS is obtained at a ratio of 0.99:1.01 [100]. The binding energy of α−NiS for S 2𝑝𝑝32= 161.65 eV and of β−NiS is S 2𝑝𝑝32= 161.7 eV. The α and β−NiS havethe same binding energy for Ni 2𝑝𝑝32= 853.1 eV [99]. The absorption spectrum of β−NiS is 4.8 eV. The bandgap of α−NiS is 0.8 eV and of β−NiS is 1.0 eV. Likewise, the conversion efficiency of the incident photon to electron (𝜂𝜂) of α−NiS is 5.2 % and for β−NiS it is 4.2 % and its filling factor is 67 % and 63 %, respectively. NiS parameters: (100), (101), (102) and (110) [101]. Parameters of α−NiS: (100), (002), (101), (102), (110), (103), (200), (112), (004) and (202). Parameters of β−NiS: (110), (101), (300), (021), (220), (211), (131), (410), (401), (321), (330), (012), (122), (600) and (042) [102]. The α−NiS presents a better photocatalytic activity than the β−NiS due to the band edge potential of 1.83 eV that influences a higher generation of e− y ℎ+ [98]. Fig. 22 presents the absorption spectrum of α−NiS and β−NiS. This compound has been used mainly in the hydrogen evolution application and as cathodes in lithium batteries.
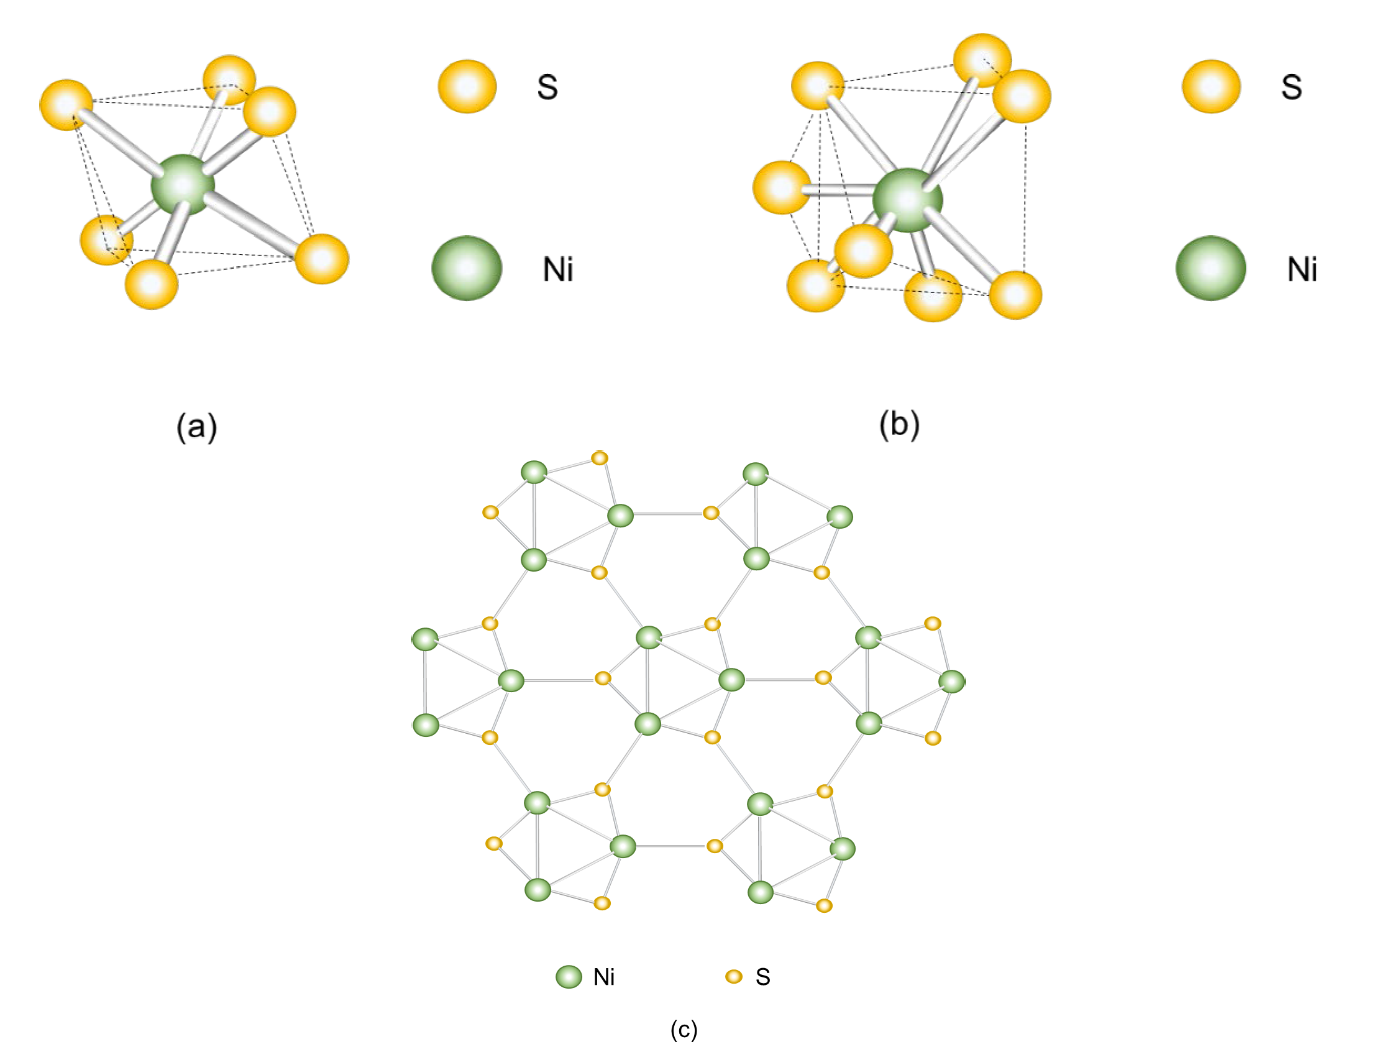
Fig. 21 Crystal structure of (a) nickeline (α−NiS), (b) millerite (β−NiS) [103] and (c) millerite viewed along the [001] plane [100].
For its synthesis, the following is sought: (1) to increase the intrinsic activity of the oxygen evolution reaction, optimizing the Gibbs free energy by the absorption of OH− groups and avoiding the capture of chemical agents. Thus, using 1.0 M KOH, a Faradaic redox reaction of M2+/M3+ (M=Mo ,Cu ,W ,Co ,Ni and Fe) occurs from the metal sulfide that couples with the OH− group present in the electrolyte, occurring:
(2)increase the electronic conductivity and density of the electrochemical active sites, and (3) optimizethe mass transport properties [104].
One way to deposit NiS on a glassy conductive material is by the reversible periodic potential method (Section reversible periodic potential “pulses”). An aqueous solution is prepared containing 50 mL of 50 mM NiCl2∙6H2O and 1.0 M thiourea. Thiourea is electrochemically inert on the FTO surface. The cathodic deposition is carried out with an overpotential of -0.9 V for 24 seconds and immediately the anode overpotential of 0.1 V is applied for a time of 6 seconds, this operation is repeated 10 times to obtain an adequate thickness. An increase in instantaneous anodic current is attributed to the presence of metallic Ni deposited on the electrode, an increase in instantaneous cathodic current during the anodic process indicates the presence of Ni2+ on the FTO electrode surface [60].
In Table 10 we can see the influence of morphology and structure on electrochemical behavior due to the increase in surface area and roughness. As the surface area increases, the active sites increase and the electrolyte diffusion pathway and charge transport decrease [105]. The capacitance concept bifurcates into two types according to its charge storage mechanisms; one is electrical double-layer capacitance Cdl, generated from charge separation at the electrode/electrolyte interface and determined by the effective surface area and the dielectric constant of the electrolyte, and pseudocapacitance Cp, generated from fast faradic reactions of the electrode material. Pseudocapacitance is produced from a bulk process, whereas double-layer capacitance works from a surface process. The specific capacitance indicates the charge/discharge capability and its dependence on a large surface area, high specific capacitance means a large reaction area [106]. Fig. 23 presents an SEM micrograph of NiS inverse opal electrodeposited on FTO.
Table 10 Comparison of the specific capacitance (Cm) of different NiS electrodes with different crystal forms [105].
| Morphology | Current density | Electrolyte | 𝐂𝐦 (𝐅 𝐠−𝟏) | References |
|---|---|---|---|---|
| Microflowers | 1 A g−1 | 3 M KOH | 1122.7 | [105] |
| Graphene nanospheres / NiS films | 0.5 A g−1 | 6 M KOH | 775 | [107] |
| Hollow spheres | 4.08 A g−1 | 2 M KOH | 927 | [108] |
| Nanoparticles | 1 A g−1 | 6 M KOH | 845 | [109] |
| Nanosheets | 2.5 mA cm−2 | 2 M KOH | 527 | [110] |
| Inverse opal | 1.25 mA cm−2 | 0.1 M LiI; 0.03 MI2; 0.3 M 1,2-dimethyl-3- propylimidazolium iodide; 0.5 M 4-tert-butyl pyridine; 0.1 M guanidinium thiocyanate in acetonitrile | [26] |
Copper (I) oxide (𝐂u𝟐O)
It is a very abundant, environmentally friendly, and low-cost material, so its derivatives share this characteristic [30]. Cu2O has a bandgap of ~2.1 eV which causes a large part of the solar spectrum to be absorbed (Fig. 24).
It has a maximum theoretical photocurrent density of -14.7 mA cm−2 at AM 1.5 conditions. The solar to hydrogen conversion efficiency is 18.1 %. It presents a favorable position of the conduction band with respect to the hydrogen reaction potential. It has a low stability against photodegradation. Under illumination, the electrons that are in the solid-liquid interface reduce the Cu2O semiconductor to Cu metal, decreasing the generated photocurrent [112,113]. In Fig. 25 we see two crystalline structures for cuprite (Cu2O). (a) Structure of cuprite, the copper atom is coordinated by two oxygen atoms and each oxygen atom surrounded by a tetrahedron of copper atoms. It has a body-centered cubic (BCC) arrangement where the special positions of the copper atoms are at (0.25, 0.25, 0.25); (0.75, 0.75, 0.25); (0.75, 0.25, 0.75); (0.25, 0.75, 0.75) and the special positions of the oxygen atoms are at (0, 0, 0); (0.5, 0.5, 0.5). (b) The special positions of copper are at (0, 0, 0); (0.5, 0.5, 0); (0.5, 0, 0.5); (0, 0.5, 0.5) and the special positions of oxygen are at (0.75, 0.75, 0.75); (0.25, 0.25, 0.25) [65].
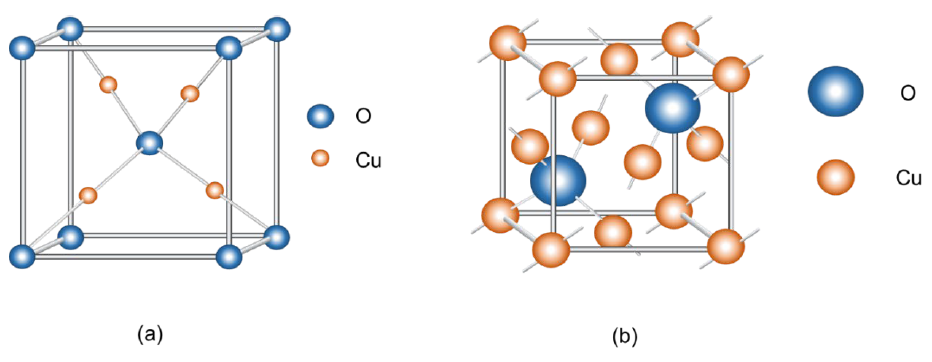
Fig. 25 Cu2O unit cell. The cubic structure has an array parameter of 0.42696 nm. It features two interpenetrating cubic arrangements. One is BCC and its arrangement is occupied by oxygen atoms (a) and another is FCC and its points are occupied by copper atoms (b) [65].
In the synthesis of inverse opals, Cu2O presents greater porosity, exhibiting a high double-layer capacitance that is 25 times greater than that of Cu [30]. To make the electrodeposition, a team of three electrodes is used, being FTO with a PS template on its surface as a working electrode, a Cu sheet as a counter electrode and a saturated calomel electrode (SCE) as a reference electrode. Cu2O is obtained by carrying out the electrochemical reduction of a solution of 3 M lactic acid and 0.4 M CuSO4. The electrochemical deposition is carried out at -0.7 V vs SCE for a period of 20 minutes. To adjust the pH to 12, a 10 % by weight NaOH solution is added. The temperature should be kept constant at 45 ℃. Subsequently, the electrode is submerged in tetrahydrofuran to remove the polystyrene template and/or it is calcined up to 500 ℃ in a N2 atmosphere with a speed ramp of 2 °𝐶𝐶 𝑚in−1. Its final morphology can be seen in Fig. 26 [21,64,114].
In electrochemistry Cu2O is a p-type semiconductor and is used as an electrocatalyst to reduce CO2 to CO and hydrocarbons (CH4, C2H4, CH3OH and HCOOH) and also to generate hydrogen. It is also used as a sensor for hydrogen peroxide and glucose. It is widely used in different methods for obtaining carbon-free electricity such as wind, solar, and hydroelectric power, among others [21,64,115]. Table 11 shows how the inverse opal has a large specific capacitance compared with other microstructures.
Table 11 Comparison of the specific capacitance (Cm) of different Cu2O electrodes with different crystal forms.
| Morphology | Method of preparation | 𝐂𝐦 (𝐅 𝐠−𝟏) | Scan rate | References |
|---|---|---|---|---|
| Microcubes | Hydrothermal | 660 | 1 A g−1 | [116] |
| Inverse opals | electrodeposition | 502 | 10 𝑚𝑉 −1 | [116] |
| Microsphere | Polyol reduction | 173.2 | 5 𝑚𝑉 −1 | [117] |
| Cubes | Polyol reduction | 157.5 | 5 𝑚𝑉 −1 | [ ] |
| Microsphere | Polyol reduction | 144 | 0.1 A g−1 | [116] |
| Flower-like | Polyol reduction | 92.3 | 5 𝑚𝑉 s−1 | [117] |
Hematite (𝛂−𝐅e𝟐𝐎𝟑𝟑)
The iron oxides present polymorphism, being the following phases: hematite (𝛼𝛼−Fe2O3), β phase iron oxide (β−Fe2O3), maguemite (γ−Fe2O3), epsilon phase iron oxide (ε−Fe2O3) and magnetite (Fe3O4) [118]. Hematite is an n-type semiconductor that can adhere to the surface of a transparent crystalline electrode such as the FTO or ITO allowing incident solar radiation to pass through. α−Fe2O3 has a bandgap of 2.1 eV making it possible to absorb both a portion of UV radiation and visible light [119,120], as can be seen in Fig. 27.
A theoretical solar to hydrogen conversion efficiency (STH) of 16.8 % (or photocurrent generation of 12.6 mA cm−2 at 1.23 V vs. AM 1.5G SHE under irradiation of 1 sun (100 mW cm−2) and an appropriate position of the band energy [18,122,123]. Experimentally, a water breaking efficiency of 13 % has been obtained, resulting in a hydrogen efficiency of 1-2 % [124]. Its photonic bandgap is ~428 nm. It presents different current densities depending on the morphology obtained by the type of synthesis used [35]. In Fig. 28 we see the basic hexagonal structure of hematite; it consists of 30 atoms where Fe3+ has a coordination of 6 and O2− works with a coordination of 4. The crystalline planes of α-hematite are: (104), (110), (214), (125) and (128) [118].
The cell parameters proposed by Smart TJ 2017 are: a = b = 5.13 Å and c = 13.99 Å with Fe−O bonds of 1.99 and 2.14 Å and O−Fe−O angles = 90.7°, 86.0° and 78.6° [124, 125], with an Eg = 2.2 eV [126] and μFe(μB) of 4.6 [127]. On the other hand, hematite has a low density of charge carriers, as well as low mobility of charge carriers (<10-2 cm2 V−1 −1) and a high rate of recombination of the pair e−/h+ [124,128], so it is not very efficient. Shi X., et al. 2013 has mentioned that the geometry of the microstructure with which the hematite is deposited on the FTO or ITO influences the efficiency of the photoelectrode. Among the different morphologies we have nanotubes, nanorods, nanocauliflowers, nanosheets, and inverse opal [119]. As can be seen in Table 12, the hematite deposited in the form of cauliflower presents the highest photocurrent density of 3.0 mA cm−2, while the one deposited in the form of nanoparticles presented the lowest photocurrent density of 0.3 mA cm−2 [1].
Table 12 Different hematite nanostructures and their performance in photo-electrochemical (PEC).
| Morphology | photocurrent | E/V | vs. | Reference |
|---|---|---|---|---|
| Cauliflowers | 3.0 mA cm−2 | 1.23 | RHE | [130] |
| Nanoflowers | 0.35 mA cm−2 | 0.23 | Ag/AgCl | [131] |
| Nanotubes | 1.42 mA cm−2 | 0.5 | Ag/AgCl | [132] |
| Mesopores | 0.56 mA cm−2 | 1.23 | RHE | [133] |
| Nanoparticles | 0.30 mA cm−2 | 1.23 | RHE | [134] |
| Nanospheres | 23.6 μA cm−2 | 1.1 | NHE | [135] |
| Nanopetals | 0.39 mA cm−2 | 1.23 | RHE | [136] |
| Nanoparticles (clustered) | 61 μA cm−2 | 0.23 | Ag/AgCl | [137] |
| Hexagonal | 1.6 mA cm−2 | 0.6 | Ag/AgCl | [138] |
| Nanorods | 700 μA cm−2 | 1.6 | RHE | [1] |
| Nanowires | 1.24 mA cm−2 | 1.23 | RHE | [139] |
| Inverse opal | 3.1 mA cm−2 | 0.5 | Ag/AgCl | [119] |
Hematite (α−Fe2O3) is used as magnetic material, catalysis, pigments, gas sensors, optical and electromagnetic equipment. It is stable under ambient conditions and with high resistance to corrosion, which is why it is used in the conversion of solar energy and in the production of hydrogen and oxygen from the breaking of bonds in the water molecule using a photoelectrochemical cell [119]. Its conversion efficiency from monochromatic incident photon to electron is 19.3 % under 10 times simulated solar illumination [35]. The introduction of defects such as oxygen vacancies (VO) increase the current density in hematite by donating two electrons to the system. Vacancies behave like n-type semiconductors. Polarons are created near the Fe ion by the presence of ionized electrons from the VO. As the concentration of VO increases, the conversion efficiency of the incident photon to current increases, as does the density of the carriers, their mobility and adsorption of visible light. There are two possible explanations for the above behavior: (a) oxygen vacancies increase the conductivity properties of bulk carriers as the internal geometry relaxes in the presence of oxygen or, (b) oxygen vacancies increase the gap between the gap and the electron at the electrode/electrolyte interface [124]. Among the limitations found for the use of hematite must be a short hole diffusion length, high recombination speed of the e−/h+ pair, poor charge mobility, poor OER and slow charge transfer kinetics [122]. The OER in hematite is using four electrons (equation 2) and for the HER two electrons are necessary (equation 3) [129].
An example of how to carry out the deposit of hematite in FTO is by means of electrodeposition (Section electrodeposit), for which the FTO is initially submerged in a mixture of acetone and ethanol and shaken with sonication for 20 minutes. Subsequently, the FTO is submerged in a mixture of sulfuric acid liquor and hydrogen peroxide (piranha solution) for 20 minutes to make the surface hydrophilic. Finally, the washed FTO is submerged in the polystyrene colloidal suspension and placed in an oven at 50 ℃ for two days (submersion method). To deposit hematite on the FTO/polystyrene substrate, a solution is first prepared containing 60 g iron sulfate (98 % FeSO4∙7H2O), 1.5 g ascorbic acid (99 % C6H8O6 ), 0.5 g of amidosulfonic acid (99 % H2NSO3H) and 15 g of boric acid (99 % H3BO3) in one liter of distilled water. All this in an electrolytic cell (Fig. 14(a)) composed of three electrodes with FTO/PS as working electrode, a Pt sheet as counter electrode and Ag/AgCl as reference electrode. A constant potential is applied vs. Ag/AgCl of -0.5 V to the working electrode, in order to control the thickness of the Fe deposit, the run is made for a determined period of time, the time finding that the most appropriate time for the desired thickness is 9 minutes. Finally, an annealing of the electrode obtained at 400 ℃ provides us with the hematite inverse opal with good photoelectric behavior to carry out different reactions [119,120]. Fig. 29 shows us the micrograph of hematite inverse opal obtained by in situ hydrolysis of ferric ions in low relative humidity [35].
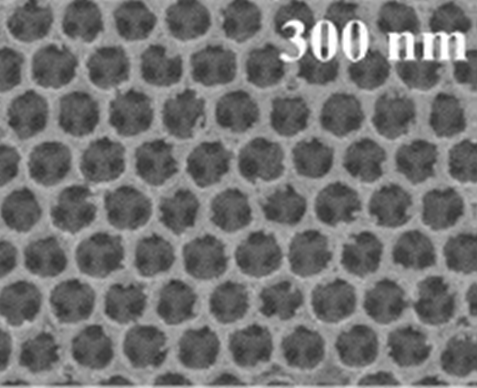
Fig. 29 Hematite inverse opal deposited via in situ hydrolysis of ferric ions at a low relative humidity of 30% [35].
Titanium dioxide (𝐓iO𝟐)
TiO2 is an n-type semiconductor with three crystalline structures: anatase (tetragonal), rutile (tetragonal) and brookite (orthorhombic), the first two being used as photoelectrodes. Fig. 30 shows us the crystalline structure of anatase (Fig. 30(a)) and rutile (Fig. 30(b)). The tetragonal crystal structure of anatase is formed by a chain of distorted TiO6 octahedrons, resulting in a unit cell containing four Ti atoms at positions (0,0,0), (
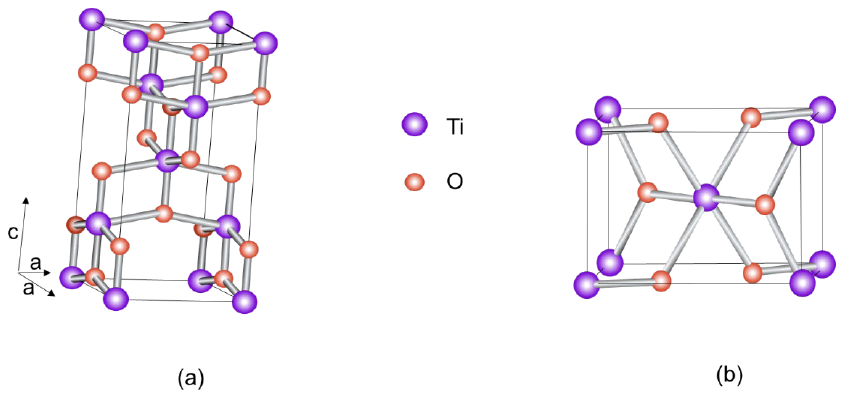
Fig. 30 (a) Anatase unit cell. The oxygen atoms form a distorted octahedron with a titanium atom in the center [140]. (b)Rutile unit cell. The oxygen atoms form an ordered hexagon with half the sites occupied by titanium atoms [141].
The band gap is influenced by the relationship of the valence band of Ti4+ with the “2p” orbitals of the oxygen that composes it. The band gap for rutile is 3.0 eV and for anatase 3.2 eV. This bandgap energy allows absorption in the UV region [143], as seen in Fig. 31 [144]. They also present slow transfer of charge carriers [2]. This compound is chemically stable in different chemical environments, resistant to photocorrosion, non-toxic, abundant with good biocompatibility and high photogeneration of oxidizing holes. These compounds are widely used in photoelectrochemical cells for the breakdown of water molecules and the obtaining of hydrogen and oxygen in the gaseous state as they present a favorable band edge position for redox reactions of water [67]. To increase the efficiency in this type of reactions, doping, metallic deposition, and formation of heterostructures have been attempted [142].
For its deposit in the FTO/PS by means of sol gel, 5 mL of titanium isopropoxide are mixed in 47 mL of ethanol with stirring at 1000 rpm. To the mixture is added a mixture of 2 mL of 37 % HCl and 2 mL of deionized water. Mix with stirring for 30 minutes until obtaining transparency and homogeneity. Then 5 drops of the synthesized precursor are added to the FTO/PS. This last operation is repeated 2 more times to increase the electrode filling efficiency. It is dried for 24 hours in the air and finally calcined in air with a ramp of 2 ℃ min-1 up to 500 ℃, keeping it at that temperature for 3 hours. The inverse opal can be seen in Fig. 32 [67,143]. Table 13 shows how the capacitance depends of different structures of 𝑇iO2 and preparation method.
Table 13 Comparison of the specific capacitance (Cm) of different TiO2 electrodes with different crystal forms.
| Morphology | Method of preparation | 𝐂m(𝐅 𝐠−𝟏 ) | Scan rate | References |
|---|---|---|---|---|
| Nanoporous | Solvothermal | 93.2 | 0.5 𝐴 𝑔−1 | [145] |
| Nanofiber | Electrospinning annealed | 65.84 | 1 𝑚𝑉 s−1 | [146] |
| Nanotubes | Anodic oxidation | 19.2 | 1 𝑚𝑉 s−1 | [147] |
| Nanoparticles | Microwave power | 12 | [148] | |
| Nanofiber | Electrospinning annealed | 11.33 | 2 𝑉 s−1 | [146] |
Nickel oxide (𝐍iO)
Nickel oxide (bunsenite) is dark green in colour [149]. It is a p-type semiconductor with a band gap between 3.6 and 3.8 eV and covers a small portion of the solar spectrum (Fig. 33).
Among its applications are alkaline batteries, electrochemical capacitors, electrochromic equipment [150,151], energy storage, optoelectronic equipment, ink-sensitive cathodic solar cells and breakdown of the water molecule. NiO falls into Mott-Hubbard type insulators caused by a Coulomb repulsion between 3d electrons and a charge transfer semiconductor. It has good mechanical stability, strong adhesion to transparent semiconductors, and excellent photoelectrochemical properties at thicknesses between 0.2 < 1 < 3.5 μm. Thin films of NiO (< 3.0 μm) and Ni(OH)2, which is the Ni2+ ion, present a transparent color in the visible spectrum [152] while NiOOH and Ni2O3 that have a Ni3+ ion, have a brown coloration [153]. NiO is used as a p-type TCO being used as display equipment, chemical sensor layer, in transparent electronic equipment and magnetic properties in nanoparticles [154]. In the presentation of transparent film it is used as an anode in industrial electrolytic plants for the decomposition of water. NiO has two crystalline structures; for β−NiO is the face-centered cubic with a cell parameter value of a = 4.1769 Å (Fig. 34(a)) [149,153], whose diffraction peaks in XRD are (1 1 1), (2 0 0), (2 2 0), (3 1 1) and (2 2 2). The α−NiO in the hexagonal phase (Fig. 34(b)) has the diffraction peaks at (0 0 1), (1 0 0), (1 0 1), (1 0 2), (1 1 0) (1 1 1), (1 0 3) and (2 0 1) and whose cell constants have a size of a = 3.126 Å , b = 3.125 Å and c = 4.605 Å and presenting an angle of 120° between their walls. [155].
The synthesis methods of this type of photoelectrodes have been dripping, chemical precipitation, hydrothermal, sol-gel, and electrochemical deposition. With electrochemical deposition it is possible to control the thickness, the composition of the layer and the crystalline morphology, controlling variables such as the composition of the solution, temperature, and the potential or current applied. NiO is prepared by cathodic electrodeposition using a polar aprotic solvent such as dimethyl sulfoxide (DMSO) using a low overpotential. In a three-electrode electrochemical system like the one shown in Fig. 14(a), with FTO/PS as the working electrode, a Pt foil as the counter electrode, and a saturated calomel reference electrode. A solution containing 0.2 M nickel nitrate hexahydrate [Ni[NO3]2∙6H2O] in DMSO is prepared and the mixture is poured into a vial to be bubbled with Ar. The container is stoppered and heated to 90℃ in a water bath. Before making the deposit, the solution is shaken for 2 minutes. During electrodeposition, the mixture is heated to 80 ℃ with magnetic stirring at 250 rpm and an overpotential of -0.85 V vs. standard calomel electrode for 250 seconds. Finally, the polystyrene template was removed by heat treatment at 200 ℃ for 10 min, finally obtaining the desired inverse opal (Fig. 35) [151].
Titanium dioxide (𝐓iO𝟐)
The typical water breakdown process by the photoelectrocatalytic method in TiO2 consists of the hydrogen evolution reaction and the oxygen evolution reaction, as shown in Fig. 36. It can be seen that when irradiating TiO2, thermodynamically the energy level of the conduction band is more negative than the energy level for the production of hydrogen by reducing protons from the water molecule and producing H2 (H+/H2O, 0V vs NHE). The valence band energy level is more positive than the oxidation level of water causing the holes created to oxidize water to form O2 (H2O/O2, 1.23V vs NHE). Applying an overpotential to the counter electrode favors this reaction and thus decreases the recombination of the e−/h+ pair [2]. The reactions that occur are:
Where h is Planck constant and ν frequency.
Fig. 36 represents the photocatalytic method (a) or the photoelectrochemical method (b) to produce H2. In Fig. 36(b) we can see that the photoelectrochemical method has a photoelectrode that is connected to a source to have an overpotential. Similarly, when TiO2 is irradiated with light, valence band electrons are excited to move to the conduction band, leaving holes in the valence band. The electrons move in an external electrical circuit until they reach the counter-electrode, where the protons are reduced to H2. At the same time, the holes oxidize water molecules to generate oxygen (or can be used to generate 𝑂𝑂𝑂𝑂∙ radicals, useful in degrading contaminants in solution) [2]. In Fig. 37 we observe the kinetic behaviour when using a TiO2 working photoelectrode, a Pt counter electrode and an Ag/AgCl (3M KCl) reference electrode. The flat band potential Vfb = -0.16 V at pH = 0 vs NHE. Obtained from: Vfb= (-0.17 ± 0.02) - 0.054 (pH) V vs NHE, measured in three different HCl solutions (0.1 M; pH 1.1); NaCl (0.1 M; pH 6.9) and NaOH (0.1 M; pH 12.3). The applied overpotential is 0.5 V vs Ag/AgCl. The value of Vfb is fused with the edge of the minimum conduction band allowing the reduction of water [153]. The conduction band potential of anatase is EC = -0.1 V and the valence band potential is EV = 3.1 V at pH = 0 vs NHE [156].
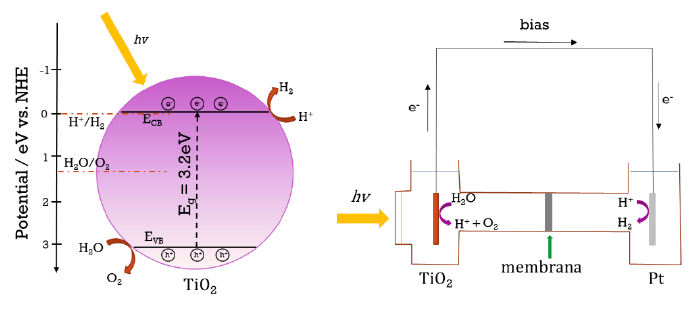
Fig. 36 (a) Electrons in the conduction band that reduce protons to hydrogen and holes in the valence band oxidize water to produce oxygen or widely used in different methods for obtaining widely used in differentmethods forobtaining 𝑂𝑂𝑂𝑂∙ radicals (not shown) to degrade pollutants EC = -0.1 V and EV = 3.1 V at pH = 0 vs. NHE. (b) Holesin the TiO2 surface react with water to generate oxygen and hydrogen ions. Electrons in the counter electrode react with hydrogen ions to generate hydrogen [2,156].
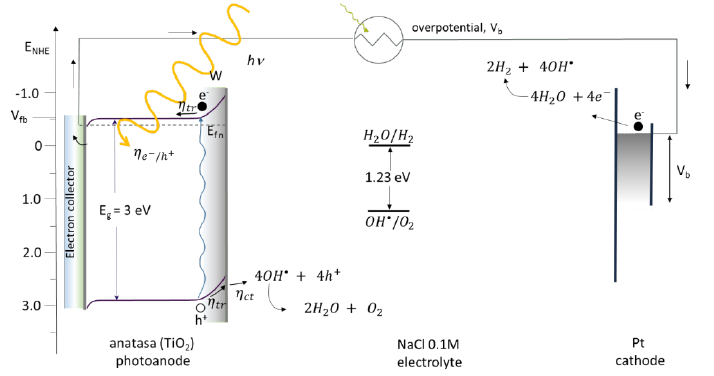
Fig. 37 Energy diagram showing a typical value of the flag band potential, Vfb, of n-type hematite, in the photoelectrochemical cell the water-breaking operation is aided by solar illumination and an applied external overpotential to the system, Vb. W is the thickness of the charge or depletion space, Eg is the bandgap energy, ηe−/h+ light absorption, ηtr charge transport, ηct chemical reactions at the surface, Efn Fermi energy of n-type photoelectrode [157-159].
Nickel oxide (𝐍iO)
Nickel oxide is used in alkaline conditions due to its low cost, high catalytic activity and corrosion stability [3]. The breakdown of the water molecule proceeds via coordination with Ni (II) centers on the surface. This causes the NiO to dissolve causing changes in the oxidation state of Ni to values >2. Anodic polarization of NiO in neutral aqueous solution creates polymorphic oxohydroxide species (NiOOH) with Ni ions on the deposit surface (Fig. 38). The different polymorphic structures are probably due to the irregular geometry of the coordinated Ni centers on the surface. These forms are: β−NiOOH which has a valence band of +3 or slightly lower for the Ni ion, due to the presence of small amounts of Ni(OH)2. In γ−NiOOH, nickel has a valence between 3.5-3.7 and its stoichiometry is 0.835 NiO2- 0.165 Ni(OH)2 where the presence of Ni4+ and Ni2+ is seen. For the catalytic formation of O2 there is the intermediate NiOO2 that contains Ni2+. Oxidation reactions occur over a range of potentials. At lower potential the oxidation reaction from Ni (II) to Ni (III) is:
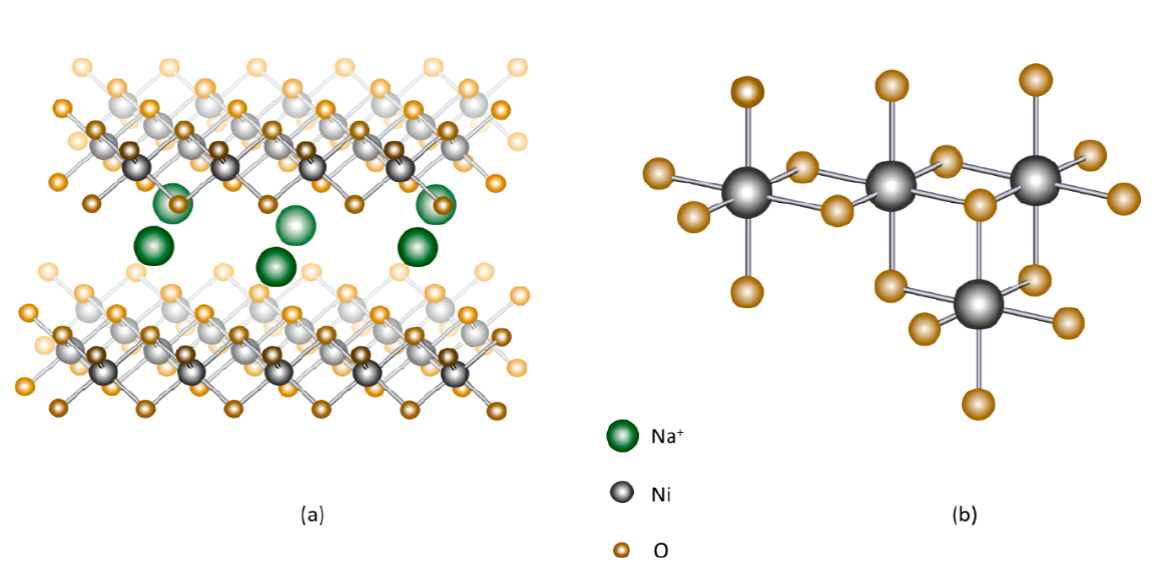
Fig. 38 (a) X-rays of the crystal structure of γ−NiOOH showing nickel in gray, oxygen in orange, and sodium ions in green. The sodium ion is the alkaline cation added to the solution and combines with the water molecules at the NiO6 boundary with the γ−NiOOH. The water molecules are sandwiched between the NiO2 slabs. (b) Fragment of the NiO6 octahedron structure [3].
At higher potentials oxidation of Ni (II) to Ni (III) can occur
or the oxidation of Ni (III) to Ni (IV)
The equations (6) and (7) show that the oxidative process of NiO is compensated by the removal of a proton from the hydroxyl group coordinated with the Ni centers on the surface. In addition to this, the coordination surface between the hydroxyl group and the Ni centers is more regular, allowing obtaining valences greater than 2 [152]. Fig. 39 shows that NiO is a p-type semiconductor with a band gap between 3.15 and 3.8 eV [160] and a Fermi energy of -0.955 eV [161]. The conduction band has a value of -0.5 V and the valence band of 2.93 V [97]. For the hydrogen evolution reaction, it is observed how a two-step process is involved on the surface of the NiO electrode, first the Volmer reaction:
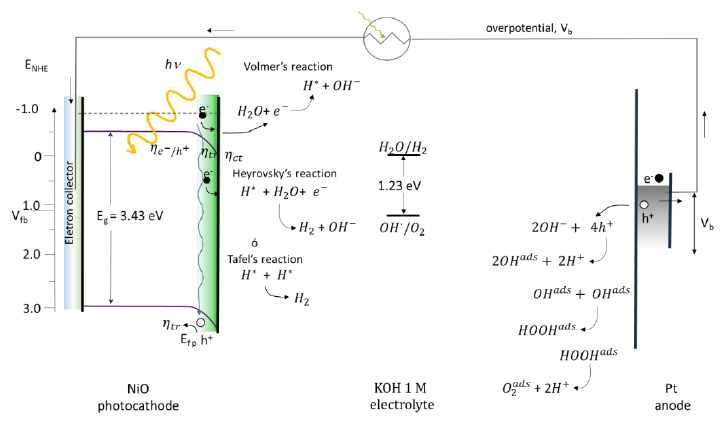
Fig. 39 Photoelectrochemical cell with NiO working electrode, Pt auxiliary electrode and Ag/AgCl reference electrode, and 0.1 M NaOH supporting electrolyte [161].
associated with hydrogen adsorbed in the photoelectrocatalysis on the electrode. The second step is the Heyrovsky reaction:
or the Tafel reaction [101, 162]:
In the same way on the Pt electrode the oxygen evolution reaction occurs from either the dissociation of the water molecule to form the hydroxide ion, or from the hydroxide that is in the middle, being the hydroxide ion adsorbed on the electrode surface. By combining the electrons of the adsorbed hydroxide and the photogenerated holes, the electrical circuit is closed. The adsorbed hydroxide combines with other adsorbed hydroxide molecules, forming peroxide on the surface, which finally combines with itself to form adsorbed oxygen [163].
Hematite (𝛂−𝐅𝟐𝐎𝟑)
Hematite has a small bandgap (2.1 eV), which means that it can absorb light with wavelengths above 400 nm [1], but at the same time makes it necessary to add an external potential to complete the rupture reaction of the water molecule. Fig. 40 shows a flat band potential at very low energy (Vfb = 0.4 V vs RHE [164]) for water reduction. Following the described reactions, the h+ produced reacts with the 𝑂𝑂𝑂𝑂∙ radical oxidizing oxygen and later form O2. With the help of the applied overpotential the water molecule provides the H+ and reduces it to H2 at the cathode by the electron formed in the hematite photoanode. This reaction is carried out in a three-electrode system having a hematite photoelectrode, a Pt vs. RHE and in 1 M NaOH solution [132,164]. The efficiency that it presents for the breakdown of the water molecule is 13 % [1].
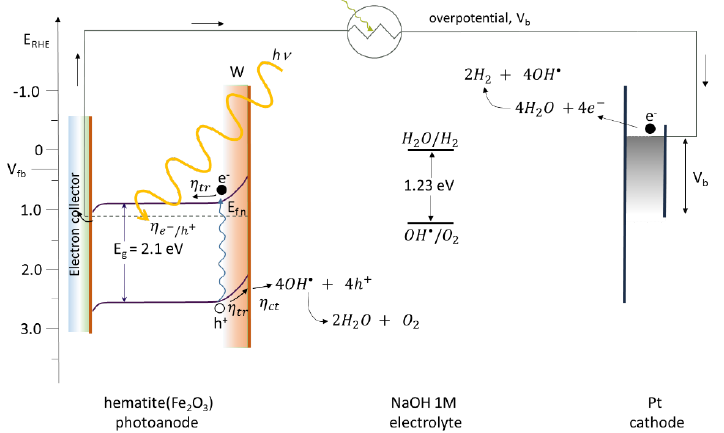
Fig. 40 Energy diagram showing a typical value of the flag band potential, Vfb, of n-type hematite, in the photoelectrochemical cell the water-breaking operation is aided by solar illumination and an applied external overpotential to the system, Vb. W is the thickness of the charge or depletion space, Eg is the bandgap energy, 𝜂𝜂𝑒𝑒−/ℎ+ light absorption, ηtr charge transport, ηct chemical reactions at the surface, Efn Fermi energy of type photoelectrode n [164-166].
Zinc oxide (𝐙nO)
ZnO is an n-type semiconductor. Fig. 41 shows that it has a forbidden band of 3.215 eV, valence band is 3.090 eV, conduction band -0.254 eV, flat band potential -0.254 eV (vs NHE) [167]. When this electrode is irradiated, the electrons first form in the conduction band, then they move to the valence band and from there they move to the conductive side of the substrate. From there, its movement is along the external circuit of the system, reaching the counter electrode, enriching it with electrons. Finally, the electrons cause electrochemical reactions that decrease the speed of recombination and reduce the water molecule with the help of an external potential (As can be seen in the following equation) producing hydrogen [71]. The electrons are trapped by the vacancies caused by the desorption of oxygen, increasing both the charge density and the oxidation reaction of water [74]. On the other hand, the holes that are generated in the valence band and that are found in the photoelectrode are captured inside the electrolyte by the electrons of the water, causing its oxidation (equation 1)[4]. In alkaline pH, the OH′s are adsorbed on the electrode surface to receive the photogenerated holes [17].The general reaction to obtain H2 from this type of electrodes is:
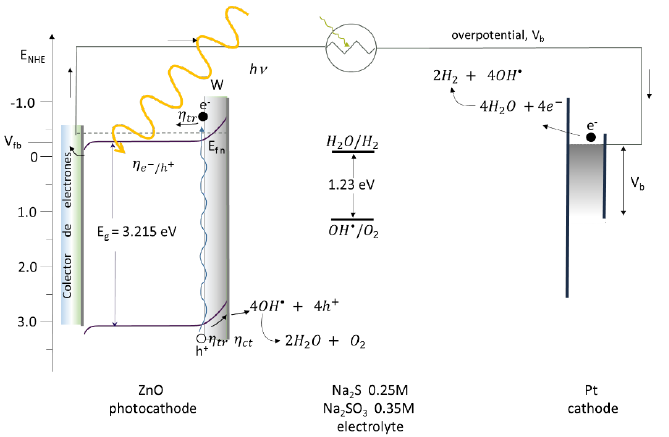
Fig. 41 Breaking of the water molecule using ZnO as working electrode, Pt counter electrode, Na2SO3 (0.35 M)and Na2S (0.25 M) solution [167].
Nickel sulfide (𝐍iS)
Nickel sulfides hold promise for electrolysis in the HER and for their long operational stability in acidic and alkaline solutions. Fig. 42 represents a photoelectrochemical cell with a NiS photoelectrode and a platinum auxiliary electrode working in acid medium. Thus using an pH 0 solution (0.5 M H2SO4) the reaction is carried out with an overpotential of 0.215 V, sweep speed of 2 mV −1 and a delivered current density of 10 mA cm−2 (vs. RHE) with and flat band potential (Vfb) of 1.14 eV (vs NHE). Through the Volmer reaction and later the Heyrovsky or Tafel reaction, the S anion acts as an active site for the adsorption of H+ and promotes the reduction to H2. The sulfur atom is the most anionic atom in the NiS crystal lattice. The Ni cation contributes to increase the kinetics of H2 evolution.
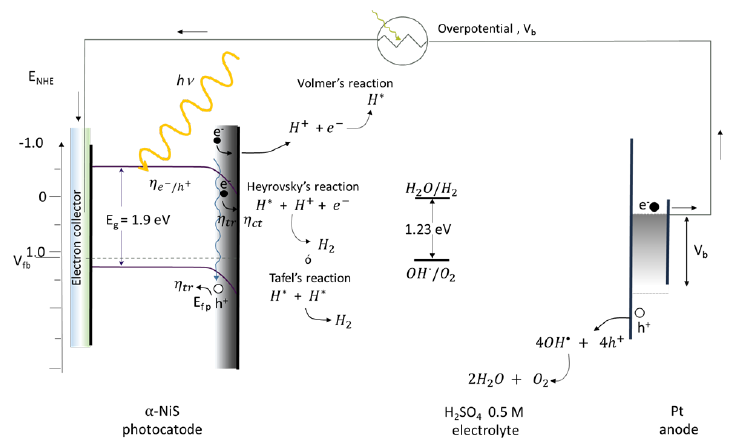
Fig. 42 Water cleavage reactions using an ITO/ NiS photoelectrode in an acid medium. The flat band potential of NiS is Efb = 1.14 V, conduction band potential ECB = -0.66 V, valence band potential EVB = 1.24 (vs NHE), and bandgap energy Eg = 1.9 eV. 300 W Xe lamp illumination [101,162,168].
In an alkaline medium (1 M KOH, pH 14) at an overpotential of 0.256 V at a sweep rate of 2 mV −1and a current density of 10 mA∙cm−2, the Ni cation adsorbs water and promotes its dissociation, the H∗ formed moves to the adjacent anionic atom S and reduces H+ to produce H2. Initially the Volmer reaction occurs and subsequently the Heyrovsky or Tafel reaction (reactions shown in section 5.2). Finally, the H∗ formed from the dissociation of water moves to the adjacent anionic S atom which reduces to H2 [101,162]. The proposed reactions can be seen in Fig. 43. Thus, we have that α−NiS generates 13.413 mmol h−1 g−1 of H2 with a conversion efficiency of 5.2 %, while β−NiS generates 12.731 mmol∙h−1 g−1 of H2 and its conversion efficiency is 4.8 %. Both compounds can be used as sacrificial agents Na2S and Na2SO3 [98].
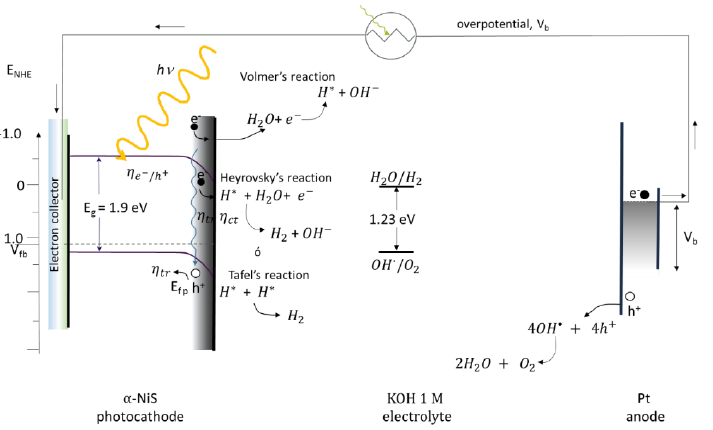
Fig. 43 Water cleavage reactions using an ITO/NiS photoelectrode in alkaline medium. Experiment carried out under the same conditions as in Fig. 42 [101,162,168].
For the oxygen evolution reaction (0.1 M KOH, pH 14), overpotential of 0.384 V, and current density 10 mA cm−2 (vs RHE) have been used, the reactions in an alkaline medium proposed are:
Subsequently you have to:
Followed by:
Either
*OOH produces NiOOH on the electrode surface.
In this sequence of reactions, the flat band potential for NiS is Efb = 0.4 eV [162]. In Fig. 44 it can be seen how the energy potential of the conduction band (ECB) is above the evolution potential of hydrogen for the rupture of the water molecule. Protons are reduced to H2 by conduction band electrons [98]. But it can be clearly seen that additional energy is required to efficiently reach the OER, so photoelectrochemistry is very useful with this material.
Copper (I) oxide (𝐂u𝟐𝐎)
In the process of breaking the water molecule, the photoelectrode with Cu2O deposit, a p-type electrode, has more negative conduction band potential than the reduction potential of hydrogen [169] and the valence band has a lower potential than the evolution potential of oxygen. The photoelectrons will contribute to the formation of hydrogen and the holes will be transferred to the counter electrode to produce oxygen [170]. When Cu2O is highly active, it presents a photocurrent of up to -7.6 mA cm−2 producing 75 ± 10 μL of H2 at a total charge of 0.58 C at 0 V vs RHE [169]. In Fig. 45 we see the energy diagram for the rupture of the water molecule. The flat valence and conduction energy band of Cu2O are Efv = 0.64 V and Efc = -1.83 V [156], its flat band potential is Vfb = 0.55 V vs RHE [171]. With Pt as the counter electrode, water requires 1.4 to 1.8 V of overpotential for its molecular breakdown. The difference between these values will be reduced depending on the type of photoelectrode and the amount of solar energy reaching the surface [172]. The photogenerated electrons in the Cu2O will react producing hydrogen from the water, and the holes will move to the counter electrode to carry out the oxygen evolution reaction [170].
Conclusions
Considering the importance of the structure of the binary oxides semiconductors deposited in transparent conductive electrodes used in photoelectrochemistry is essential for the optimization of the process. By increasing the contact surface, the capture of photons increases and with it the efficiency in the conversion of water to hydrogen by this method. Therefore, inverse opal deposits present a very promising alternative to achieve this objective in a controlled and reproducible manner. In this article, the different methods to achieve this mesoporous structure have been reviewed and the semiconductors used in electrodes of photoelectrochemical cells, particularly focused on the water-splitting reaction, have been included. It is essential to continue studying the characteristics of photoactive surfaces and to continue the development of semiconductor deposition methods to obtain controlled, uniform, ordered and highly efficient interfaces. These investigations will help accelerate the transition from fossil fuels to other energy sources for human activities, allowing coexistence with the environment and reducing CO2 emissions, thus contributing to minimizing the climate change that we have been experiencing in recent decades.


 nueva página del texto (beta)


