Introduction
Despite its status as a megadiverse country (Myers et al., 2000; Sarukhan, 2008), there is a paucity of studies for many taxa in large areas of Mexico. One such region is the northwestern state of Baja California, which hosts ecologically interesting habitats such as the Sonoran Desert and the California Floristic Province, the latter of which spans a large area of California in the USA, and a smaller area of Baja California (Burge et al., 2016; González-Abraham et al., 2010). For Mexico, this is a unique area, being the only part of the country with a Mediterranean climate and several endemic species of flora and fauna (Riddle et al., 2000; Riemann & Exequiel, 2007). In fact, Morrone and Márquez (2008) marked “California Norte” in the state of Baja California as one of 15 panbiogeographical nodes in Mexico, representing areas of high diversity that should receive priority for conservation. While the flora of the region has been well documented (Riemann & Exequiel, 2007; Wiggins, 1980), only a tiny fraction of terrestrial arthropods containing ecologically crucial taxa have been thoroughly studied (Clark & Sankey, 1999; Due & Polis, 1986). For spiders, to date, there are about 414 described species for the whole Baja California peninsula (Jiménez et al., 2018), a number certainly due to increase with further studies (Hernández-Salgado et al., 2022). Furthermore, a track- analysis found that the Baja California peninsula hosts 3 of 9 generalized tracks for Mexico based on agelenid spiders (Maya-Morales et al., 2018).
The spider family Salticidae (also known as jumping spiders) has more than 6,000 described species worldwide (World Spider Catalog, 2022). In addition to being species- rich and diverse, salticids have been model organisms for studies on phylogenetics and evolution (Bodner & Maddison, 2012; Hill & Richman, 2009; Maddison et al., 2017; Penney, 2010), ecology (Maldonado-Carrizales & Ponce-Saavedra, 2017; Rubio et al., 2019) and behavior (Ceccarelli, 2008; Jackson & Pollard, 1996; Lim & Li, 2006), given their varied and at times highly specialized life strategies. A North American genus of jumping spiders, Phidippus has attracted particular attention due to the relatively large size of the species, conspicuous colors, and diversity, counting to date 61 described and valid species for North America, of which 42 are found in Mexico (Edwards, 2004, 2020; Hernández-Salgado et al., 2022).
Based on recent studies of the genus Phidippus diversity in Baja California, at least 11 species are found in the peninsula, of which 4 are new records and at least one undescribed species (Hernández-Salgado et al., 2022; Guerrero-Fuentes, pers. comm.). Most of the peninsula’s diversity regarding Phidippus is concentrated in the northern state of Baja California. Considering the whole geographic range of Phidippus, from Alaska to Costa Rica, it is remarkable that an approximate 17% of species can be found in an area the size of Baja California. In addition to species richness, an important dimension of diversity is genetic diversity since it gives an idea of the uniqueness and viability of a species throughout its distributional range (Vellend & Geber, 2005). In population genetics, genetic diversity is assessed through metrics such as haplotype diversity and population structure, while studying demographic processes provides an overview of past events such as historical gene flow and population size changes (Hamilton, 2021).
Hernández-Salgado et al. (2022) found that 2 of the most abundant Phidippus species from northwestern Mexico were Phidippus johnsoni (G. W. Peckham & E. G. Peckham, 1883) and Phidippus phoenixEdwards, 2004 (Fig. 1). The first species, P. johnsoni, has been a model organism for a range of studies, such as its life history (Jackson, 1978), nest structure (Jackson, 1979), the structural origin of their cheliceral iridescence (Ingram et al., 2011), and a range of behavioral studies on predatory and reproductive behavior and strategies (Jackson, 1977a, b, c, 1980, 1981, 1986). Phidippus johnsoni is also described as being the species of its genus found in the most varieties of habitats, including beaches, alpine meadows, coniferous forest, chaparral, and coastal sage (Edwards, 2004). Less is known about the biology and evolution of P. phoenix, described as a “typical desert species”, found only in this habitat (Edwards, 2004). These 2 species are of a similar size, but, given their habitat preferences, they differ in the extent of their distributions (Edwards, 2004). While P. johnsoni is more widely distributed, ranging from western Canada throughout western U.S.A., with its southernmost distributional limit being in the Mediterranean region of northwestern Mexico, P. phoenix ranges from southwestern U.S.A. to the middle of the Baja California peninsula, which means that the Mediterranean region of Mexico is central to its distribution (Fig. 2).
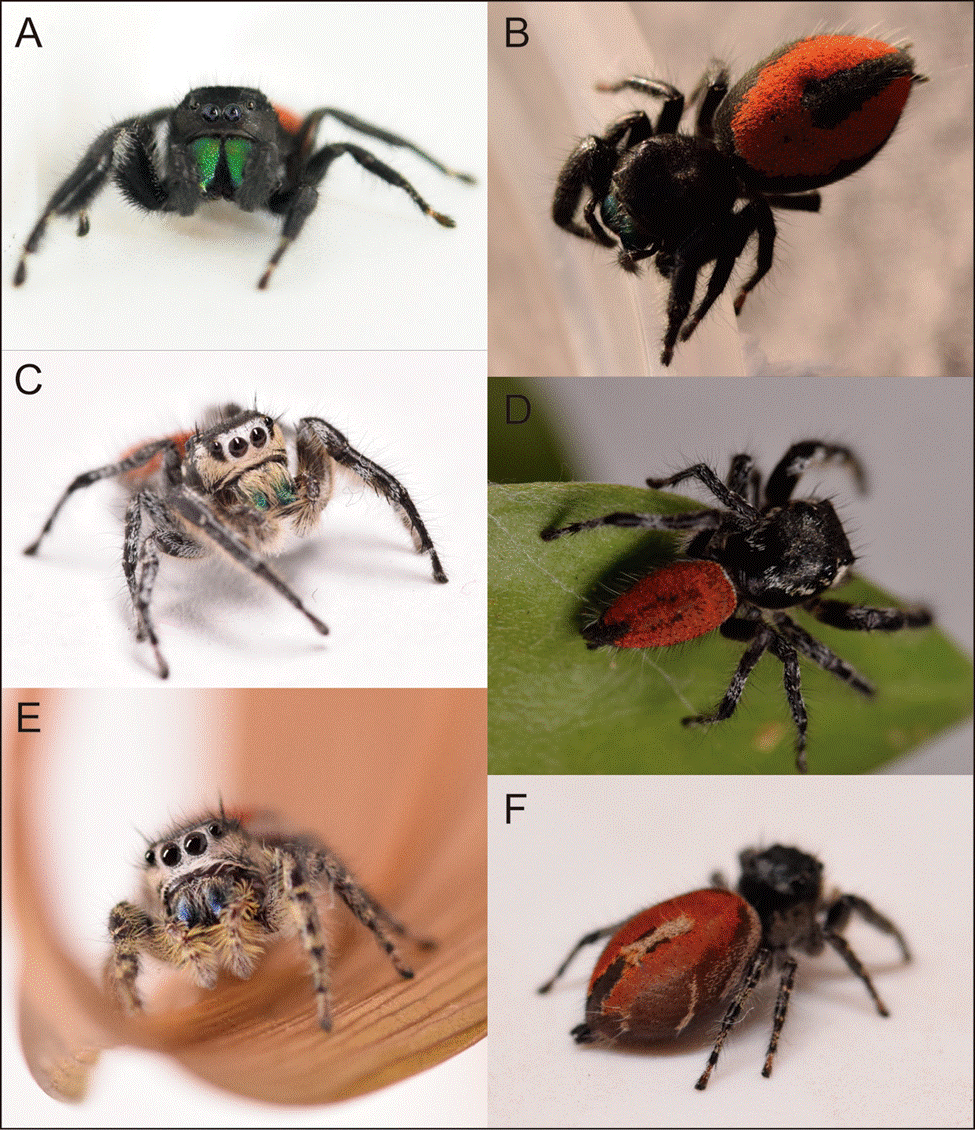
Figure 1 Photographs of live specimens of Phidippus johnsoni from Baja California (A: front view, male; and B: top view, female) and Phidippus phoenix (C: front view, male; D: top view, male; E: front view, female; and F: top view, female). Photos taken by Luz A. Garduño.
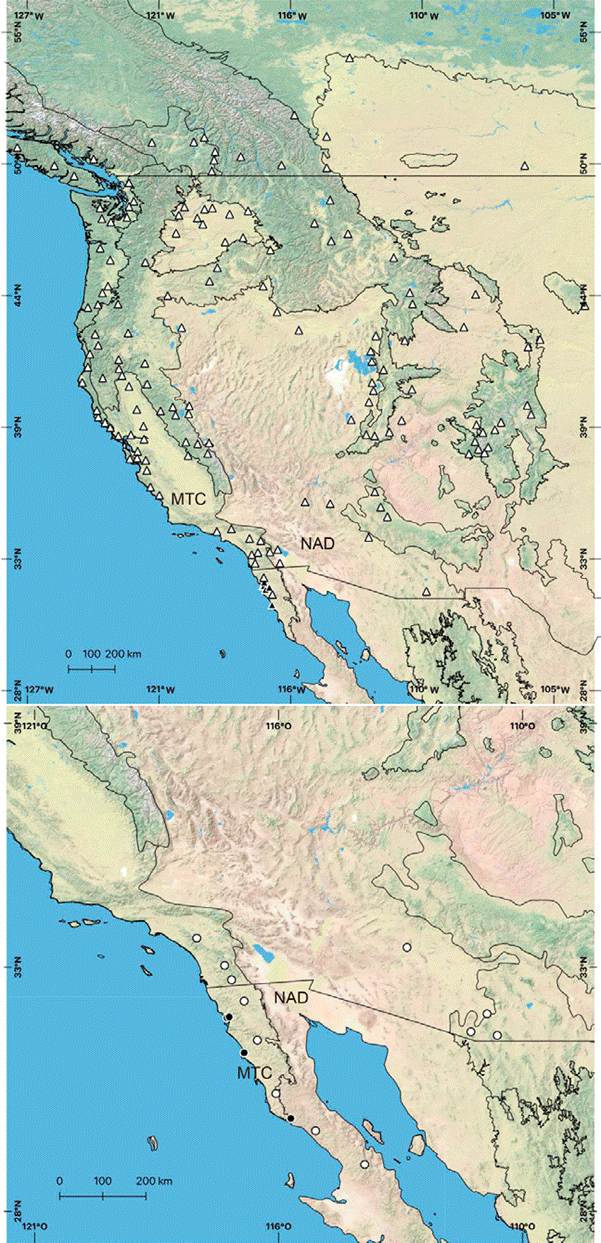
Figure 2 Maps of the distributional records for Phidippus johnsoni (triangles) and P. phoenix (circles), based on the work by Edwards (2004) -white triangles/circles- and specimens used in this study (black triangles/circles). The polygons on the maps delimit the Level I ecoregions from Wiken et al. (2011) found in Baja California (NAD = North American Deserts, MTC = Mediterranean California), and black lines represent country borders (Canada-USA-Mexico).
Considering the biological and ecological differences between P. johnsoni and P. phoenix, in this study, the population structure and demographic histories of the 2 species’ populations from northwestern Mexico are compared using mitochondrial and nuclear sequence data. Thus, in addition to knowing the species richness and diversity of Phidippus in the region, a further dimension is added, namely the genetic diversity of 2 of the species of Phidippus in time and space.
Materials and methods
Phidippus johnsoni and P. phoenix individuals were collected during the day by hand between 2018 and 2020 in a variety of habitats, such as chaparral, desert, agro-ecosystems, and urban environments in the Mexican state of Baja California (Fig. 2; Supplementary material, Table S1). The individuals were stored in vials with ethanol 96% at -20 °C until they were used for DNA extraction. All individuals used in this study had been identified in a previous study by morphological examination of the male and female genitalia and genetic analysis based on a fragment of the mitochondrial Cytochrome Oxidase CI (COI) gene and deposited in the arachnid collection of the Museo de Artrópodos de Baja California (for further information, please see Hernández-Salgado et al., 2022).
Whole genomic DNA was extracted from the legs and prosoma using Qiagen’s DNeasy Blood & Tissue Kit, following the manufacturers protocol. Subsequently, Polymerase Chain Reactions were carried out in a mix containing 5 ul 5x GoTaq Flexi Buffer, 1 mM MgCl2, 1.25 units of GoTaq DNA Polymerase (Promega), 0.2 mM of each dNTP, 0.5 uM of each primer, 3ul DNA and nuclease-free water to a final volume of 25 ul. The primers used to amplify a 268 base-pair fragment of the nuclear gene fragment Histone 3a (H3a) were H3a_F (3’-ATG GCT CGT ACC AAG CAG ACV GC-5’) and H3a_R (3’- ATA TCC TTR GGC ATR ATR GTG AC-5’) (Colgan et al., 1998). The thermal cycling protocol consisted of an initial denaturing step of 95 °C for 5 minutes, followed by 35 cycles of 95 °C for 30 seconds, 51 °C for 45 seconds, and 72 °C for 1 min, with a final extension step of 72 °C for 10 minutes. PCR products were checked in a 1.5% agarose gel by electrophoresis and sent for purification and bi-directional sanger sequencing to Macrogen Inc., Korea. Additionally, for the same individuals of P. johnsoni and P. phoenix, nucleotide sequences of a 658 base-pair fragment of the initial portion of the COI mitochondrial gene were obtained from a previous study (Hernández-Salgado et al., 2022).
The nuclear H3a sequences were edited in Sequencher v. 4.1.4., examining the chromatograms carefully by eye to detect double-peaks and assigning base calls based on the IUPAC ambiguity code. Alignments were created for each species and for each gene fragment separately (658 base-pairs for COI and 268 base-pairs for H3a), using the MAFFT online server with default settings (Katoh et al., 2019).
The H3a alignments with ambiguous base calls were loaded into DnaSP v. 6.12.03 (Rozas et al., 2017), and the PHASE algorithm was applied with 10,000 iterations and assuming recombination to obtain the most likely sequences (haplotypes) for all the alleles present in the samples for each species, P. johnsoni, and P. phoenix (Stephens & Donnelly, 2003). Haplotype networks were then obtained in the program PopART (Leigh & Bryant, 2015) under the TCS algorithm for each species and marker (COI and H3a) separately (Clement et al., 2002), to visualize the geographical distribution of the haplotypes and evaluate whether there was overall genetic structuring between the sampled localities. Since none of the third codon positions in the matrices were highly variable, they were included in the analyses. Furthermore, being aware that possible recombination events in nuclear markers will skew analyses such as haplotype networks, in this study the H3a marker was still included, to evaluate the difference between mitochondrial and nuclear data sources.
Population structure and demographic histories
The number of P. johnsoni and P. phoenix populations was estimated using the COI and H3a haplotype matrices. The nuclear and mitochondrial markers were analyzed separately and combined through Structure (Pritchard et al., 2000), each with 3 runs of 50,000 generations of Markov Chain Monte Carlo (mcmc) simulations with a burn-in of 5,000. The admixture and the correlated population allele frequencies models were utilized. The input format for combined analysis was phased diploid data, while the second allele for haploid data was marked as missing data. For the approximation K (number of populations), the method by Evanno et al. (2005) was used to calculate ∆K through Structure Harvester (Earl & vonHoldt, 2012).
To get an overview of the diversity present both for P. johnsoni and P. phoenix, the COI and H3a haplotype files for the inferred populations of each species were analyzed in DnaSP, calculating the haplotype diversity (H), nucleotide diversity (π; Nei, 1987), and the Watterson parameter (θ; Watterson, 1975). Additionally, the Fst value (Hudson et al., 1992) for P. phoenix’s populations was calculated to evaluate gene flow between them and their structuring.
For each population, Extended Bayesian Skyline Plots (EBSPs; Heled & Drummond, 2008) were produced in BEAST 2.6 (Bouckaert et al., 2014). EBSP provide historical information on population size changes and estimate the current population sizes. For the analyses, linear EBSP coalescent tree priors and uncorrelated relaxed lognormal clock priors were selected, setting a clock rate of 0.0225 substitutions/site/million years for the COI fragment and HKY substitution models for both COI and H3a fragments. The mcmc simulations were run for 50 million generations, sampling every 5,000th generation. The runs were then checked in Tracer v. 1.7.1 (Rambaut et al., 2018), and EBSP plots were drawn using the plotEBSP.R script (available online at: https://www.beast2.org/tutorials/) in R version 4.2.0 (R core team, 2022).
Most algorithms used for inferring demographic histories of individuals and populations do not consider recombination in nuclear sequences. To check for recombination in the nuclear fragment used here, the recombination parameter R was calculated in DnaSP for each H3a haplotype matrix to estimate the minimum number of recombination events (Hudson, 1987). Additionally, to infer demographic histories that take nuclear recombination into account, Ancestral Recombination Graphs (ARGs) were built using the Kwarg package (Ignatieva et al., 2021), which implements a parsimony-based approach to estimate the number of recombination events that explain the history of a given data set. Kwarg was run on the P. johnsoni and P. phoenix H3a haplotype matrices, using the default parameters. Since KWARG does not estimate the number of generations between the trees’ nodes, ARGweaver (Hubisz et al., 2020) was used, which implements an mcmc algorithm. The mcmc simulations for each species were run for 2,000 iterations, sampling every 10th generation. The priors for population size and mutation rate were based on the outcomes of the EBSP analyses, set as 500,000 and 6.20e-08 substitutions/site for P. johnsoni and 500,000 and 1.04e-02 substitutions/site for P. phoenix, respectively.
Results
Based on the results from the mcmc runs in structure combining the mitochondrial and nuclear markers, P. johnsoni and P. phoenix comprise 2 populations each (Table 1; Supplementary material: Figs. S1, S2). The haplotype networks of P. johnsoni (Fig. 3) lack structure and generally show between 1 and 3 mutations from one haplotype to the other. For P. phoenix, more mutations are found between the general Ensenada/El Sauzal population than the rest, but only visible in the mitochondrial haplotype network (Fig. 4). Comparing the outcomes of the structure runs to the haplotype networks and the geographical congruence (Figs. 5, 6), the 2 hypothetical populations of P. johnsoni will be considered as one (note: structure does not allow for one single population as an output), and P. phoenix as 2 populations: a “northern” population which includes the localities in and around Ensenada and a “southern” population with individuals from Punta Colonet and Santa Catarina.
Table 1 Mean LnP(K), (SD), ∆K calculated through Structure and output by Structure Harvester using K = 1-6. The results shown are from markers analyzed independently and combined. The numbers in bold typeface show the value of K with the highest likelihood.
| K | 1 | 2 | 3 | 4 | 5 | 6 | ||
|---|---|---|---|---|---|---|---|---|
| Phidippus phoenix | H3 | LnP(K) | -488.23 | -361.3 | -293.6 | -298.5 | -288 | -293.23 |
| Stdev LnP(K) | 0.35 | 0.17 | 11.62 | 24.25 | 1.73 | 3.6 | ||
| DeltaK | - | 341.98 | 6.24 | 0.63 | 9.06 | - | ||
| LnP(K) | -174.63 | -87.46 | -97.3 | -107.3 | -108.86 | -115.8 | ||
| COI | Stdev LnP(K) | 0.057 | 0.47 | 1.249 | 3.13 | 2.96 | 6.27 | |
| DeltaK | - | 205.25 | 0.13 | 2.69 | 1.8 | - | ||
| LnP(K) | -663.16 | -530.33 | -468.53 | -449.5 | -480.26 | -520.23 | ||
| Both | Stdev LnP(K) | 0.7 | 1.6 | 2.3 | 9.18 | 22.05 | 21.99 | |
| DeltaK | - | 44.28 | 18.57 | 5.42 | 0.41 | - | ||
| LnP(K) | -1614.16 | -1665.03 | -1627.9 | -1806.1 | -1667.8 | -1657.66 | ||
| Phidippus johnsoni | H3 | Stdev LnP(K) | 0.3 | 49.75 | 22.68 | 209.97 | 91.1 | 52.96 |
| DeltaK | - | 1.76 | 9.49 | 1.5 | 1.4 | - | ||
| LnP(K) | -1995.13 | -1208.966 | -1107.26 | -1036.73 | -1029.1 | -1112.3 | ||
| COI | Stdev LnP(K) | 0.15 | 17.12 | 6.67 | 53.48 | 176.42 | 356.89 | |
| DeltaK | 39.96 | 4.67 | 1.17 | 0.51 | - | |||
| LnP(K) | -1995.23 | -1897.9 | -2040.43 | -2027.53 | -2094.5 | -3191.16 | ||
| Both | Stdev LnP(K) | 0.92 | 0.9 | 42.88 | 115.43 | 212.83 | 1922.64 | |
| DeltaK | - | 266.51 | 3.62 | 0.69 | 4.83 | - |
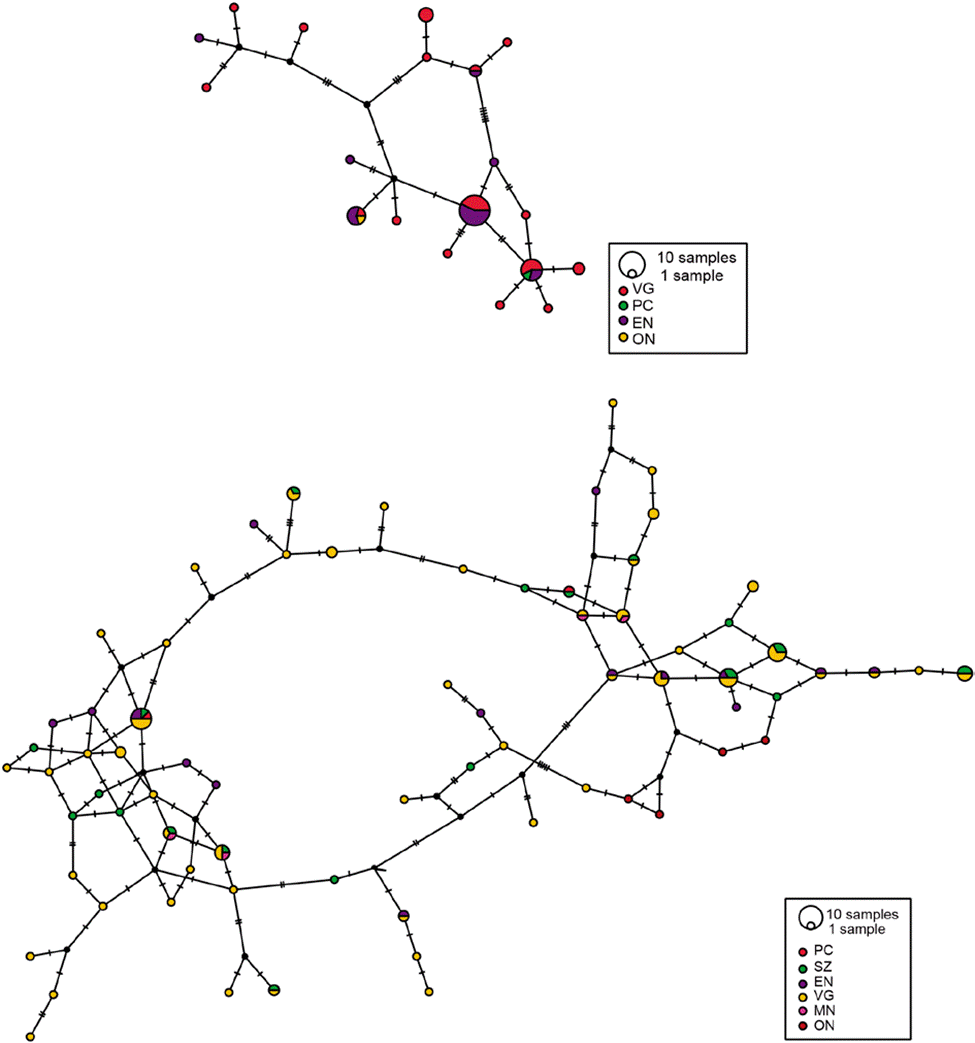
Figure 3 Haplotype networks of Phidippus johnsoni using COI (top) and H3a (bottom). The size of the circles represents the number of samples for a particular haplotype and the hash marks on the lines show the number of mutations between each haplotype. For locality codes, see Supplementary material, Table S1.
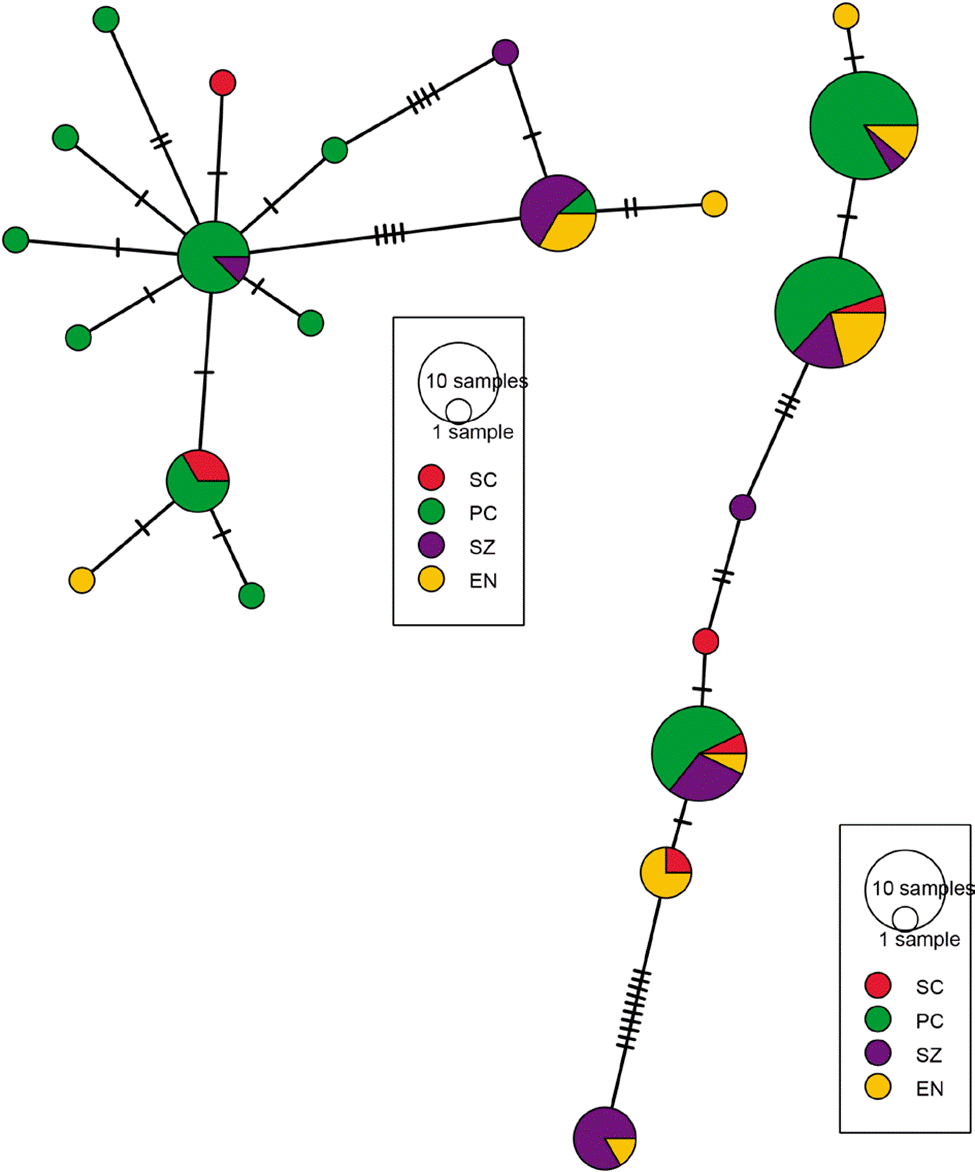
Figure 4 Haplotype networks of Phidippus phoenix using COI (left) and H3a (right). The size of the circles represents the number of samples for a particular haplotype and the hash marks on the lines show the number of mutations between each haplotype. For locality codes, see Supplementary material, Table S1.
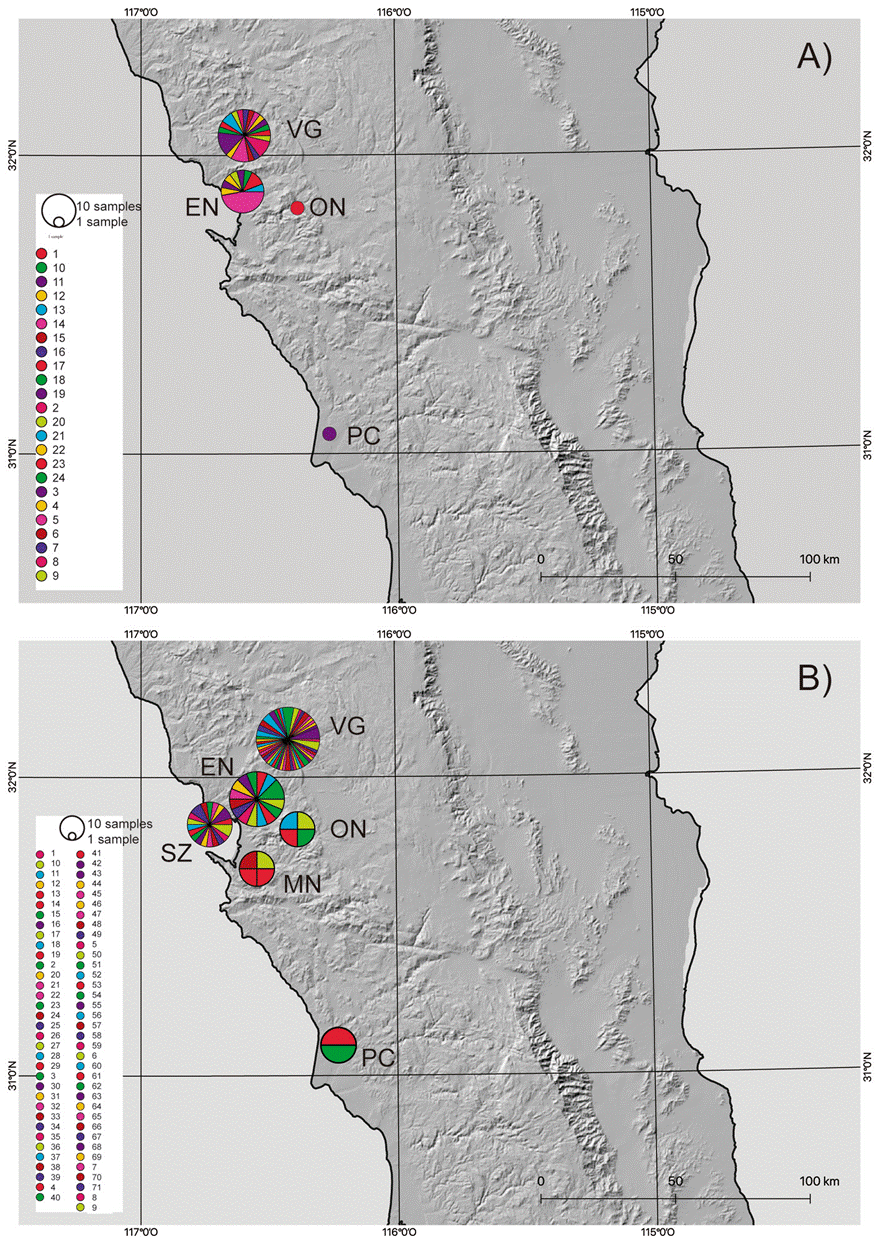
Figure 5 Maps with the distribution of Phidippus johnsoni haplotypes in Baja California, based on A) COI and B) H3a. The size of the circles represents the number of samples for a particular haplotype. Locality codes as in Supplementary material, Table S1.
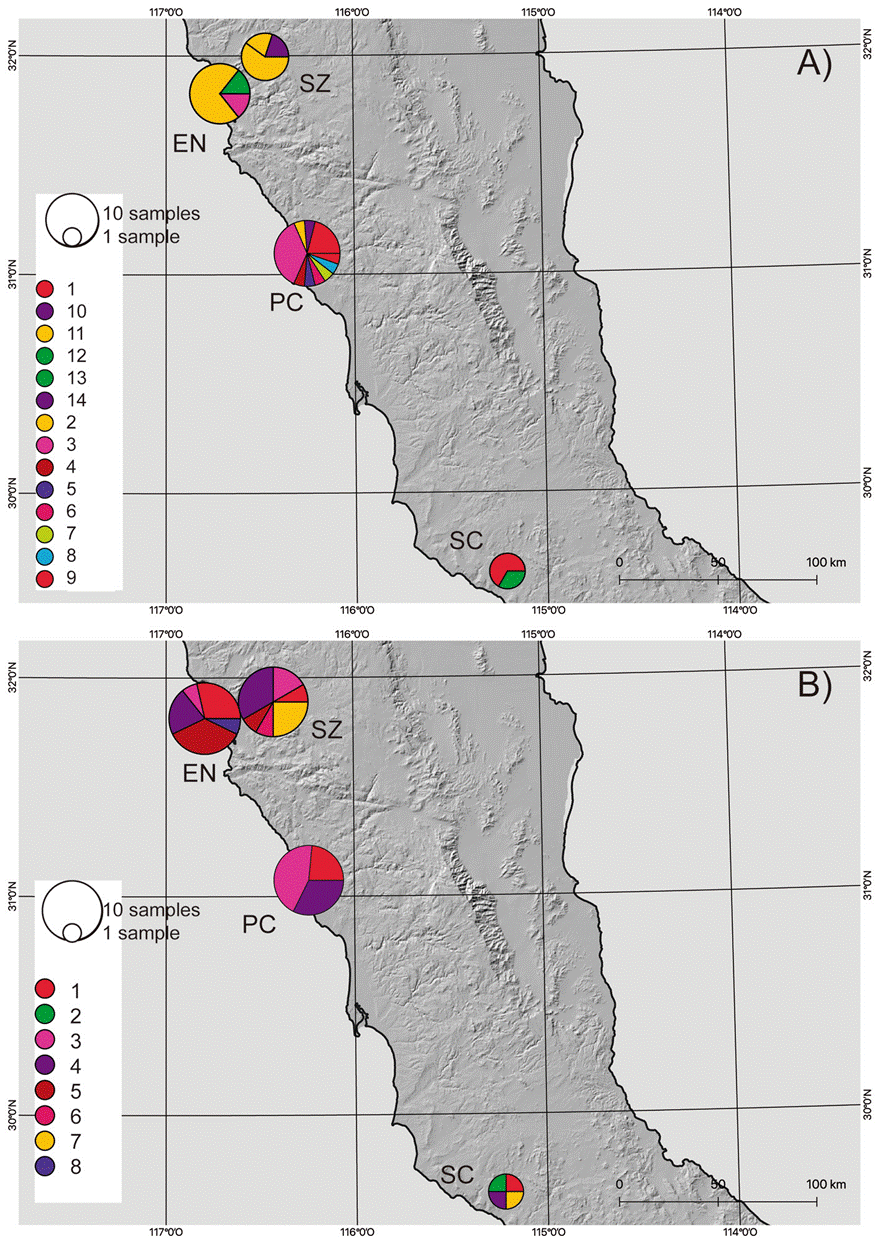
Figure 6 Maps with the distribution of Phidippus phoenix haplotypes in Baja California, based on A) COI and B) H3a. The size of the circles represents the number of samples for a particular haplotype. Locality codes as in Supplementary material, Table S1.
The general characteristics of the DNA sequence data used in this study, considering the inferred populations, can be found in table 2, where the highest haplotype and nucleotide diversity was found in the H3a marker of P. johnsoni. Comparatively, the diversity values for COI were also higher in P. johnsoni than for P. phoenix. For P. phoenix, COI haplotype diversity was higher in the southern population, whereas COI nucleotide -H3a haplotype- and H3a nucleotide diversity were higher in the northern populations. For the northern versus southern populations of P. phoenix, the Fst values were 0.149 and 0.571, based on the H3a and the COI gene fragments, respectively.
Table 2 Characteristics of the mitochondrial (COI) and nuclear (H3a) gene fragments for Baja California’s Phidippus johnsoni and Phidippus phoenix, including the 2 inferred populations for the latter
| Data matrix | N taxa | N hap | H | N sites | π | θ |
|---|---|---|---|---|---|---|
| P. johnsoni COI | 46 | 19 | 0.877 | 658 | 0.00872 | 0.01198 |
| P. phoenix COI | 34 | 14 | 0.859 | 658 | 0.00599 | 0.00849 |
| P. phoenix north COI | 12 | 5 | 0.576 | 658 | 0.00351 | 0.00512 |
| P. phoenix south COI | 22 | 11 | 0.844 | 658 | 0.00321 | 0.00755 |
| P. johnsoni H3a | 39 | 72 | 0.986 | 268 | 0.03435 | 0.01466 |
| P. phoenix H3a | 32 | 8 | 0.784 | 268 | 0.01758 | 0.01184 |
| P. phoenix north H3a | 13 | 7 | 0.840 | 268 | 0.02522 | 0.01467 |
| P. phoenix south H3a | 19 | 5 | 0.706 | 268 | 0.00982 | 0.00622 |
N taxa = Number of individual sequences, N hap = number of haplotypes, H = haplotype diversity, N sites = number of nucleotides in the sequence, π = nucleotide diversity, θ = Watterson’s parameter.
Based on the EBSP plots of the single P. johnsoni population and the 2 P. phoenix populations from this study (Figs. 7, 8), the estimated current population sizes (assuming a generation time of 1 year) are 1.5 million for P. johnsoni, ca. 500,000 for P. phoenix’ northern- and 2 million for P. phoenix’ southern population. All 3 populations are shown to have increased in size, with the population size increase starting around 150,000 years ago (kya) for P. johnsoni, 20 kya for P. phoenix’ northern and 30 kya for P. phoenix’ southern population.
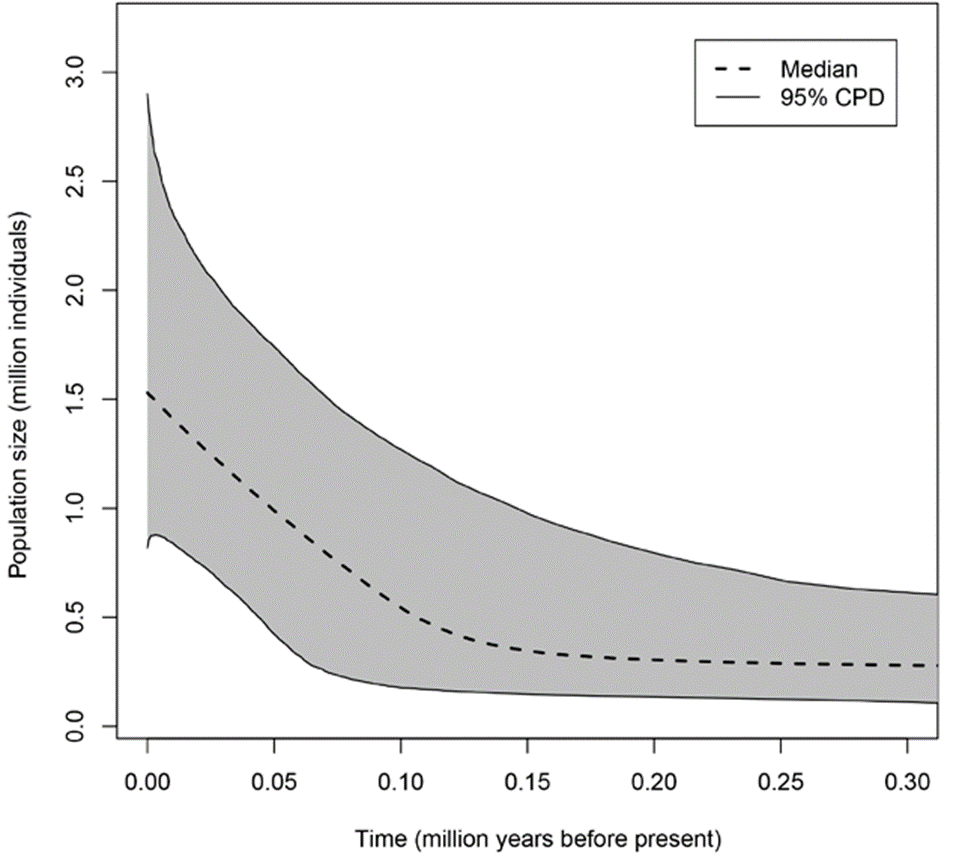
Figure 7 Extended Bayesian Skyline Plot of population size changes across time for Baja California’s Phidippus johnsoni population.
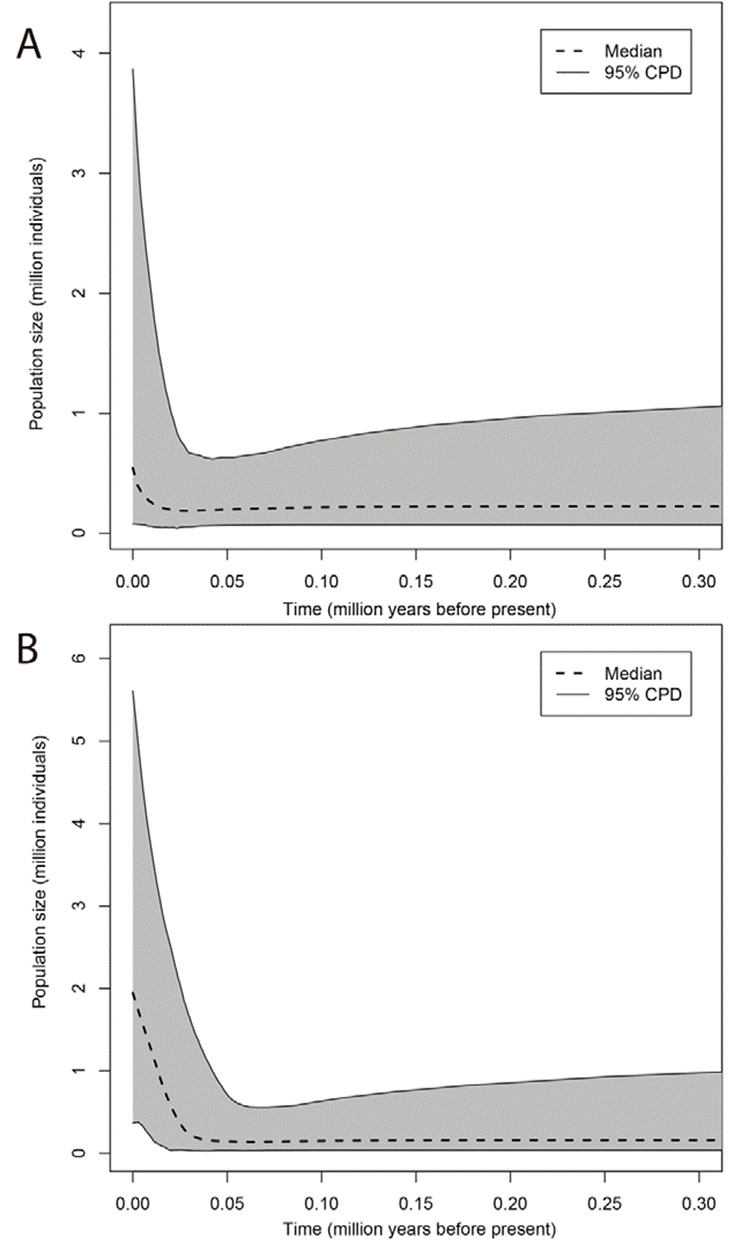
Figure 8 Extended Bayesian Skyline Plot of population size changes across time for Baja California’s Phidippus phoenix populations (A = Northern, B = Southern population).
The recombination parameter (R) calculated for the H3a fragment of P. johnsoni was 13.7, with an estimated Theta (recombination frequency) value of 9.21 and the minimum number of recombination events (Rm; Hudson & Kaplan, 1985) being 11. For P. phoenix, R = 0.001, Theta = 4.71 and Rm = 1. On the other hand, based on the KWARG analysis of the H3a matrices, there were 135 recurrent mutations and 27 recombination events for the P. johnsoni dataset and 2 recurrent mutations and 4 recombination events for P. phoenix. Considering these possible recombination events, the ancestral recombination graphs obtained from ARGweaver (Supplementary material, Figs. S3, S4) show again that there is no clear structuring by locality based on this nuclear marker for either species. The analyses estimated the average population size of P. johnsoni to be between 328,000 and 342,000, with an approximate time to the most recent common ancestor (tmrca) of 134,000 years, while for P. phoenix, the average size of both populations combined was between 249,000 and 267,000 and the tmrca ca. 171,000 years.
Discussion
Northwestern Mexico harbors unique and high biological diversity for several taxa, an example being the jumping spider genus Phidippus, for which at least 10 of its 61 species can be found in the state of Baja California. Additionally, from this study, it is clear that the area’s 2 most abundant species, P. johnsoni and P. phoenix, also have high genetic diversity. Although studies on genetic diversity of spiders from this region are scarce, another spider species, Pardosa sierra Banks, 1898 was found to have higher diversity in Baja California compared to its southern distribution (González-Trujillo et al., 2016). The link between species diversity and genetic diversity in an area is often ignored, as the former is measured as part of community ecology studies, while the latter is a component of population genetics. However, in many studies, the 2 measures were found to go together, be it because an area’s geo-climatic characteristics can promote both high species and genetic diversity in groups of organisms or because there is a direct correlation between the 2 measures, with one influencing the other (Vellend & Geber, 2005). This study adds another example to support the link between high species and genetic diversity, using Mexico’s Baja California state as the study area and Phidippus as the study taxon.
Although both Phidippus species in this study had high genetic diversity, it was markedly higher for P. johnsoni than for P. phoenix. Additionally, differences were found between the population structures and demographic histories of the 2 species in Baja California. For example, all P. johnsoni individuals from Baja California belonged to a single, panmictic large population, while P. phoenix seems to have structured populations in this same area, but the structuring was mainly found for the mitochondrial COI marker. This pattern of nuclear versus mitochondrial discordance in structuring may be due to their relative signal strength based on coalescence times being shorter in mitochondria, or it may reflect differences in male versus female-driven gene flow, often seen in species with sedentary females and more mobile males which move relatively large distances looking for females. In salticids, this strategy is common, as in other spiders, such as Homalonychus theologus Chamberlin, 1924 (Crews & Hedin, 2006). For P. johnsoni, the high recombination rate found in the H3a nuclear marker may have compromised the outcomes of certain analyses such as the haplotype networks, but can also be indicative of a large, panmictic population with a long, relatively stable demographic history (Hey & Wakeley, 1997).
Both species were also estimated to have large population sizes with hundreds of thousands of individuals, although there were discrepancies between the population sizes estimated with EBSP and ARGweaver, possibly due to the latter only using nuclear data and the former not taking recombination into account. The time to the most recent common ancestors in this area for each species was estimated around the late Pleistocene, while the population size increases were estimated to have started earlier for the P. johnsoni population than either of the P. phoenix populations. More specifically, the P. johnsoni population has a longer history than P. phoenix, starting from the late Pleistocene, approximately 150 kya during a glacial period, while the P. phoenix populations increased in size starting from 30-20 kya, corresponding to the Last Glacial Maximum (LGM). As P. johnsoni are found at higher altitudes and latitudes than P. phoenix, the former species is presumably more tolerant to colder climates (Edwards, 2004). This adaptation to the cold could explain why the LGM did not seem to have affected population sizes of P. johnsoni, as by 30 kya, they might have already been widespread and adapted to different climatic conditions. Pleistocene stability has also been found in several scorpion species of Baja California, whose distributions did not seem to be significantly affected by the LGM either (Graham et al., 2014).
The population genetic differences for these 2 Phidippus species with overlapping distributions in Baja California can be explained by their habitat preferences and distributional ranges. Phidippus johnsoni, being adapted to a wide range of habitats and thus found distributed in a much larger area, is likely to migrate more easily, thus contributing to high gene flow between localities. The relative vagility and distributional range, among other traits, have been found to influence genetic diversity in a range of other species (Meyer et al., 2009; Leffler et al., 2012; Levy et al., 2016). Additionally, the sampled P. johnsoni individuals came from the southernmost portion of the species’ entire distribution, so their population genetic parameters are unlikely to represent other P. johnsoni populations (Goldberg & Lande, 2007). On the other hand, P. phoenix, sampled from the central part of the species’ range, has traits more commonly seen in populations with narrower ecological niches (Lozier et al., 2011; Roderick et al., 2012). This work contributes to adding information on another important aspect of diversity -namely genetic diversity- to a biologically unique area while considering the species’ most important biological and ecological traits, thus providing a more holistic approach to studying biodiversity. To achieve a better understanding of the population dynamics of P. johnsoni and P. phoenix, more molecular data would be needed (Meirmans, 2015), as well as samples from the complete ranges of the species’ distributions.


 nueva página del texto (beta)


