Introduction
The location and seasonality of coastal or inland surface waters are influenced by climate and human activity. In recent years, on a global scale, in wet and sub-humid plain grasslands, groundwater levels tend to be close to the surface, a condition that promotes floods when water excess accumulates (Florio et al., 2014; Nosetto et al., 2015). This situation has a considerable impact on production, urban infrastructure, and the local and national economy.
Understanding when and where water is found on the surface is crucial, as it allows detecting the influence of this element on the movement and viable range of many plant and animal species. Additionally, such information is essential for sustainable development and the prevention of situations that may threaten the security of people, institutions, and economies (Pekel et al., 2016). Challenges in adapting to climate change include addressing the reduction of grazing lands caused by floods, grassland degradation linked to salinization following the expansion of brackish waters, and threats to transportation infrastructure (Pekel et al., 2016).
At the end of the 19th century, Ameghino (1884) suggested that floods were inherently connected to periods of drought in the province of Buenos Aires, Argentina. Water in this region is distributed irregularly, since there are extremely dry months and others in which the excessive volume of water fills lagoons and lakes, causing rivers to overflow and lowlands to flood. On the other hand, prolonged drought periods result from irregular rainfall and the rapid evaporation of accumulated water without penetrating the water table.
Flood retraction is mainly due to direct evaporation from sporadic water bodies and lagoons, soil evaporation, and transpirational discharge from vegetation when water tables are shallow to be reached by root systems (Florio et al., 2014). In sedimentary and topographically low landscapes where river networks are absent or poorly developed, the role of the evapotranspiration process is key, as it plays a fundamental role in the hydrological balance, accounting for more than 80 % of it (Pinilla et al., 2019). The evapotranspiration flow has two components: direct evaporation from the surface and transpiration by vegetation.
As vertical water flows dominate over horizontal flows, ecosystems tend to experience prolonged episodes of floods associated with rising groundwater levels, making them a critical environmental concern for residents (Nossetto et al., 2015). From this perspective, the use of remote sensing techniques in areas such as agriculture and agronomy (Atzberger, 2013) provide information about objects from a remote distance. With subsequent processing of the initial data, it is possible to collect several types of complementary information (Pasucci et al., 2017).
Space remote sensing facilitates the observation and characterization of the earth's surface. This occurs thanks to the interaction between the solar energy flux and the nature of surface elements, reflecting and transmitting or absorbing energy accordingly (Passucci et al., 2017). Remote sensing is an effective and widely used tool as it saves time and labor (Chauhan et al., 2019; Weiss et al., 2020). It plays a crucial role in acquiring precise and timely images of diverse sectors and is suitable for collecting information from large areas with a high frequency of revisions (Atzberger, 2013).
For several decades, Landsat images have been used for mapping water seasonality and changes at continental and subcontinental scales. Consequently, findings with this tool emphasize the need for water resource management strategies that integrate both climatic and socio-economic dimensions (Pekel et al., 2016). In satellite observation, capturing surface water variability poses a challenge, especially for short to medium-duration events, as the presence of clouds hinders data capture, and clouds are typically present during rainfall episodes (Pekel et al., 2016).
Mapping long-term changes in surface waters, documenting multidecadal trends, and identifying the timing (in a specific month or year) of events such as lake expansion and retreat or river channel migration provides information on the impacts of climate change (Pekel et al., 2016). It is essential to note analyzing ecosystem functioning, through remote sensing-derived information is a valid approach to studying aspects of global change (Lara et al., 2019). Thus, the objective of this study was to evaluate the performance of two normalized water indices, obtained by satellite at times of maximum and minimum annual precipitation, for the identification of flooding in the Salado River Basin in Argentina.
Materials and Methods
Study Area
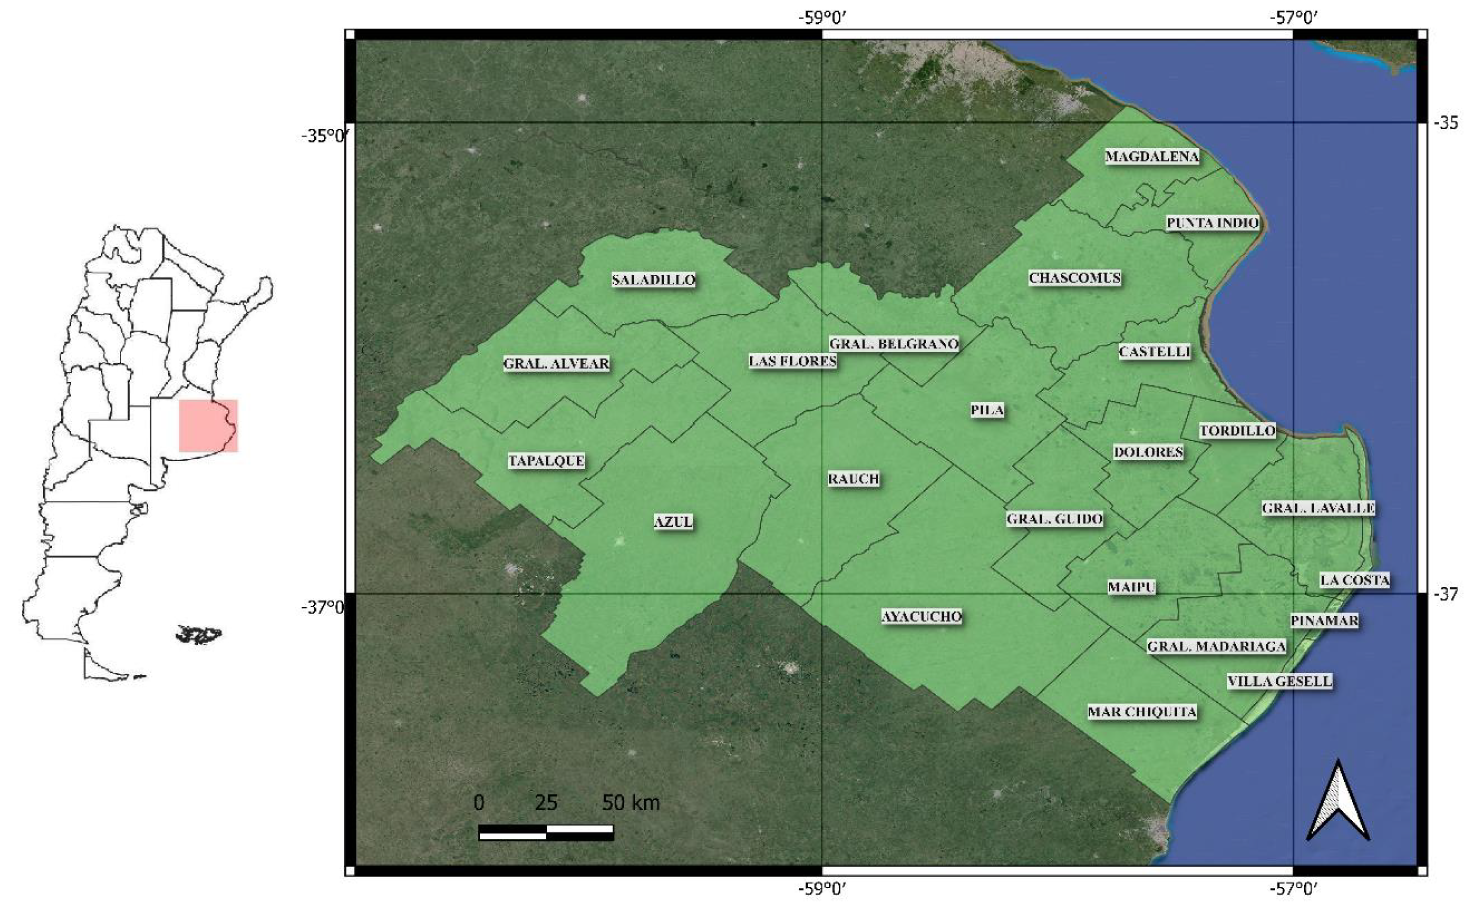
The Salado River Basin is located in the center-east of the province of Buenos Aires, almost entirely immersed in the Pampa Deprimida Ecosystem Complex (subregion of La Pampa Húmeda) in the Pampa ecoregion (Matteucci, 2012). This basin covers an area of about 7.5 million ha and includes 23 departments: General Lavalle, General Mar Madariaga, Mar Chiquita, Ayacucho, Maipú, Tordillo, Dolores, Rauch, Azul, Tapalqué, Alvear, Saladillo, Las Flores, Pila, General Guido, Castelli, Chascomús, General Belgrano, Magdalena, Punta Indio, Villa Gesell, Pinamar and La Costa (Figure 1; INTA, 2022). In addition to encompassing the Pampa Deprimida Ecosystem Complex, this basin also occupies a small portion of the Pampa Ondulada, Sierras Bonaerenses and Pampa Arenosa Ecosystem Complexes (Figure 2). The depression is wide and has a low slope that ranges between 0.025 % and 0.5 %, which hinders drainage and promotes the generation of an endorheic or areic type system. From a geomorphological point of view, the basin has an intricate mosaic structure, characterized by grasslands and bodies of water (temporary and permanent) that is a consequence of the topographic influence of deflation troughs caused by wind processes that acted during the arid paleoclimate of the Quaternary (Matteucci, 2012). According to Matteucci (2012), the climate is temperate sub-humid, mean annual temperatures ranges between 14 to 16 °C from south to north, monthly averages of the coldest month (July) ranges between 7 and 10 °C and those of the warmest month between 23 and 25 °C. Frosts are frequent in winter with an average of 200 frost-free days and no frost-free year. Average annual rainfall ranges between 850 and 1 000 mm from south to north. Rainfall is distributed throughout the year, frequently with excess rainfall in winter and deficit in summer, being of greater intensity during the spring-summer period (Matteucci, 2012). The annual water balance is not homogeneous, and the predominant winds are from the north and northeast, with lesser occurrences from the southeast and southwest. The region is characterized by soils with very poorly developed A horizons and B horizons exhibiting signs of hydromorphism (clayey, sodic Natracuols and Natracualfs) near the surface. Below this horizon, a petrocalcic horizon, also known as hardpan or tosca, can be found. The parent material consists of fine sediments of aeolian origin (loess) deposited in the late Pleistocene and Holocene. Generally, this area features plains and micro-reliefs formed by small hills and basins with poor drainage, where water accumulates from higher elevations (Matteucci, 2012). Kuppel et al. (2015) posit that the Pampa Deprimida, along with the Pampa Arenosa, are among the areas with the highest risk of flooding. In the former, of particular interest, rapid floods occur due to the accumulation of water over weeks or months. The water is surface-based, and water tables have limited connectivity; therefore, precipitation and evapotranspiration are strongly linked to each other.

Figure 1 Departments of the Salado River Basin in the center-west of the province of Buenos Aires, Argentina.
Detection of maximum and minimum annual precipitation in the Salado River Basin
Years with maximum and minimum annual precipitation were detected by analyzing precipitation patterns. For this purpose, data from satellite estimates of monthly precipitation provided by NASA (The Integrated Multi-satellitE Retrievals for GPM -IMERG-) for the period 2001-2020 were used in the Google Earth Engine platform (Gorelick et al., 2017), where commands were entered for filtering information and obtaining the desired data. Monthly GPM data from the IMERG system were used in order to characterize and describe annual precipitation. Subsequently, thematic maps were made in the QGIS platform representing the statistical analysis.
For each year from 2001 to 2020, ae collection of satellite images was obtained, and precipitation data were selected. Then the arithmetic mean was calculated to reduce the collection to one image per year, because there are images every day and the product used has monthly data derived from these daily captures. Subsequently, because the data provided by NASA are represented as a rate (mm∙h-1), these were multiplied by the number of hours in each year to obtain the annual accumulated precipitation: 8 784 h for leap years and 8 760 h for the rest. Once the satellite product was cropped to the study area, the cumulative annual precipitation (mm∙year-1) was obtained; that is, a total of 20 images that were exported for spatial analysis using the free software QGIS (QGIS Development Team, 2022). In this way, the years with the highest and lowest annual precipitation were determined to continue with the identification of flooded areas in such extreme conditions.
Identifying flooded areas in the Salado River Basin
Flooded areas were identified using satellite imagery from the Google Earth Engine platform (Gorelick et al., 2017) according to the years of minimum (2011, Landsat 5) and maximum annual precipitation (2014, Landsat 8). The years 2011 and 2014 were selected due to the availability of Landsat images with low cloud cover.
For each year, images from the period of April to July were selected as they coincide with periods of lower evapotranspiration (Pinilla et al., 2019), which is the main process controlling water outflow from the system. Initially, a function to mask clouds and their shadows was applied to the image series based on the quality band (QA band) provided by Landsat data. Subsequently, flooded areas were identified using two methodologies or derived spectral indices to assess their behavior in the study area:
where,
NDWIGao = normalized difference water index (Gao, 1996)
IRC = near infrared band (band 4 for Landsat 5 and 7; band 5 for Landsat 8)
IRM = shortwave infrared or mid-infrared (band 5 for Landsat 5 and 7; band 6 for Landsat 8).
NDWIXu = modified normalized difference water index (Xu, 2006)
GREEN = green band (band 2 for Landsat 5 and 7; band 3 for Landsat 8)
IRM = shortwave infrared or mid-infrared (band 5 for Landsat 5 and 7; band 6 for Landsat 8).
Both indices effectively measure moisture content and are primarily used for detecting and monitoring slight changes in water bodies. The values range from -1 to 1 (Passucci et al., 2017). Based on the spectral bands NIR (near-infrared) and GREEN (visible green), the NDWI can enhance water bodies against vegetation and soil in satellite images. Beyond the visible spectrum, into the infrared, water reflects virtually no electromagnetic energy. NDWI takes advantage of this property for successful identification of water bodies and control of their turbidity (Gao, 1996). On the other hand, NDWIGao is effective in highlighting the presence of water, and NDWIXu allows detecting fine changes in water masses. Both indices were employed in this study to observe which one estimates the behavior of water bodies in the basin more effectively and accurately, as the floods in this region are superficial, widespread, and have shallow depth. It is important to note that, in this study, ‘shallow depth’ is relative and varies due to the extensive study area; however, it refers to an approximate range of 5 to 15 cm depth, which can be interpreted as the saturated soil-vegetation complex.
After applying the NDWI indices to each image, the median was calculated, and threshold values were applied to each NDWI: 0.35 for NDWIGao and 0.0 for NDWIXu. The binarization of the images involved highlighting flooded areas with a value of 1 and non-flooded areas with a value of 0. Thresholding was necessary to determine flooded areas more accurately. Once binarized maps were obtained for the years with maximum and minimum precipitation selected, it was determined which method discriminated the flooded surface in the study area with greater certainty.
Results and Discussion
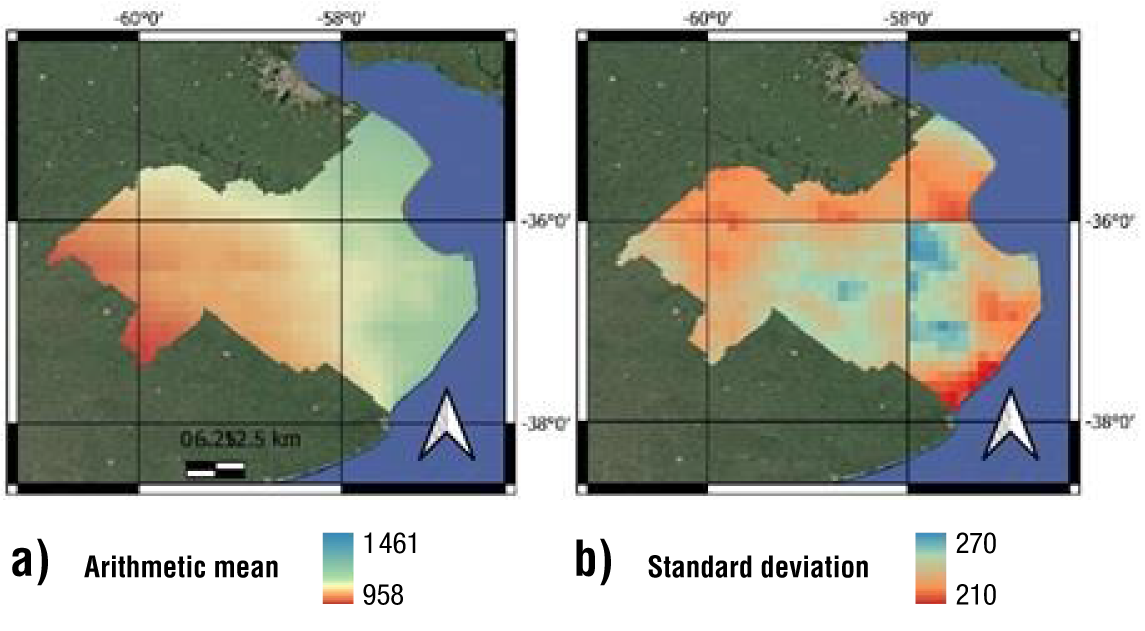
The annual precipitation data in the Salado River Basin showed great variability during the period 2001-2020 (Figure 3). Mean annual precipitation ranged between 958 mm and 1 461 mm (Figure 4a) with a clear west-east pattern, and standard deviation ranged between 210 mm and 270 mm (Figure 4b).
The highest annual rainfall was recorded in 2002 with 1 533.1 mm and, in 2014 with 1 499.5 mm and the lowest annual rainfall was in 2008 with 769.9 mm and in 2011 with 899.2 mm, according to estimates provided by IMERG. In this regard, Vázquez et al. (2009) and Passucci et al. (2017) found relatively similar values, despite working in a different temporal and spatial range. It is important to highlight that this study focused on the images of the years 2011 and 2014, due to their higher reliability, as they had a lower percentage of the area affected by clouds and their shadow.

Figure 4 Mean precipitation (mm) for the period 2001-2020 (a) and standard deviation of precipitation (b) in the Salado River Basin in Argentina
When evaluating the behavior of NDWIGao and NDWIXu, it was observed that the former was suitable for discriminating flooded areas in the region, which showed distinct spatial patterns in the two years analyzed. However, it is crucial to recognize possible limitations in the application of NDWIGao, as the water balance was found to be non-uniform in the study area. Likewise, it is necessary to note that NDWIGao may tend to overestimate flooded areas, especially when there are significant variations in moisture distribution. This potential bias should be considered in interpreting the results and implications for socioeconomic activities in the region. Currently, information obtained from passive systems (such as that used in this study) is complemented with Synthetic Aperture Radar (SAR) image data. Through active systems and their processing, precise information about the dielectric properties of soil and vegetation is obtained. To improve the certainty of detection of flooded areas in watersheds such as this one, it is desirable, in future research, to work synergistically with information from both active and passive systems.
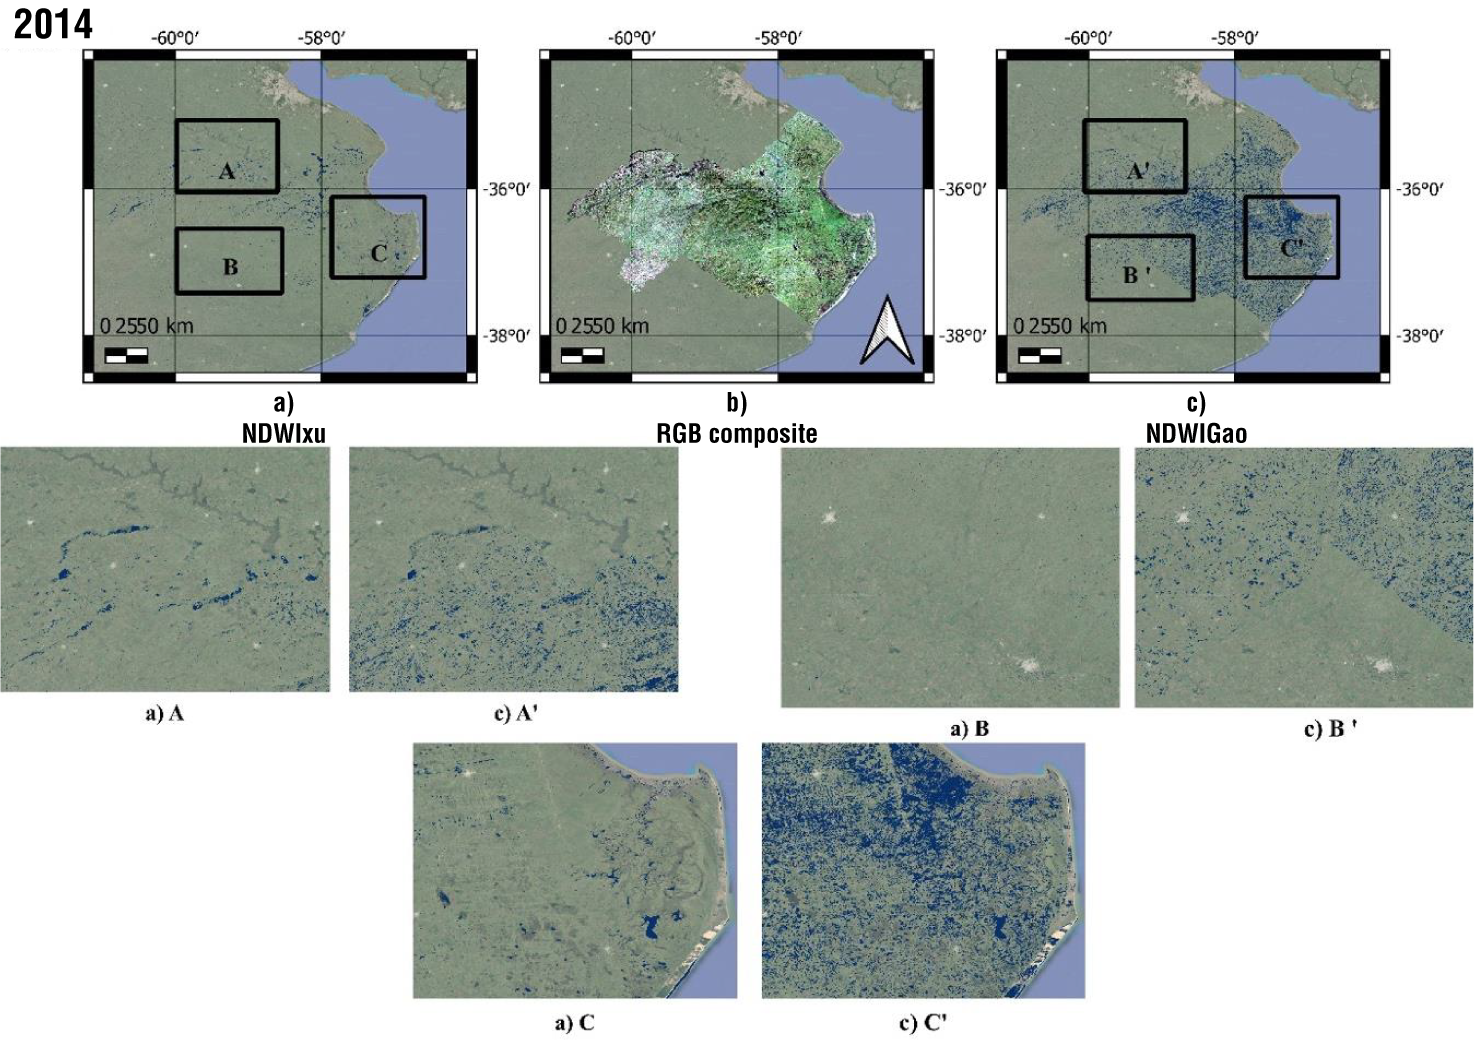
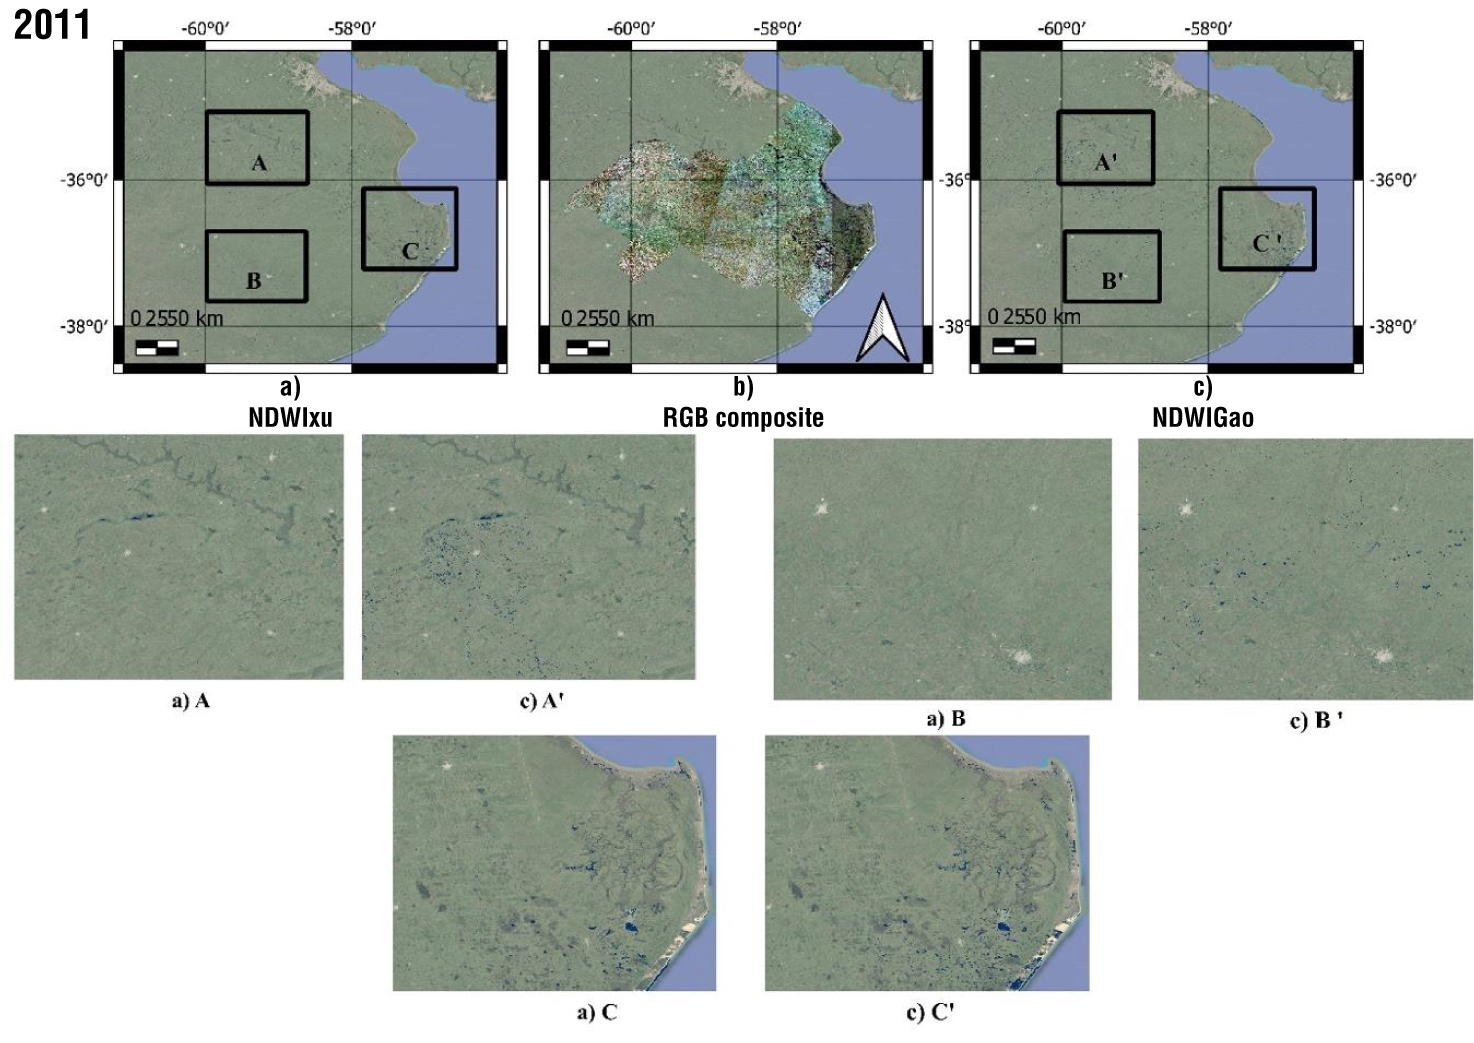
Regarding the images with a larger flooded area corresponding to the year 2014, it was observed that the product generated with NDWIXu underestimates the detected area, as it only identified larger watercourses and bodies of water (Figure 5). Simultaneously, when comparing the images from 2011 (Figure 6), the products produced by NDWIXu also showed that the index highlights only those water bodies that appear to be permanent, due to their close distribution to watercourses or perhaps slightly because they are deep. In contrast, the product created by NDWIGao indicates more dispersed areas that may have submerged or semi-submerged vegetation a few inches deep. Based on 2014, the year with the highest precipitation, Xu's index recorded 204 943.32 ha of flooded areas, while Gao's index recorded 1 607 472.5 ha. On the other hand, considering 2011 as the year with the lowest rainfall, 19 657.08 ha of flooded areas were recorded through Xu's index, while Gao's index detected a flooded area of 66 876.4 ha. From the above, it can be deduced, without falling into a reductionist perspective that does not consider land use in these ecosystems (Pinilla et al., 2019), that records of higher annual precipitation correspond to the identification of larger flooded areas and vice versa. These results may be due to the fact that water absorbs much of the energy in the near-infrared and mid-infrared, while vegetation, soil, and impermeable surfaces exhibit higher reflectance at these wavelengths (Xie et al., 2016). This supports the development of different methods for extracting flooded areas using optical images (Huang et al., 2018).
Although both indices have shown good performance in the characterization of water bodies and flooded areas in different regions of the world (Liu et al., 2016; Xie et al., 2016), they have also presented limitations in the characterization of shallow flooded areas, with turbidity or with submerged or semi-submerged vegetation (Bustamante et al., 2005), as occurs with flooding in this region of approximately 5 to 15 cm depth. In very low slope systems with blanket and very shallow waterlogging, the NDWIGao is more effective for monitoring flooded areas, something that could be replicated in systems with similar characteristics. In this context, the threshold or cutoff value could serve as a valuable indicator for application in other regions with comparable features or within the same study area for a multi-temporal analysis. The findings suggest that the Landsat mid-infrared band (1 566 - 1 651 µm) is less affected by water sediment load and can capture subtle differences, providing enhanced capability to delineate the water-soil boundary (Bustamente et al., 2005; Huang et al., 2018; Vercelli et al., 2019) when used in conjunction with the near-infrared band. This explains the superior performance of NDWIGao, which incorporates the spectral response of these two wavelengths into its definition, in contrast to NDWIXu.

Figure 5 Flooded areas identified with two water indices for the year 2014: a) flooded area in the Salado basin mapped by applying the modified NDWI (Xu, 2006); b) true color composite (RGB: red, green, blue) of the basin and c) flooded area in the Salado basin by applying NDWI (Gao, 1996). In both images ‘a’ and ‘c’, there are three cutouts: A, B and C for a and A’, B’ and C’ for c, and it is possible to compare in detail the flooded areas that each NDWI determines in sections of the study area for the period of maximum annual precipitation.

Figure 6 Flooded areas identified with two water indices for the year 2011: a) flooded area in the Salado basin mapped by applying the modified NDWI (Xu, 2006); b) true color composite (RGB: red, green, blue) of the basin and c) flooded area in the Salado basin by applying NDWI (Gao, 1996). In both images ‘a’ and ‘c’, there are three cutouts: A, B and C for a and A’, B’ and C’ for c, and it is possible to compare in detail the flooded areas that each NDWI determines in sections of the study area for the period of minimum annual precipitation
Conclusions
When using optical remote sensing, the performance of NDWIGao was superior to NDWIXu, since the former detected flooded areas at times of minimum and maximum annual precipitation, which allowed the identification of flooded areas with a depth of only a few centimeters (5 to 15 cm) and even with submerged or semi-submerged vegetation. The use of specific indices from geospatial analysis tools, such as NDWIGao and its processing in the cloud, is suitable for the retrospective analysis of water dynamics at a broad regional scale. This information contributes to the integrated management of land use plans and provides knowledge about the behavior of water in ecological systems. Therefore, the use of remote sensing techniques denotes its effectiveness not only in quantifying elements of global change but also in their contribution to all aspects of environmental management.


 texto en


