Introduction
Small remotely piloted aircraft systems (RPAS) or drones have become an efficient and viable alternative for the transport of remote sensors that provide geospatial information on land cover (Coelho-Eugenio et al., 2021; Guevara-Bonilla et al. 2020). Photogrammetric processes using high spatial resolution images taken with this technology generate precise and updated information on vegetation conditions and changes (Tang & Shao, 2015). Specifically, information on the composition of forest cover is fundamental for the planning and practical use of resources (Cárdenas-Tristán et al., 2013) and is the basis for stand definition of areas under forest management.
High-resolution spatial images obtained by sensors on drones have the same purpose as those acquired from satellite platforms, but at a substantially lower cost, and therefore, available to small forest producers (Paneque-Gálvez et al., 2014). Consequently, the incorporation of this technology into cartographic work for mining, civil engineering, and agriculture is more common nowadays (Fernández-Lozano & Gutiérrez-Alonso, 2016; García-Martínez et al., 2020; Khan et al., 2021).
The availability of drones has led to research in fields like forestry, ecology, and forest fire monitoring (Al-Kaff et al., 2020; Banu et al., 2016; Ivosevic et al., 2015). Gallardo-Salazar et al. (2020) noted that over the past decade alone, there have been 117 scientific articles exploring drone applications in forestry. Hamilton et al. (2020), Bhatnagar et al. (2020), Jiang et al. (2020), and Kedia et al. (2021) have demonstrated the potential of drone-captured images for vegetation classification in different ecosystems, identifying tree species groups, individual trees, and even low-lying vegetation like the herbaceous layer. Despite advancements, the full practical potential of drone-acquired images for forest management is still unknown. However, it can be affirmed that their similarity to satellite aerial images, but with more accessible acquisition, offers advantages in tasks such as abundance analysis, diversity assessment, forest dynamics, ecological conservation, and vegetation mapping (Veneros et al., 2020). In addition, multispectral sensor imagery can be used for forest cover classification, change detection and estimation of forest attributes, and in the modeling of spatially explicit processes (Khan et al., 2021; Torres-Rojas et al., 2017).
Images spatial resolution play an important role in vegetation mapping. The higher the resolution, the greater the ability to accurately detect small objects, which is relevant when mapping trees at genus or species level (Yu et al., 2006). But getting higher spatial resolution images imply flying a drone at a lower altitude, which results on longer fly time and higher cost. Besides, a greater amount of data is collected, meaning more computer processing time. Even though high-resolution images are now available to more people, studies on the impact of spatial resolution on vegetation detection are scarce; especially those images obtained with drones that usually have sub-metric spatial resolution. Liu et al. (2020) found that, by using this type of information, vegetation can be adequately classified within highly fragmented plantations, and suggested that the sharpest resolution is not always adequate to classify vegetation. The same may also be true when managing natural forests, since natural processes and the extraction of wood generates discontinuities in the forest canopy, creating different conditions in the vegetation (Sánchez-Meador et al., 2015). Therefore, it is relevant to analyze whether drone taken aerial photographs can be a suitable alternative for vegetation mapping of managed forests, which is one of the main and mandatory inputs for forest management planning. Regarding the above, the objective of this study was to determine the appropriate spatial resolution of drone-derived multispectral imagery to map land cover types in managed temperate forests of Hidalgo, Mexico.
Materials and Methods
Study Area
The study was carried out at the Intensive CO2 Monitoring Site (SMIC by its acronym in Spanish) located between coordinates 20° 35' 00”- 20°38' 30” N and 98° 34' 00”- 98° 38' 00” W, in the southeast of the municipality of Zacualtipán, Hidalgo, Mexico. The SMIC covers an area of 900 ha; however, given the scope of the fixed-wing drone's range, the present study was carried out in its central 100 ha (Figure 1). This region is rich in humidity, the average annual rainfall ranges between 700 mm and 2 050 mm, and it is common to have cloudy days throughout the year. Although the rainy season occurs from June to October, winter has high humidity, a result of cold fronts coming from the north, which is why the region's climate is classified as humid temperate (C(fm)w”b(e)g) (Ortiz-Reyes et al., 2015).
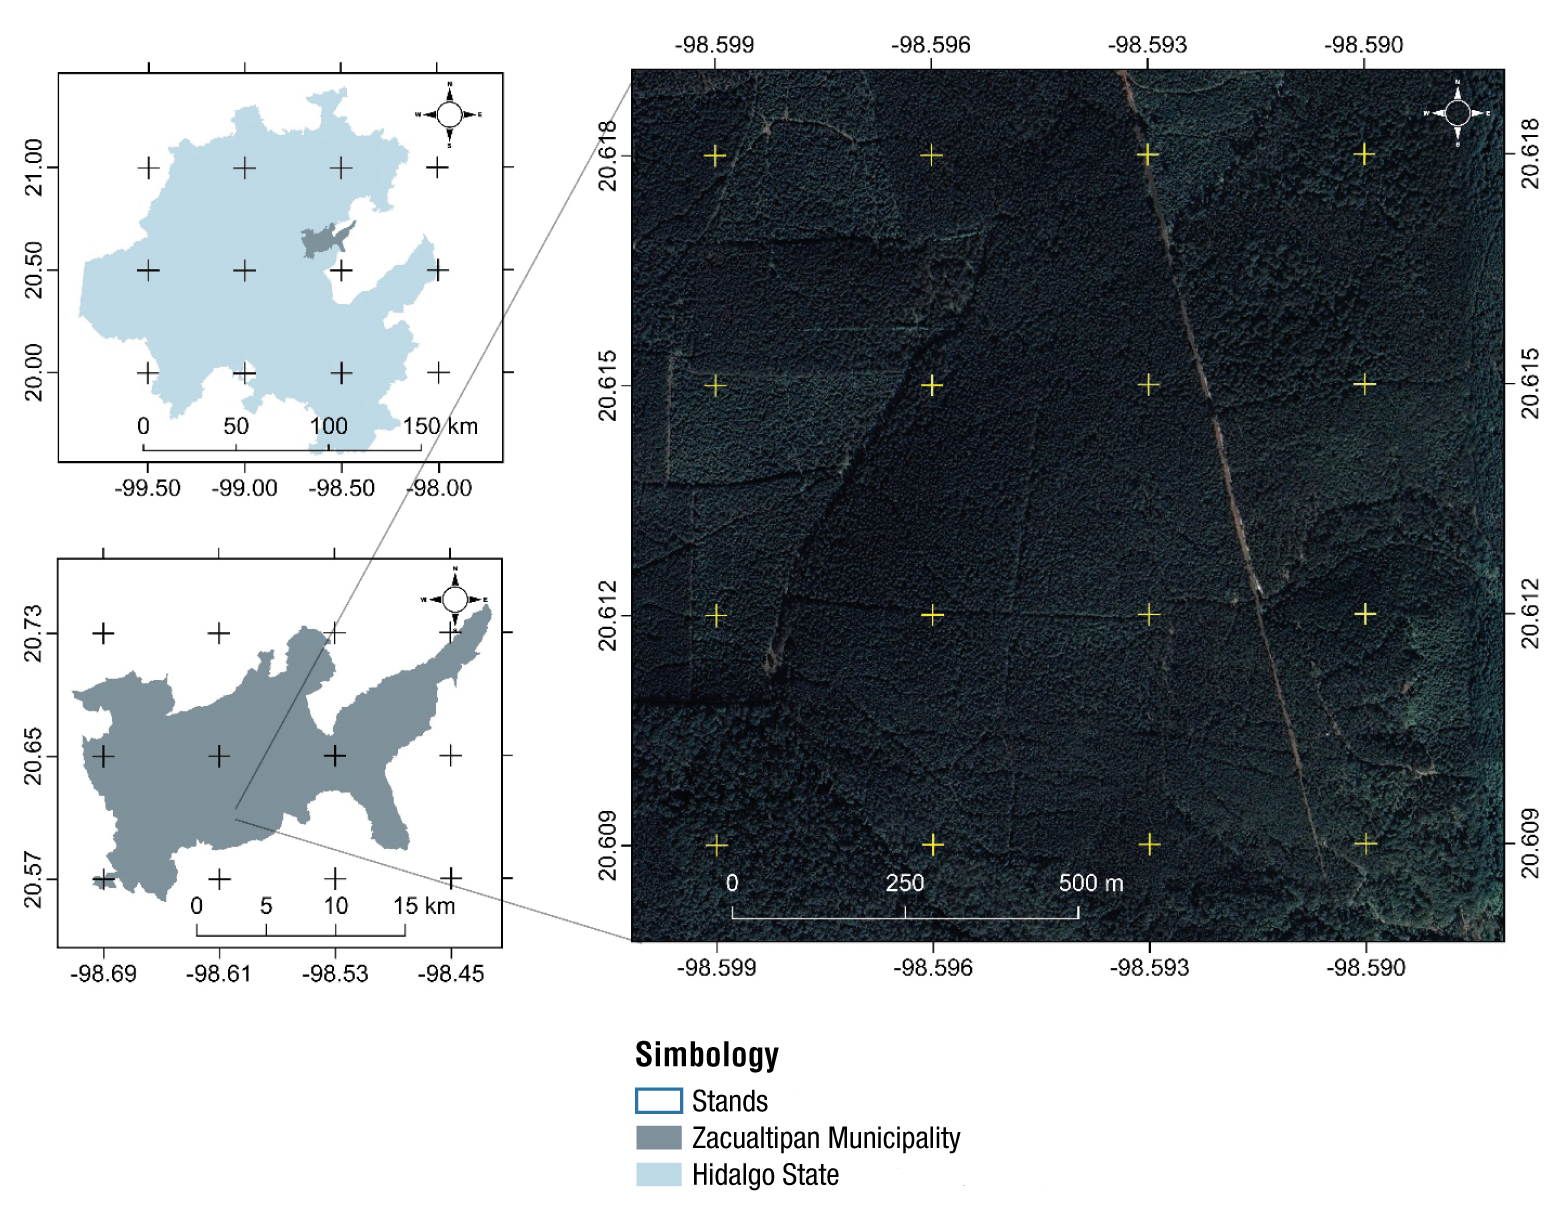
Figure 1 The study area is in the municipality of Zacualtipán, Hidalgo, Mexico. Forest organization in stands is shown.
The SMIC is managed for wood production by applying even-aged silviculture, so it is organized in even-aged stands of different ages, from four to 88 years. The dominant tree species are Pinus patula Schl. et Cham., Quercus crassifolia Humb. & Bonpl., Q. affinis Scheidw., Q. laurina Bonpl., Q. sartori Liebm., Q. excelsa Liebm., Q. xalapensis Bonpl., Clethra mexicana DC., Cornus discifloral DC., Viburnum spp., Cleyera theaoides (Sw.) Choisy, Arbutus xalapensis Kunth, Prunus serotina Kunth and Vaccinium leucanthum Schltdl. (Chávez-Aguilar et al., 2023).
Image acquisition
A total of 2 752 images were taken with a senseFly eBee X® model of a fixed-wing drone equipped with a Parrot Sequoia® multispectral sensor, which has four 12-megapixel monochrome channels, each corresponding to the following bands: green, with a central wavelength (CW) of 550 nm and a bandwidth (BW) of 40 nm; red with a CW of 660 and a BW of 40 nm; red edge with a CW of 735 nm and a BW of 40 nm; and near infrared (NIR) with a CW of 790 nm and a BW of 40 nm.
The autonomous flight plan for taking images was developed with the eMotion® software (senseFly, 2018), determining a flight height at 125 m above the ground, and overlaps of 75 % between images and 65 % between flight lines. The flight took place between 11:00 a. m. and 12:00 p. m., with a clear sky and a wind speed under 8 m·s-1. Before the drone’s takeoff and immediately after landing, the Sequoia® (AIRINOV) calibration panel was set up to register the light conditions used in the radiometric calibration and reflectance corrections of the Sequoia camera bands (Franzini et al., 2019). The geographical position of the aerial photographs was rectified with a V90 PLUS RTK (Real Time Kinematics) global satellite navigation system.
Photogrammetric processing
The 2 752 captured images were processed with Pix4Dmapper® version 4.1 software. The average deviation of the images’ geolocation was 15 cm in longitude, 14 cm in latitude, and 18 cm in altitude. Initially, orthomosaics were obtained from the green, red, redEdge, and near-infrared monochromatic bands with a spatial resolution of 0.16 m per pixel within a 100-ha forested area. Subsequently, each image was resampled with the QGIS resampling tool (Quantum GIS Team Development, 2021) to obtain information layers with spatial resolutions of 0.2 to 2.5 m at 0.1 m intervals.
Ground truth data: training fields
We visited the different stands of the forest assisted by an orthomosaic generated from digital photographs (RGB). This allowed us to identify six cover classes: pine, oak, other broad-leaved trees, herbs, bare soil, and others (mainly shaded areas that can belong to any other class). Training fields were then generated by digitizing polygons for each cover class and distributed in the different stages of development (stand age) of the forest mass: 100 for pine, 40 for oak, 40 for other broad-leaved trees, 40 for herbaceous, 40 for bare soil and 50 for others. Finally, by the QGIS semi-automated classification tool, we determined the spectral signatures of each class to ensure the separability among them (Figure 2). Although the spectral signatures of oak and other broad-leaved trees were similar, and they could be grouped into a single class, we decided to evaluate them separately, since oak are timber species of commercial interest in forest management.
Image classification
We used the Random Forest machine learning algorithm for classification and regression developed by Breiman (2001), a method used in recent years to classify vegetation at the macro-scale level (Mellor et al. 2013). The algorithm Random Forest generates and combines predictive trees, characterized by their capability to select random vectors from the sample, with equal distributions. Each tree is trained with a random sample drawn from the original training data, using the mean of each resampling with replacement (Medina-Merino & Ñique-Chacón, 2017). In the present study, 100 predictive trees were used.
The algorithm was trained by randomly taking 50 % of 319 training fields identified for classification. The remaining 50 % were used to evaluate the performance of the classifier through a cross-validation of k iterations (k-fold cross-validation). This method divides the total data into k subsets, in such a way that the model uses a different subset each time to validate it k-1 (Zhong et al., 2020). In the present study, a k = 10 was used. The same classification process was carried out for each orthomosaic, of different spatial resolution, using the randomForest library of the R® open-source software (R Development Core Team, 2021).
For each classification, the accuracy and kappa index were estimated using the confusion matrix (Congalton & Green 2009). The accuracy was obtained by dividing the number of pixels correctly identified for a vegetation class by the total number of pixels that the model predicted for the same class (Abraira, 2001). The kappa index (ƙ), is the ratio between the proportion of times in which the appraisers agree and the maximum proportion of times in which the appraisers could agree, which in turn are corrected to bring concordance to the probabilities (Abraira, 2001):
Through the confusion matrix, the accuracy of the producer and the user was estimated, with their respective omission and commission errors for each cover class. The omission error corresponds to the pixels of a cover class that were not classified in this way, whereas the commission error corresponds to the pixels classified as a cover class to which they do not belong (Sánchez-Muñoz, 2016).
The effect of image spatial resolution on land cover classification was evaluated by means of a multiple comparison of means, using spatial resolution as the independent variable and accuracy and ƙ as the dependent variable. This comparison was made using the non-parametric Kruskal-Wallis statistical test, followed by a post-hoc Mann-Whitney-Wilcoxon (p < 0.05) test, where spatial resolution was considered a grouping factor. Additionally, the graphic behavior of the commission and omission errors for the land cover classes were analyzed. Both for the comparison of means and for the elaboration of graphs, the free software R® was used. Finally, for each image spatial resolution evaluated, surface areas were estimated by cover type in the study area.
Land cover mapping
A land cover map was generated with the images whose spatial resolution showed the highest accuracy and kappa index, as well as the lowest omission and commission errors. For this, the raster layer resulting from the land cover classification process was transformed into a vector format layer and silvicultural and tree measurement information, relevant for forest management was added.
Results
Vegetation classification
Figure 3 shows a clear effect of spatial resolution of the images on the accuracy of land cover classification and the kappa index; both classification quality statistics decreased when the spatial resolution was lower. Based on the interactions defined in the k-fold cross-validation, it was observed that in centimeter-scale resolution images, the land cover classification results are distributed in a smaller range; on the contrary, in images with resolutions greater than 1 meter, the range of distribution of accuracy and the Kappa index increased.
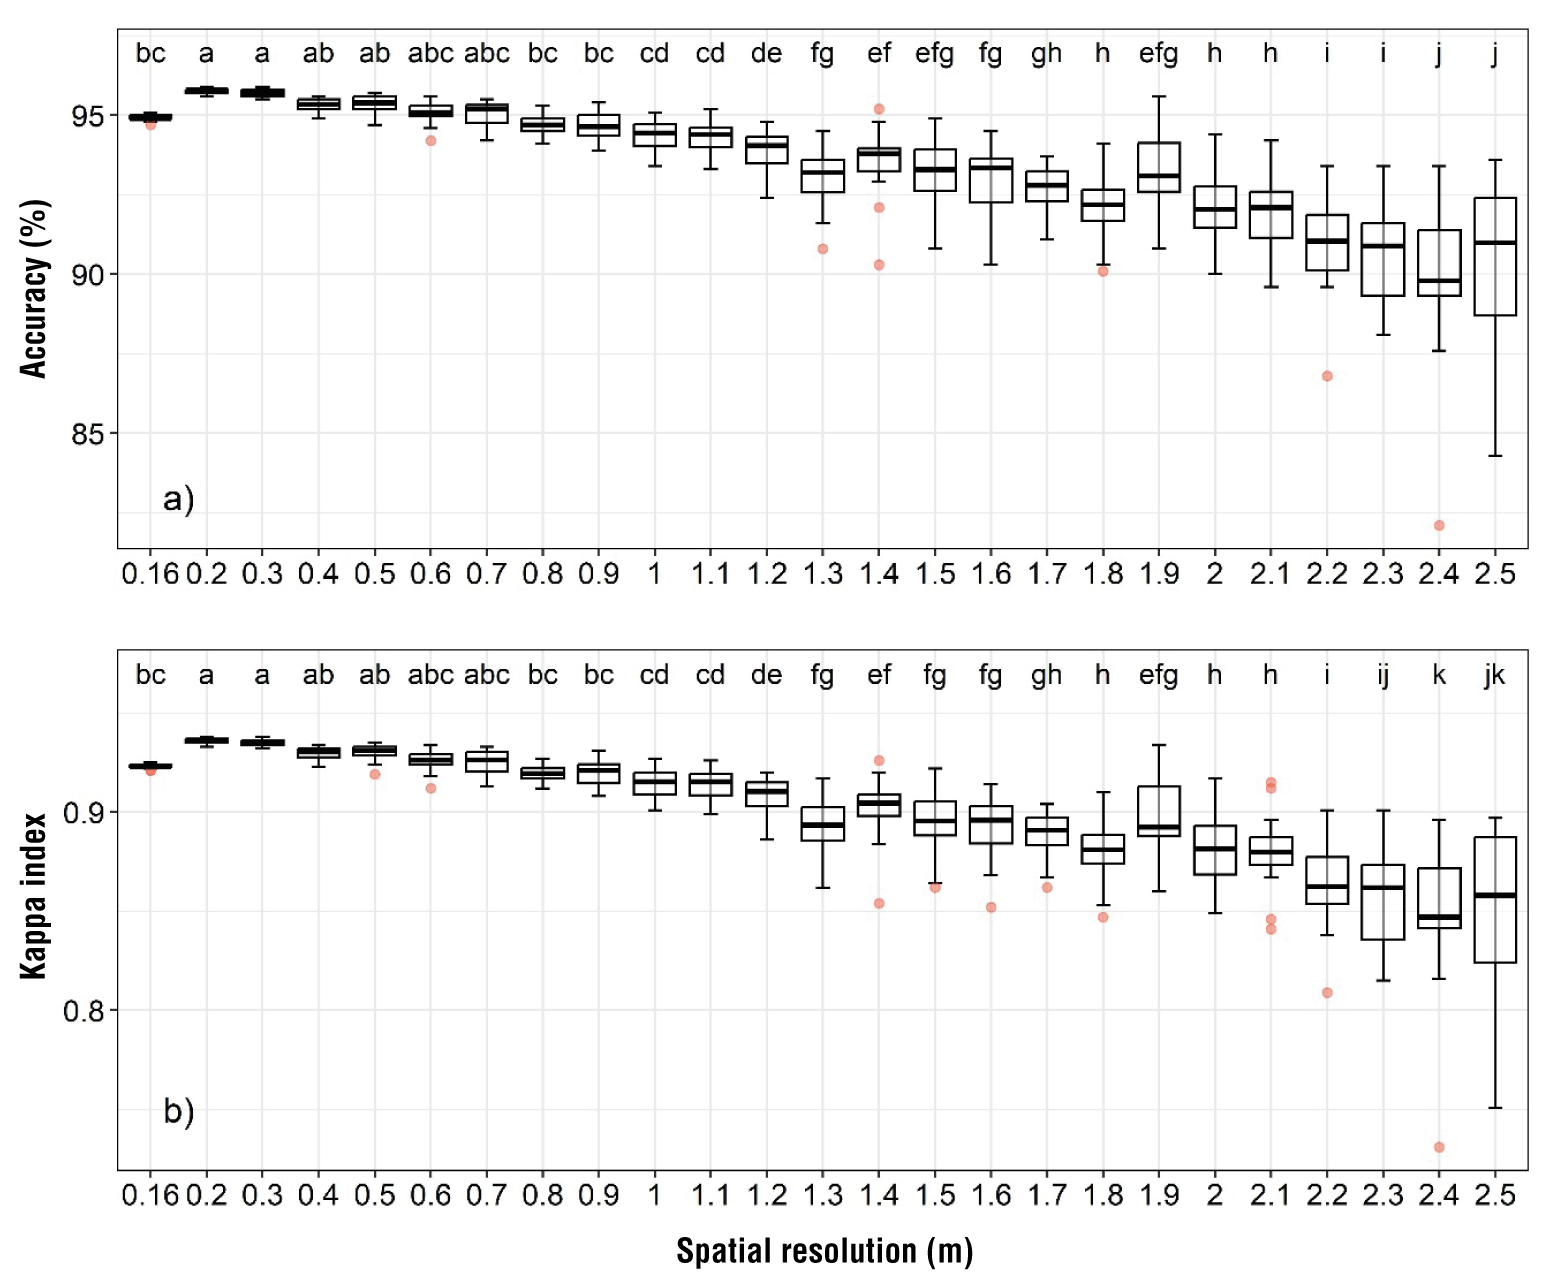
Figure 3 Effect of drone-taken multispectral image spatial resolution on land cover classification: accuracy and kappa index. Different letters indicate significant statistical differences according to the nonparametric Mann-Whitney-Wilcoxon statistical test (p < 0.05) in each graph. Red dots indicate outliers.
The land cover classification accuracy at all spatial resolutions were acceptable because they were higher than current standards (>80 % ─ Ahmed et al., 2017; Diaz-Varela et al., 2018; Liu et al., 2020; Xu et al., 2018). The highest accuracy was 96 % with 0.2 m spatial resolution images and the lowest was 82 % with 2.5 m images (Figure 3a). Regarding the kappa index, the highest values of concordance in the defined vegetation/cover classes were obtained with images of spatial resolution from 0.2 to 0.7 m per pixel (Figure 3b). The means comparison analysis showed significant differences (p < 0.001) in accuracy and kappa index (Figure 3), which indicates that the spatial resolution of the multispectral images influences the classification of vegetation in forests under forest management.
According to Figure 4, the effect of image spatial resolution on errors of omission and commission varied over the interval evaluated. For images with a spatial resolution of 0.2 to 1.2 m, omission and commission errors in classification were smaller and constant; in contrast, for images with a spatial resolution of 1.3 to 2.5 m, errors were larger and more variable.
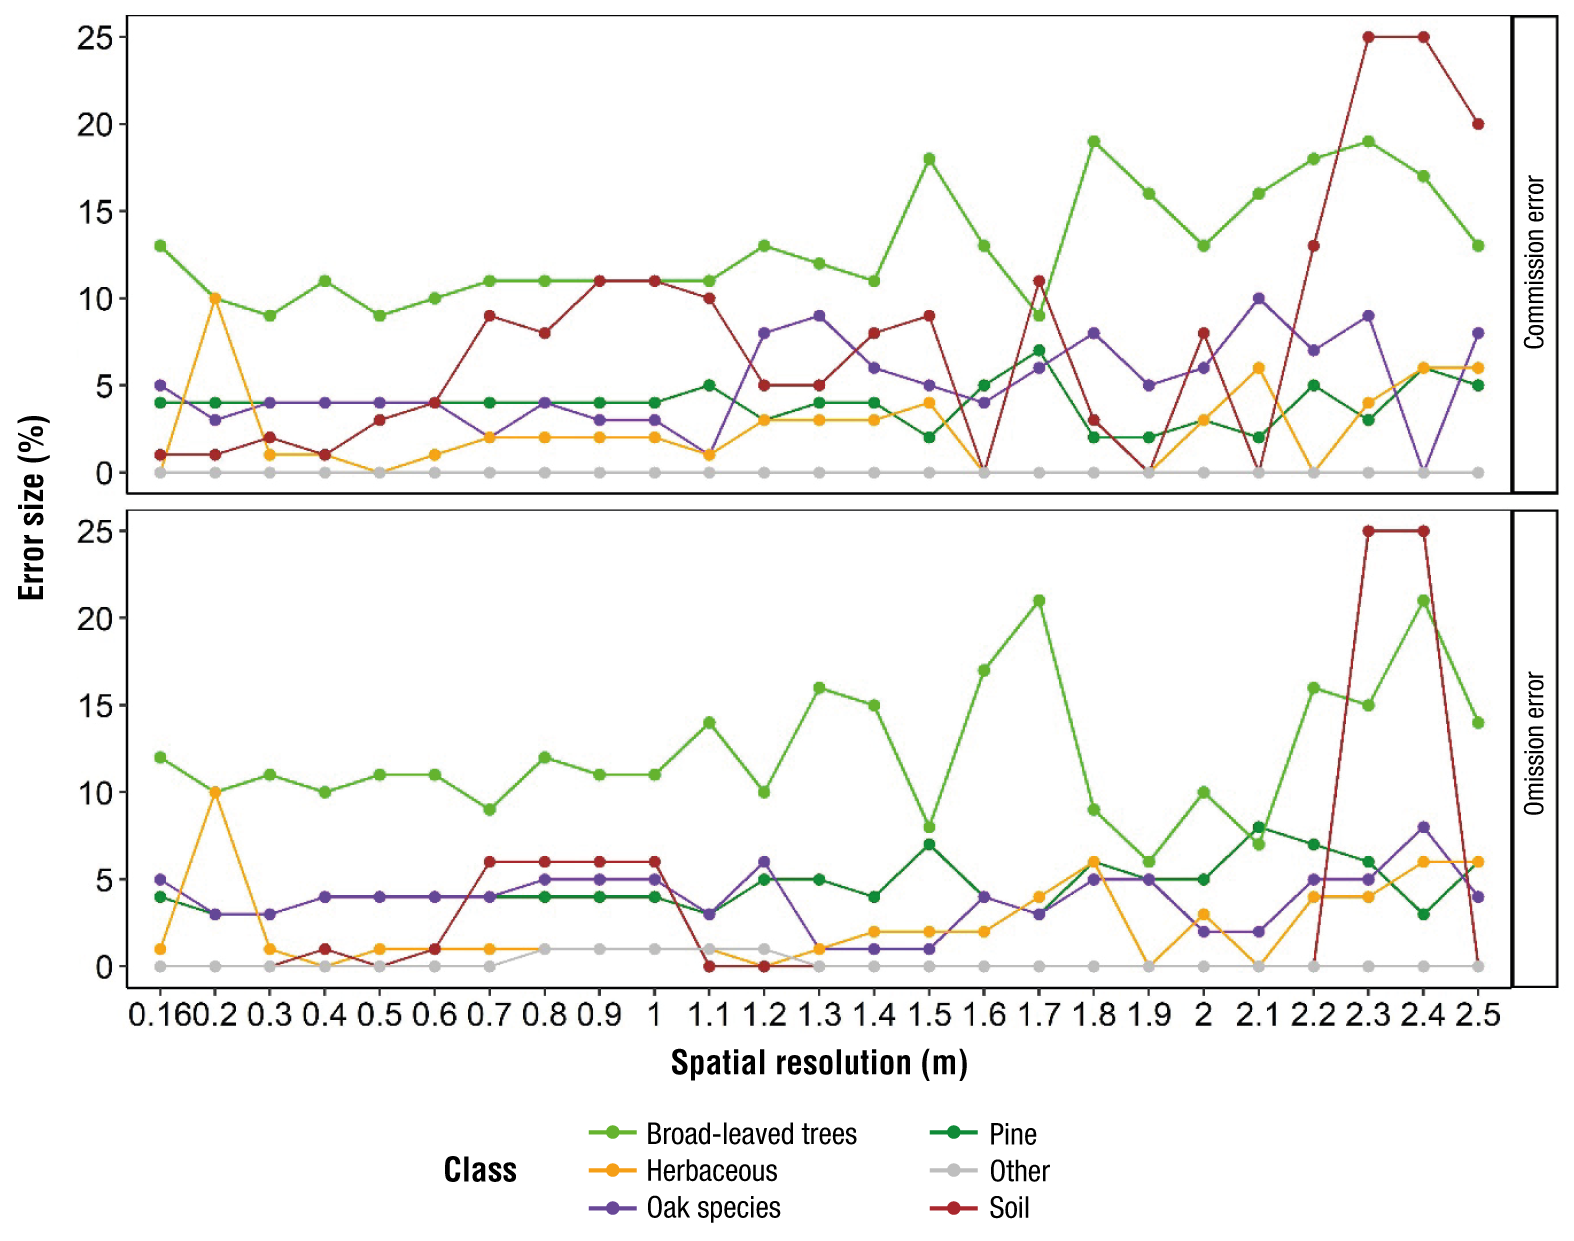
Figure 4 Distribution of omission and commission errors in land cover classification using multispectral images with different spatial resolution, using a fixed-wing drone
In general, the accuracy in the classification of vegetation/land cover classes was high, ranging from 77 to 100 %. The lowest values were for oak and other broad-leaved trees species. The best classified classes were ‘bare soil’ and ‘herbaceous’, with the lowest errors of omission and commission (<1 %; Figure 4).
The greatest confusion occurred between the oak and other broad-leaved cover classes. Some areas were classified as broad-leaved tress, but they belong to oak. These errors are common within detailed vegetation classifications since some oak’s foliage is very similar to that of other broad-leaved tree species.
Land cover classes
Figure 5 shows the fraction of total area estimated by the Random Forest algorithm for each vegetation cover class, in relation to the spatial resolution of the image. Apparently, there seems to be no effect of spatial resolution on the estimated area of each land cover class. Consistently, the greatest estimated land cover was pine, followed by oaks and other broad-leaved trees. However, the pine cover class presented a lower fractional value when images spatial resolutions were centimeters, ranging from 77 % to 85 %. Oak covered between 1.9 % and 4.0 % of the total analyzed surface, while other broad-leaved trees represented between 7 % to 12 %. Low presence cover classes, such as the herbaceous stratum and bare soil, represented a fraction from 0.7 % to 3 % and from 0.1 to 1 % respectively; these land covers were located mainly in extraction roads and fire breaks. An inconvenience of the high-resolution images taken by drones is the clear presence of shadows. In our analysis, they represented between 3.6 % and 6.6 % of the surface, having their highest values in images with resolution greater than 1.5 m.
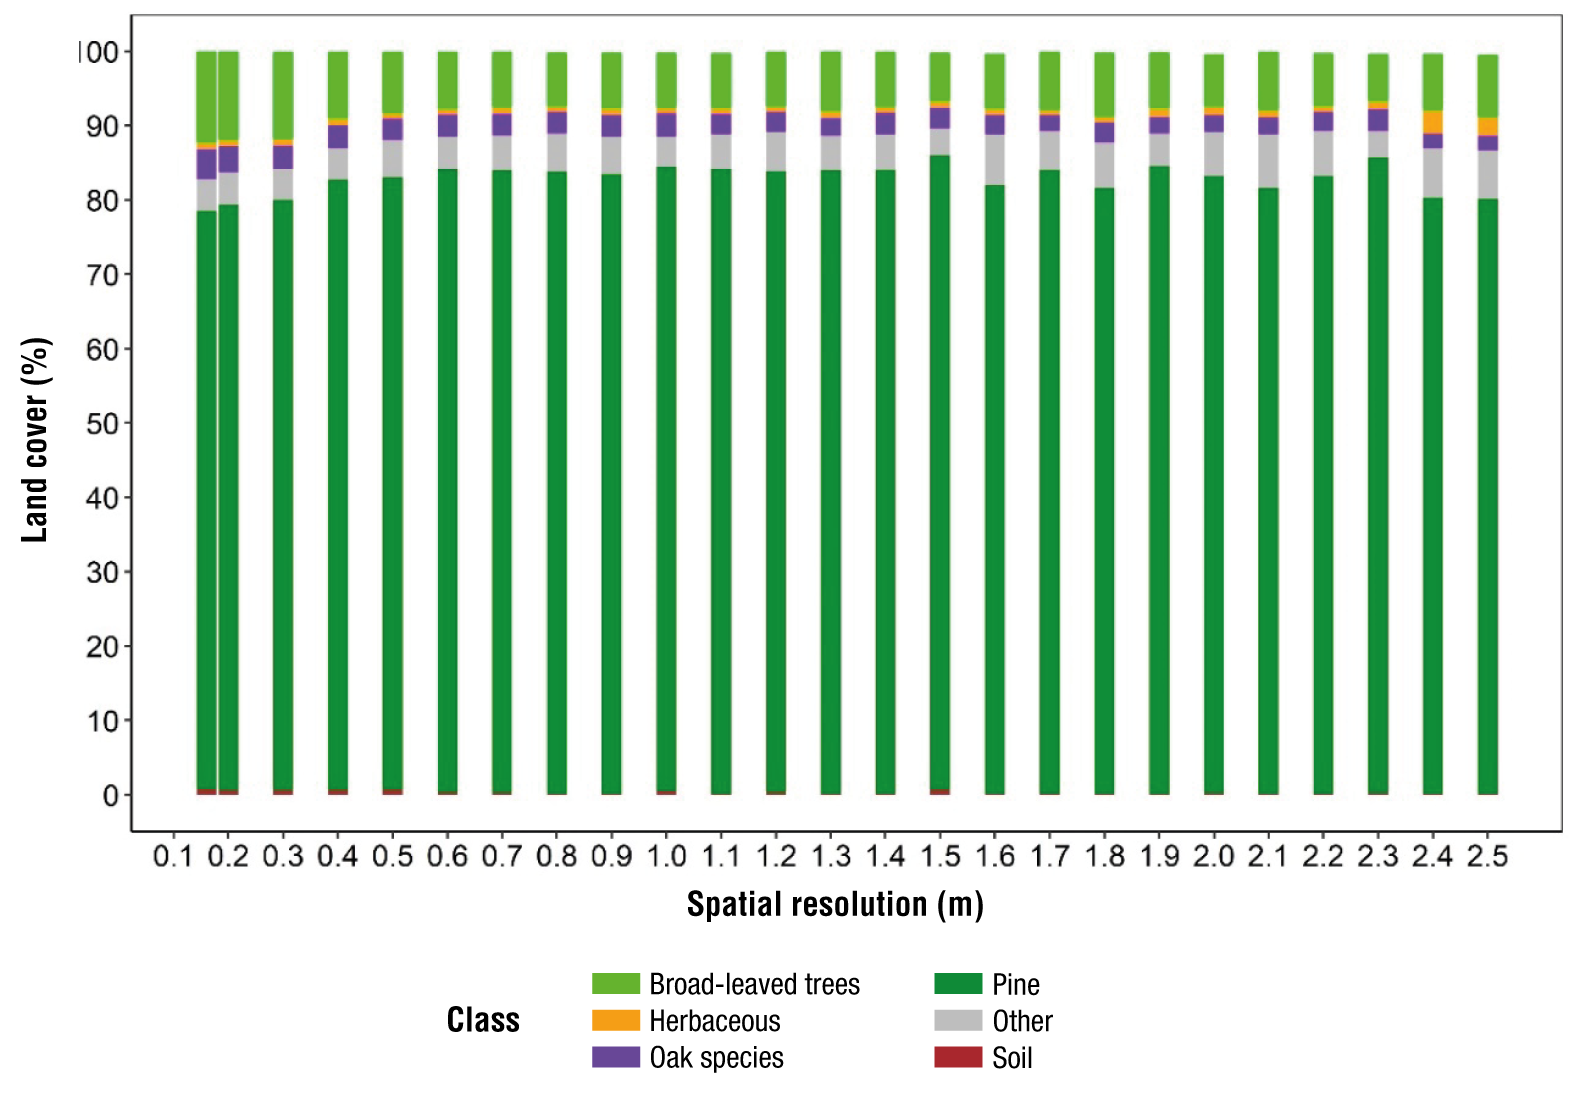
Figure 5 Fraction of total area (%) by land cover class derived from multispectral images of different spatial resolutions. Images obtained by Sequoia® sensor mounted on a fixed-wing drone.
The high-resolution images obtained by the Sequoia® sensor allow to detect different and fragmented conditions within the stands, and among stands of different ages. Figure 6 shows the best achieved land cover classification (0.2 m spatial resolution per pixel) in terms of accuracy, kappa index and lowest omission and commission errors. The conditions of areas covered by pine, oak and other hardwoods stand out as depending on the stand age. In young stands, land cover is dominated by oak and other broadleaf species with a high population of pines; however, being young trees, they cover only a small area of the stand. The areas covered by pine trees increase as the stands mature, covering between 85 and 90 % of the stand’s area when the trees are more than 20 years old. In contrast, the cover of broadleaf species decreases as the stand matures, mainly due to the application of silvicultural treatments.
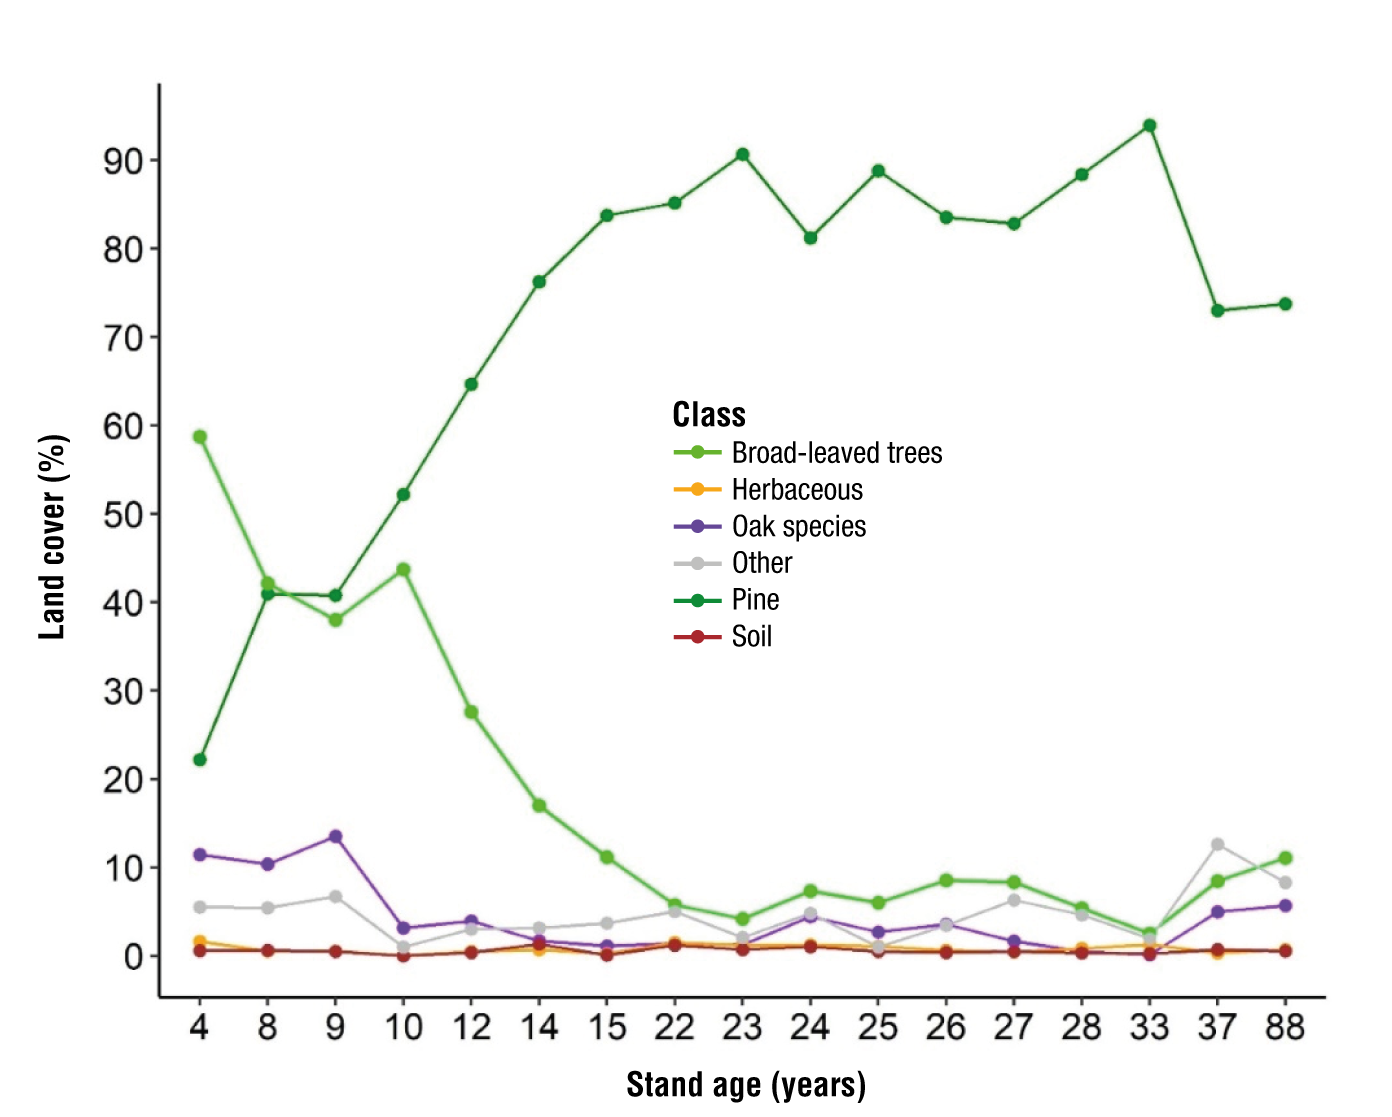
Figure 6 Fractional land cover classes variation as stands mature under a timber management scheme. Drone-taken multispectral images of 0.2 m spatial resolution were used to get land cover estimates.
Traditional cartography represents stand conditions as a single vegetation class, while high-resolution images differentiate the vegetation composition into different cover types (Figure 7). The images fine spatial resolution played an important role in detecting herbaceous and bare soil covers, as those were not detected when images with a spatial resolution of 2.5 m per pixel were used. Furthermore, in young stands the presence of shades (other classes) was lower than in areas with tall trees.
Discussion
Vegetation classification
The fixed-wing drone equipped with the Sequoia® multispectral sensor made it possible to obtain detailed information on forest vegetation. Through the combined use of high spatial resolution images and the Random Forest supervised classification algorithm we were able to identify four cover vegetation classes, bare soil areas and shade areas. The land cover prediction was the expected in a managed forest with a homogenous tree stage in the stands, being able to capture different vegetation types due to the stage of the stand (age). Although the studied area was relatively small (100 ha) compared to the scope of satellite images, the use of a drone allowed us obtaining spatial resolutions at the centimeter level, which provided enough detail to properly zone the forest, this information is basic for forest management planning and operation. In Mexico, 92.4 % of the forest properties that applied for timber harvesting to the government in 2019, have less than 300 ha (Torres-Rojo et al., 2022), which emphasizes the practical potential of using drone-taken high spatial resolution images.
The results obtained clearly show the advantage of using high spatial resolution images (<2.5 m) to map forested areas in contrast to the use of medium spatial resolution images (10 a 30 m). The latter ones are inefficient to detect cover classes with little presence within the forests, such as bare soil and herbaceous plants, generalizing the results by assigning more area to forest class while omitting other covers present.
Our forest cover classification results agree with those reported by Ahmed et al. (2017), who used the Random Forest algorithm and similar images to the ones employed in the present study to classify vegetation in mixed areas (forest and agriculture). These authors obtained an accuracy of 85 % and 93 % for shrubby and herbaceous vegetation, respectively, and 100 % for forests, bare soil, and urban areas, whereas the overall accuracy was 95 %. In another study, Furukawa et al. (2021) used the Support-Vector Machine (SVM) algorithm to classify vegetation, bare soil, and dead matter on Hokkaido, Japan’s island, utilizing multispectral and RGB images obtained with an unmanned aerial vehicle. They compared the use of images taken under cloudy conditions and clear skies over a period of four months (April-July), reaching an accuracy of 94.44 % for RGB images under cloudy conditions in the month of April, while the multispectral images reached accuracies of 97.7, 95.5, 96.6 and 98.8 % for each season of the year studied.
On the other hand, Zhao et al. (2020) classified trees, maize, peanuts, and other crops using RGB digital images, with reported global accuracies of 78.19, 73.26 and 76.53 % with Random Forest, SVM, and maximum likelihood algorithms, respectively. They also reported kappa index of 0.72, 0.71 and 0.72, which are lower than the kappa values achieved in this study. Fraser and Congalton (2021) also used drone-taken multispectral images to examine healthy and stressed pine and broad-leaved trees. In their study they established five types of ‘forest health’ and used Random Forest and SVM algorithms to map the tree conditions; they obtained a general accuracy of 65.4 %, which improved to 71.19 % when they reduced the health classes to only ‘healthy’, ‘stressed’ and ‘degraded trees’. Clearly, these values are lower than those determined in this study, although their work was more detailed and with a different purpose. Regarding the same topic of cover classification, Díaz-Varela et al. (2018) classified land cove in the Sierra del Gistral, north of Galicia, Spain using convolutional neural networks (CNN). The authors reported accuracies of 88.57, 87.30 and 87.50 % for shrub, herbaceous, swampy classes, respectively. The foregoing suggests that machine learning (RF, SVM) and deep learning (CNN) classification algorithms are capable of classifying vegetation in detail, using images derived from the photogrammetric process with drones as input.
The type of vegetation analyzed can explain accuracy differences between formerly cited studies and the present study. The spectral responses in areas with contrasting land cover such as forest, agriculture, water bodies and urban areas tend to be more clearly differentiated. Therefore, a more precise vegetation classification can be achieved (Chuvieco, 2020). Opposite to this, when the vegetation classification is more detailed and the aim is to map tree species or highly dense canopies, the classification may present difficulties and the accuracy may decrease (Baena et al., 2017). Besides, the type of information used needs to be consider classify vegetation, since multispectral images provide data about the reflectance of vegetation, while digital RGB images only produce true color information.
Image Spatial Resolution
The level of detail obtained by drone-taken images is not achieved with satellite images such as Landsat or Sentinel (Aliaga et al., 2016); therefore, an advantageous effect can be argued for drone images on land cover classification accuracy. However, how high an image spatial resolution should be? based on the comparison of means procedure carried out, the results indicate that images with a spatial resolution from 0.2 to 0.7 m provide high accuracy and kappa index without significant differences. Therefore, to optimize the classification time, images with a spatial resolution of 0.7 m per pixel can be used without losing accuracy and quality in land cover classification analysis.
Against to common believes, the use of extremely high image spatial resolutions can lead to problems when classifying vegetation, since it can detect information in small spaces such as those between the foliage of trees, and hence cause uncertainty in the classification process. In addition, furthermore, the higher the resolution, the greater the amount of data to process, and therefore, handling requires more analysis time and computers with high storage and processing capacity, which are typically more expensive than common ones. In this regard, Liu et al. (2020) analyzed the importance of spatial resolution for vegetation classification in highly fragmented areas of Xingbin district, Guangxi, China, and concluded that greater accuracy is not always achieved at the original image resolution (0.025 m), but at intermediate spatial resolutions (0.5 m).
Implications of forest cover classification in forest management
Drone-taken high spatial resolution images can result advantageous as a mean to classify the different vegetation conditions present in a forest property, mainly when timber production is an important management goal, i.e., this technology could be used to detect temporal changes in vegetation (van Lersel et al., 2018). For example, our results showed that stands older than 20 years have a more homogeneous canopy cover, dominated by pine species, which is relevant to know for planning and timber production projection. This result is logic for a forest with intensive silvicultural intervention, whose objective is to convert the irregular forest structure to regular at the end of the rotation (Hernández-Díaz et al., 2016). Small gaps in the canopy continuum were also detected in the stands, some covered by herbaceous vegetation, while others produced insufficient reflectance information to generate a classification (shades). These gaps can be explained by thinning, a silvicultural activity that promotes the diameter growth of residual trees or due to natural phenomena such as the death of trees due to competition or pests and diseases (Pérez-López et al., 2020; Ramírez-Santiago et al., 2019).
In young stands (<15 years old), the vegetation classification showed a high cover of oaks and other broadleaves, which agrees with the normal ecological succession process of managed temperate forests. The first woody species to grow after a regeneration cut are the broadleaf species such as Quercus sp., Prunus, Alnus, Clethra, Cleyera, Cornus, Turpinia, and Vaccinium. In the seedling and sapling stages, the canopies of broadleaf trees tend to be larger than the canopies of the genus Pinus tree, and therefore they cover a larger area. Moreover, the regeneration of these broad-leaved genera is by shoots that emerge from the stumps, which grow faster during the first years after the regeneration cut (Alanís-Rodríguez et al., 2011). However, silvicultural activities such as clearing and thinning reduce the presence of broadleaves and promote the establishment and growth of pines, this behavior (Figure 6).
Conclusions
Images taken with drones are viable for planning and monitoring timber management on small properties of temperate forests (<500 ha). Multispectral images from a fixed-wing drone allowed for the classification of vegetation cover with adequate accuracy, delineating the spatial distribution of pines, oaks, and other broadleaf trees accurately. Additionally, this technology detected changes in vegetation due to stand development stages, making it an effective tool for studying forest dynamics under management. The vegetation cover of managed temperate forests can be satisfactorily classified using images with spatial resolutions of 0.20 to 0.70 m per pixel. Within this range, higher resolutions (0.20 m) do not necessarily increase accuracy but do increase the volume of data to be processed; in contrast, lower spatial resolution (0.7 m) reduces acquisition time and cost, as well as processing time.


 texto en


