1. Introduction
With environmental and sustainable awareness advances, the use of mineral additions in cementitious matrices has intensified in the last years. In Brazil, in addition to their use in the national cement production, their direct use in the concrete mixtures can be verified. According to the Brazilian standard NBR 16697 (ABNT, 2018), the mineral additions can be pozzolanic, carbonaceous or granulated blast furnace slag. Of these combinations, cements can be produced to satisfy requirements such as low heat of hydration and high sulfate resistance, however, in the Brazilian market, cements with specific focus on resistance to chloride ingress still are not available (Meira e Ferreira, 2019).
The early deterioration of structures subjected to reinforcement corrosion, in special the cases induced by chlorides, has been motive for great research efforts globally since the 1980’s (Andrade, 1997; Cady, 1985; Dal Molin, 1988; Helene, 1993; Cabral, 2000; Meira, 2004)). Part of these research had the objective of understanding the chloride transport in cementitious matrices, and thus, finding alternatives to mitigate the chloride transport forwards the reinforcement, increasing then the structural service life.
One way to mitigate chloride transport is working with materials that increase the concrete resistance to its transport, be it by the refinement of the pores network, or by the higher binding capacity of the matrix (Figueiredo et al., 2014; Mendes, 2009; Thomas et al., 2012; Zibara et al., 2008).
Considering that the main transport mechanisms of chloride ions, from the external environment to the bulk concrete, are capillary absorption and ionic diffusion (Helene, 1993), and that, in most cases, the transport by diffusion dominates in the inner concrete depths (Stanish et al., 1997; Ferreira 2015), the diffusion tests have been used regularly to evaluate the resistance of cementitious matrices to chloride ingress (Al-Sodani et al., 2021; Costa e Appleton, 2007; Hansen et al., 2016; Maes et al., 2013).
Natural and accelerated diffusion or migration tests have been utilized to study the resistance to chloride ingress in different cementitious matrices. Quantifications of the diffusion rate is usually expressed by a diffusion coefficient. This coefficient (D), however, is a result of the 2nd Fick’s law and has limiting assumptions compared to the real phenomenon (Crank, 1975).
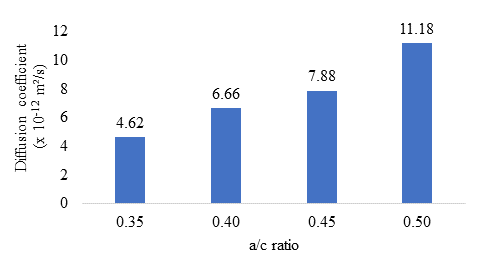
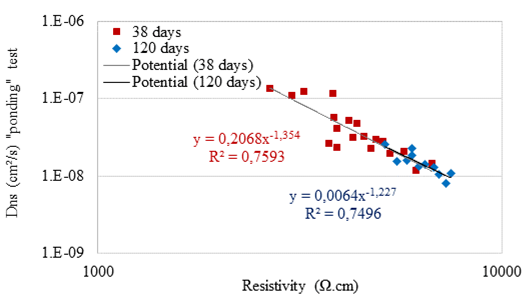
Figure 1 presents data from the diffusion coefficients for the same curing age and show the impact of the concrete porosities in the chloride transport, indicating that the porosity reduction has intense effect on the resistance to chloride ingress. On the other hand, Table 1 shows the impact of aluminates - C3A in the transport capacity of matrices with similar porosities, indicating that the formation of chloroaluminates also plays an important role in the reduction of the chloride transport in cementitious matrices. Even though diffusion tests have been used regularly to evaluate the resistance to chloride ingress in cementitious matrices since some time in Europe, North America, and other regions, in Brazil, these tests still are neglected. Ou the other hand, the time required to perform these tests incited alternatives to be sought in the later years. In this context, the surface electrical resistivity, which produces instantaneous results, has good relationship with the chloride diffusion test. This land of applications of the surface electrical resistivity tests have been observed more frequently in the last decade in the Carmen Andrade’s publications (Andrade, 2018; Andrade et al., 2014; Andrade e D’Andrea, 2011). Figure 2 shows examples of the good relationship between the surface electrical resistivity and the diffusivity of chloride ions.

Data: Valipour et al. (2013)
Figure 1 Relationship between water/cement (a/c) and diffusion coefficient of concrete.
Table 1 Relationship between aluminate content and time to initiation of corrosion of concretes with different C3A contents.
| C3A Content | w/b ratio | % Free chlorides | Time to initiation of corrosion, days |
|---|---|---|---|
| 2% | 0,5 | 86% | 96 |
| 9% | 58% | 163 | |
| 11% | 51% | 180 | |
| 14% | 33% | 228 |
The active mineral additions (pozzolans) are known for providing, to the concrete, pore refinement and, some of them, higher chloride binding capacity to the cementitious matrices (Moffatt and Thomas, 2018; Meira, 2017). Usually, the use of pozzolanic additions such as fly ash, metakaolin, silica fume and rice husk ash results in the reduction of the matrix porosity and, depending of their composition, also increasing the binding capacity (Al-Sodani et al., 2021; Thomas et al., 2012), helping then in reducing the transport rate of this aggressive agent.
Considering that each of these additions presents a singular impact in the behavior of concrete regarding the chloride transport in function of their pozzolanic activity and their chemical composition, they can lead to various performances in concrete structures exposed to marine environments.
In this sense, this study evaluates the chloride transport capacity of concretes produced with pozzolanic additions from Brazil, especially fly ash and metakaolin, considering natural chloride diffusion tests and surface electrical resistivity tests in laboratory environment.

Data: Andrade et al. (2014)
Figure 2 Relationship between electrical resistivity and diffusivity of chloride ions.
2. Experimental work
Concretes with water to binder rations of 0.45 and 0.55 were used in this work. For each water/binder fraction, mixtures with high initial strength cement - CP V ARI, metakaolin - MK, fly ash - FA, composed the mixtures presented in Table 2.
Table 2 Concrete mixtures used in the present Work.
| Mixture | CP V ARI (Kg) | MK (Kg) | FA (Kg) | Ratio w/b | Fine aggregate (Kg) | Coarse aggregate (Kg) | Water (Kg) | Aditive (%) |
|---|---|---|---|---|---|---|---|---|
| REF_055 | 367 | - | - | 0,55 | 837 | 977 | 202 | - |
| CP V_MK_055 | 330 | 37 | - | 0,55 | 837 | 977 | 202 | 0,3 |
| CP V_FA_055 | 275 | - | 92 | 0,55 | 837 | 977 | 202 | 0,3 |
| REF_045 | 464 | - | - | 0,45 | 754 | 939 | 213 | 0,3 |
| CP V_MK_045 | 417 | 47 | - | 0,45 | 754 | 939 | 213 | 0,4 |
| CP V_FA_045 | 348 | - | 116 | 0,45 | 754 | 939 | 213 | 0,2 |
Six mixtures were produced, being: REF the reference mixture, MK the mixture with 10% cement replacement by metakaolin, and FA the mixture with 25% cement replacement by fly ash. These replacements were in mass.
The fine aggregate was a medium river sand with maximum diameter (Dmax) of 4.75 mm and fineness module of 2.76. The coarse aggregate was a granite gravel with Dmax of 19 mm and fineness module of 7,14. Regarding the fines (cement and pozzolans), the medium diameter (Dmed) found was 8.74 𝜇m to the CP V ARI, 14.83 𝜇m to the metakaolin and 39.23 𝜇m to the fly ash, all obtained with the laser diffraction of the dry powder with particle diameter range between 0.10 𝜇m and 500 𝜇m.
Figure 3 shows the particle size distribution of the aggregates and fines used. It should be noted that the fly ash presents a higher particle size distribution than the CP V ARI and MK. Neto (2018) working with fly ashes of the same region, to obtain a size distribution close to the cement, used a milling procedure for 10 minutes and obtained Dmed of 27.18 𝜇m. In this study the fly ash was used as received, resulting in superior particle size than the remainder fines. A superplasticizer additive, polycarboxylate-based and chloride-free, was used.
Other than the particle size distribution test, x-ray florescence (XRF) for all fines and x-ray diffraction (XRD) for all pozzolanic additions were used, which results are presented in “Table 3” and “Figure 4”, respectively.
In Figure 4 (A), crystalline peaks of Quartz, Mullite, Hematite and Calcite are observed, with ou amorphous halo between 15° and 30° indicating the presence of reactive materials. In Figure 4 (B), Quartz, Bornite and Diatomite peaks were identified, with a discrete amorphous halo between 20° and 30°. Even though the MK presented a smaller amorphous halo than the FA, according to the Brazilian standard NBR 5751 (ABNT, 2015), the pozzolanic activity of MK was significantly superior to the FA. According to the NBR 12653 (ABNT, 2015), the material is considered pozzolanic when the sum of silicon, aluminum and iron oxides is superior to 70%. According to “Table 3”, the result of this sum is 89.41% to the fly ash and 95.31% to the MK. This aspect, in addition to the smaller particle size of the MK, is an explanation to the superior pozzolanic activity of the MK compared to the FA.
Table 3 Chemical composition of fines
| Samples | CaO (%) | SiO2 (%) | Fe2O3 (%) | Al2O3 (%) | K2O (%) | TiO2 (%) | SrO (%) | ZnO (%) | ZrO2 (%) | total |
|---|---|---|---|---|---|---|---|---|---|---|
| CP V ARI | 75,44 | 12,56 | 5,10 | 4,23 | 2,11 | 0,15 | 0,15 | 0,06 | 0,03 | 100 |
| Metakaolin | 0,82 | 49,74 | 6,79 | 38,78 | 1,27 | 0,05 | 0,05 | 0,26 | 0,26 | 100 |
| Fly ash | 3,08 | 52,57 | 9,10 | 27,74 | 5,54 | 0,05 | 0,05 | 0,09 | 0,22 | 100 |
For each evaluated mixture, 16 cylindrical specimens (CS) with 100 mm diameter and 200 mm height were produced. Five of these specimens were used for the chloride diffusion test (following recommendations from the NT BUILD 443 (1995), 6 were used for the compressive strength test (ABNT - NBR 7215, 2019), 2 were used for the water absorption test (ABNT - NBR 9778, 2005) and 3 were used for the surface electrical resistivity test, with Wenner method. The CSs were demolded 24 hours after casting, labeled, and then cured for 28 days in environments with 25 ± 2 °C and relative humidity higher than 95%.
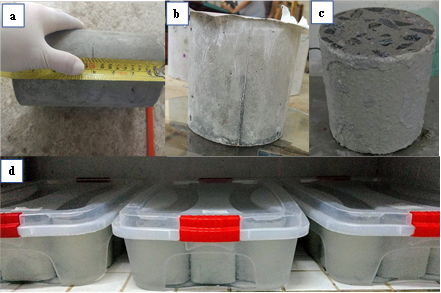
After curing, the CSs were prepared for exposure to the aggressive environment with chlorides, following the procedures specified in NT Build 443. In Figure 5, the specimens preparation and exposure environmental are specified.
The CSs were ait in half to attend the dimension required by the standard (NT Build 443), 100 mm diameter and 100 mm height (b), and then were saturated in calcium hydroxide solution [Ca(OH)2] with 3 g/l concentration, until a stable mass was obtained. After that, the specimens were epoxi painted (c), leaving only the upper surface of the specimens free, allowing then the unidimensional chloride diffusion. After the preparation, the specimens were immersed in a sodium chloride (NaCl) solution with concentration of 2.8 M (165 g/l ±1) and temperature of 23 ± 2 °C for 90 days.
At the end of this period, powder samples were extracted from the CSs to obtain the chloride profiles. These samples were extracted from the depth of 0-1 mm, 1-3 mm, 3-5 mm, 5-8 mm, 8-12 mm, 12-16 mm, 20-25 mm, and 25-30 mm. These samples were obtained from successive cuts parallel to the face exposed to the NaCl solution. For the cuts, a diamond saw was used, with a mortar and pestle to finalize the powdering, and remotion of any metal particles (from saw) by a magnet.
With the powdered material, the next step was the concentration analysis of the free and total chloride ions by potentiometric titration, following the procedures recommended by RILEM (TC 175-TMC, 2002a, 2002b). For the titrations, recommendations of the standard ASTM C 114 - 03 (2007) were adopted.

Figure 5 Preparation procedure of the CSs following the NT BUILD 443: (a) cut delimitation (100 mm diameter by 100 mm height); (b) cut samples ready for epoxi resin; (c) sealed sample ready for immersion in 2.8 M NaCl solution; (d) samples subjected to chloride solution.
With the concentration values and their respective depths, curve fitting to hie experimental values using Fick's 2nd law Equation (1).
Where: C(x,t): chloride concentration in depth x and in time t (% binder mass); x: depth parallel to the flux of the chloride ingress (cm); t: period of exposure to chloride solution (s), Ci: initial concentration of chlorides in concrete (% binder mass); Cs: chloride concentration on concrete surface (% binder mass); erf: Gauss’s error function; Dns: diffusion coefficient for the non-stationary state in time t (cm²/s).
The compressive strength tests were carried out at ages 28 and 90 days; the water absorption test at 90 days, and the surface electrical resistivity test at 28, 90 and 154 days.
3. Results and discussions
3.1 General characteristics
Figure 6 presents the average values of the compressive strength at 28 and 90 days. The effect of the w/b reduction and of the age in the strength is noticeable, with increase in the strength with reduction of w/b and between 28 and 90 days.
Evaluating the impact of the mineral additions, mixtures with MK and FA presented, in general, lower compressive strengths compared to the REF concretes. In this case, higher reactivity of the CP V cement may have occurred producing higher initial strengths, in addition to the lower reactivity of the mineral additions which required more than 90 days of age for the pozzolanic effect to be relevant.
Other researchers such as Cheng et al., (2017), Liu et al., (2014) and Liu et al., (2016) obtained similar results, with reduction of 23% and 15% for concretes with 15% cement replacement by fly ash, in mass, and for 0.47 w/b. Figueiredo et al. (2014), by investigating the contribution of MK against the chloride effect, obtained reductions of 7% in the 90 day compressive strength with 10% replacement of cement by metakaolin and 0.60 w/b.
In Figure 7, average values (2 CSs) are presented for the total water absorption by immersion and the void index obtained by this same test described in NBR 9778 (ABNT, 2005). According to this standard, the void index is a relation between the volume of permeable pores and the total volume of the specimens. For that, it is expected that the higher the void index, the higher the capacity of water absorption of the sample.
It is known that the use of mineral additions in the mixture alters its pore structure and the porosity. In this work, samples without pozzolanic additions presented lower void indexes and higher compressive strengths. In this sense, the age of 90 days may have been insufficient for the pozzolanic effect to have significant contributions on the porosity. This behavior is also corroborated by the higher particle sizes and less expressive amorphous halos of the mineral additions, presented in Figure 4.
3.2. Electrical resistivity and mass transport
In relation to the electrical resistivity, according to Andrade e D’Andrea (2011), less porous concretes present higher electrical resistivity. According to Santos (2006), the resistivity is extremely sensible to the microstructure of the matrix, and factors related to the pore structure, composition, and ion concentration of the pore water, in addition to the environmental factors, directly affects its results.
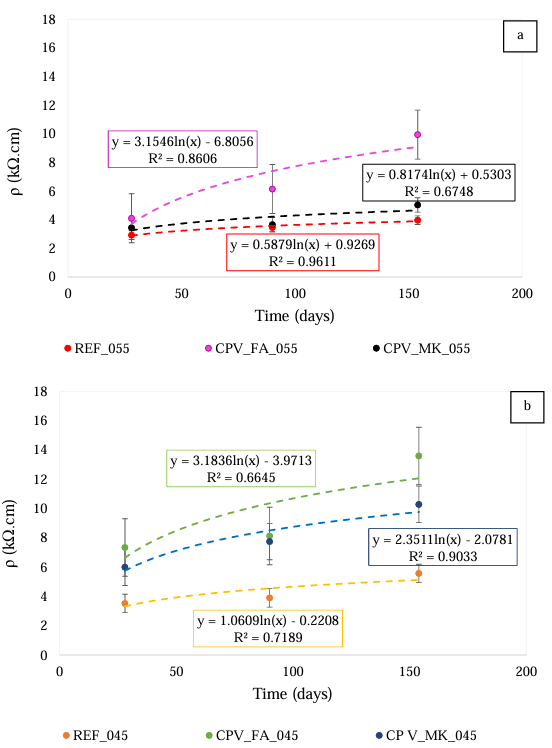
The surface electrical resistivity results for the concretes studied over time are presented in Figure 8. These results are an average of 3 CPs, with 18 measurements in total.
The use of pozzolanic additions in the concrete mixtures resulted in higher resistivities, with logarithmic increase for all concretes (R2 higher than 0.66). Other authors had already discussed the increase of the surface electrical resistivity for concretes with pozzolanic additions (Abreu, 1998; Gans et al., 2017; Medeiros-Junior et al., 2014; Medeiros-Junior e Gans, 2017; Santor et al., 2012). Amongst the main points considered, there are: pore refinement, increase of pore tortuosity, and the reduction of ions in the pore solution. In the specific case of the additions of this work, the first two effects may have been dominant.
Considering mass transport, the total porosity and mainly the pores structure of the matrices are factors that influences the rate of transport of the aggressive agents in the matrix. In Figure 9, the free and total chloride profiles for the mixtures studied are shown. Each profile presents the average values obtained for the 3 CPs.
For the concretes with w/b 0.45, the chloride concentrations (free and total) were lower than for the concretes with w/b 0.55. This result was already expected since the lower void index is related to the lower w/b, indicating specimens with higher compacity, which will result in higher surface electrical resistivity. According to Andrade (2018), the resistivity is related to the capacity of chloride ions transport, and the higher the resistivity, the lower the transport capacity of aggressive agents into the concrete will be.
When comparing the profiles of free and total chlorides, the difference between both can be explained by the chloride binding of the cementitious matrices. According to Luping e Nilsson (1993), the chloride ions present in the cementitious matrix can be free or bound in the matrix (physical or chemically).
In relation to the use of pozzolanic additions in replacement to the cement mass, for concretes with 0.55 w/b, there is a reduction of the free and total chloride concentrations, especially for the CP V_MK concrete. For the 0.45 w/b, there was no reduction in the surface total chloride concentration, especially for the CP V_FA mixture. However, the profiles for the pozzolanic concretes present higher decrease in concentrations over depth, which reflects their lower transport capacity. This behavior results in a lower chloride diffusion coefficient and a lower quantity of chlorides accumulated into the concrete. The higher chloride binding capacity of the mixtures with pozzolanic additions corroborates with the profile results, which can be attributed to the higher alumina concentration Table 3 of the additions used.
Fitting of Equation (1) to experimental data were carried out to obtain the diffusion coefficients and the surface concentrations. The result of this procedure is presented in Table 4 and considers the total chlorides contents.

Figure 8 Results of the electrical resistivity of the studied concretes over time: (a) mixtures with a/agl ratio 0.55 and (b) mixtures with a/agl 0.45.
| Mixture | Cs (% binder mass) | Dns (cm2/s) | R2 | Accumulated total chloride (% binder mass.cm) |
|---|---|---|---|---|
| REF_055 | 3,284 | 1,47E-07 | 0,98 | 3,71 |
| CP V_MK_055 | 2,941 | 1,00E-07 | 0,98 | 2,77 |
| CP V_FA_055 | 2,830 | 1,80E-07 | 0,94 | 3,28 |
| REF_045 | 2,602 | 1,77E-07 | 0,96 | 3,28 |
| CP V_MK_045 | 2,653 | 8,51E-08 | 0,99 | 2,11 |
| CP V_FA_045 | 2,607 | 7,17E-08 | 0,98 | 2,46 |
Evaluating the Cs considering the w/b ration, it is clear that concretes with higher w/b presents higher Cs. According to Meira et al. (2020), Cs tends to increase in more porous concretes. When the concretes with pozzolanic additions are evaluated, the concrete with metakaolin presented the highest Cs to 0.55 w/b and, almost equal to 0.45 w/b, when compared to the concrete with fly ash. This behavior is explained by its higher binding capacity caused by the higher alumina content Table 3.
In relation to the diffusion coefficient, a reduction of Dns is observed for the concretes with pozzolanic additions and 0.45 w/b, when compared to the reference concretes, as seen in Table 4. This behavior is a consequence of the pore refinement and the higher chloride binding capacity of the matrix, and is lightly superior to concretes with metakaolin, resulting in lower Dns for these mixtures, including also the 0.55 w/b mixture.
The binding capacity of chloride ions in the cement matrix is usually expressed as an isotherm. However, this effect can also be evaluated by using the fraction of bound chlorides in the profiles. This relation is presented in Table 5 and corresponds to the relationship between the total bound chlorides and the total accumulated chlorides in each profile. From these results, the higher binding capacity for the concretes with metakaolin is noticeable. The fly ash also increases the binding capacity of the chlorides, especially for the 0.45 w/b mixtures.
Figure 10 presents the relationship between the surface electrical resistivity and the mass transport considering the different concrete mixtures of this work. This relationship can be expressed by Equation (2). According to Andrade, et al. (2014), chloride resistivity and diffusivity relations cab be obtained in a quick manner using the resistivity measurements and Equation (2), where Dns represents the apparent diffusion coefficient, K is a constant which depends on the concentration of solution used, is the apparent resistivity of the concrete and a is an exponent which depends of the chloride binding capacity of the matrix.
Tabela 5 Fraction of bound chlorides for each mixture.
| Mixture | Accumulated total chlorides (% binder mass. cm) | Accumulated combined chlorides (% binder mass. cm) | Fraction of combined chlorides (%) |
|---|---|---|---|
| REF_055 | 3,71 | 1,13 | 30,44 |
| CP V_MK_055 | 2,77 | 0,91 | 32,65 |
| CP V_FA_055 | 3,28 | 0,98 | 29,78 |
| REF_045 | 3,28 | 0,97 | 29,57 |
| CP V_MK_045 | 2,11 | 0,82 | 38,86 |
| CP V_FA_045 | 2,46 | 1,23 | 50,02 |
In Figure 10, the coefficient of determination is relatively low, which may be attributed to the difference between the mixtures and their binding capacities, as well as the fact that the difference among resistivities of the concretes is much lower than that presented in Figure 2. Another approach focused or the relation between chlorides transport oud resistivity is thorough relating the total accumulated chlorides in concrete and its resistivity. This can be seen in Figure 11, which shows a linear relationship between these two variables.
4. Conclusions
From the discussed content, the following conclusions may be pointed out:
Replacements of 10% and 25% of cement, in mass, by metakaolin and fly ash, respectively, were shown to be efficient in retarding the chloride ingress into the concretes and resulting in lower diffusion coefficients and lower chloride accumulation in these matrices. In concretes with lower w/b, these reductions even are more significant.
The increase in the chloride binding capacity of the matrices with additions has an important impact on the reduction of the ionic mass transport.
The effect of the reduction in the w/b ration, in addition to the mineral additions, resulted in concretes with higher surface electrical resistivity, indicating higher resistance to the ionic transport.
The general relationship between Dns and the surface electrical resistivity for the concretes studied can be expressed by Dns = 2,7E-7*ρ -0,475 for Dns in cm²/s and ρ in kΩ.cm. The relationship between the accumulated chlorides in the concretes and their surface electrical resistivity can be expressed by Cl acum = 4,09-0,20945𝜌, for Cl acum in % binder mass. cm and ρ in kΩ.cm.


 texto en


