INTRODUCTION
The common snook Centropomus undecimalis (Bloch 1792) is a commercially important species that is distributed in the Gulf of Mexico. The color and texture of its meat make it a promising candidate for aquaculture (Álvarez-Lajonchére 2001). It is a carnivorous fish, which during its juvenile stage feeds on other fish and crustaceans, which suggests it has a high demand for protein (Blewett et al. 2006). Many fish species have high growth associated with their dietary protein intake, with a maximum requirement that provides them with adequate amino acid content to maximize their growth (Liu et al. 2013, Xia et al. 2015), which is determined by different models, the most common being broken-line regression analysis (Robbins et al. 2006). Therefore, the first parameter to be determined to introduce a new species to aquaculture is the optimal protein requirement (Kim and Lee 2009).
Proteins are involved in many metabolic processes such as the synthesis of enzymes, hormones, neurotransmitters, coenzymes, and cofactors, which plays an important role in growth rate, and constitutes an important energy source in fish (Kpogue et al. 2013); therefore, determining the optimal protein content for an aquaculture diet allows maximizing muscle growth, decreasing production costs and the excretion of nitrogen waste, and improving water quality (Prasad 2014). An insufficient protein level produces low growth, while an excess results in a surplus of amino acids that are used to produce energy, which increases the level of ammonium excretion to the system and causes a poor immune response in fish (Xia et al. 2015). Fish of the genus Centropomus are marine species with the vast majority of them having euryhaline characteristics, along with the ability to inhabit waters in the range of 5 to 35 UPS, and to adapt physiologically to osmoregulation in the short and long term, with a variable energy cost (Sterzelecki et al. 2013). Therefore, the objective of the present study was to determine the optimal dietary protein requirements for Centropomus undecimalis juveniles at two different salinities (5 and 36 UPS) and their effect on growth and survival.
MATERIALS AND METHODS
Obtaining the fish
The juveniles were obtained from the Reproduction Laboratory of the National Autonomous University of Mexico’s Sisal Academic Unit, located in Hunucmá, Yucatán, Mexico. The experiment was carried out in the same facilities and two water recirculation systems were used. The first with a salinity of 36 UPS (MW) and the second with 5 UPS (BW).
Experimental design
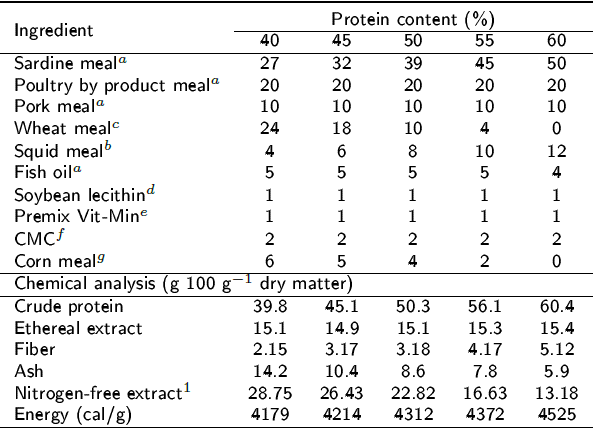
A completely randomized experimental design with five treatments (diets) per salinity, each in triplicate, was used. The isolipidic and isoenergetic diets were formulated with 40, 45, 50, 55 and 60% protein (Table 1). We used a total of 300 juveniles, with average weight of 3.15 ± 0.74 g and average length of 7.17 ± 0.56 cm, which were distributed in groups of 10 fish per experimental unit, with a total of 15 units per system. The experimental units consisted of 30 L cylindrical tanks attached to an open system. To maintain the quality of the water throughout the experiment, two total water replacements were made and constant aeration was maintained. The fish were acclimated to the respective salinities and starved for 48 h so that they would consume the experimental foods. The fish were fed at 8:00, 10:00, 12:00, 14:00 and 16:00 h, in relation to 2.5% of their total biomass. The oxygen concentration in brackish water (BW) was maintained between 6.55 ± 0.23 mg L-1 and in marine water (MW) between 7.4 ± 0.05 mg L-1. The aeration network contained a porous stone, fed with a Boss 9500 air compressor. The temperature was maintained at 28 ± 1 °C with a thermostat in each experimental unit, while the pH was between 7.6 ± 0.3 for BW and 8.2 ± 0.1 for MW, and salinity was monitored every day with a Hach® brand model HQ40d multiparameter system. The photoperiod was 12:12 h light: darkness. The experimental units were cleaned by siphoning three times a day to remove the excreta and food remains.
Tabla 1: Formulation of diets with different protein levels (g 100-1 g dry matter).

aProteínas Marinas y Agropecuarias, S.A. de C.V., Guadalajara, Jalisco, Mexico; bConsorcio Súper S.A. de C.V., Guadalajara, Jalisco, Mexico; cGALMEX Comercializadora de Insumos Agrícolas, Villahermosa, Tabasco, Mexico; dPronat Ultra, Mérida, Yucatán, Mexico;ePedregal (for Silver Cup trout), Toluca, Edo. Mex., Mexico; fSigma-Aldrich catalogue # C4888; gMSA Industrializadora de maíz, Guadalajara, Jalisco, Mexico; 1Nitrogen-free extract: 100-(%proteín-%ethereal extract-%ash-%fiber).
Biometrics were carried out every 15 d, leaving the fish starved 24 h before the measurement. In each biometric measurement, the wet weight and the total individual length of the fish were recorded, for which they were anesthetized with clove oil with one drop per liter of water.
Growth parameters
At the end of the experiment, we determined the absolute weight gain (AWG, g fish-1) = Fw (g) - Iw (g); the specific growth rate (SGR, % d-1) = 100 (ln Fw - ln Iw) / T; Where: Iw and Fw are the initial and final weight of the fish respectively, and T is the number of days in the feeding period. The feed conversion factor (FCF) = dry feed delivered (g) / gain in wet weight (g). Feed intake (FI, g d-1) = (total feed intake per experimental unit / number of rearing days), which represents the feed intake per fish per day on average. The condition factor (K) = (final weight (g)) / standard length (cm)3 X 100. The protein efficiency ratio (PER) = gain in wet weight (g) / protein delivered (g). The daily weight gain (DWG g d-1) = weight gain (mg) / Time (d). The protein intake (PI) = ((feed intake (g d-1) (dietary protein level)) / 100. The daily growth rate (DGR, g d-1) = (final weight1/3 - initial weight1/3) / time (d) and the feed efficiency FE = (final weight - initial weight) / feed intake.
Statistical analysis
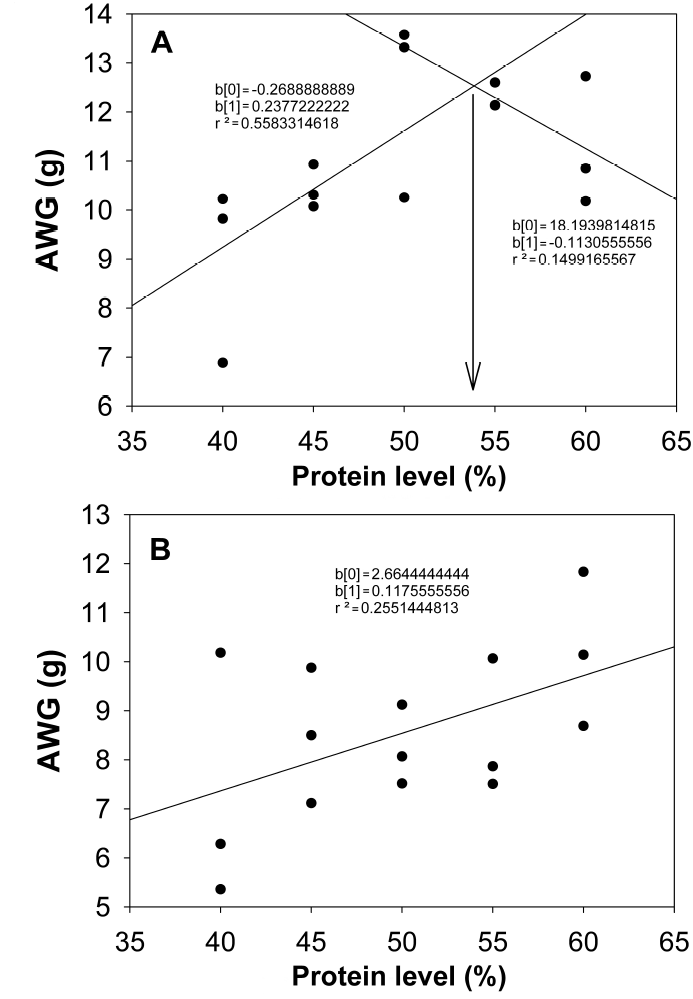
A broken-line analysis was performed by simple linear regression, comparing the weight gain against the protein level of the different diets. The growth data and feed quality indices when complying with the postulates of normality and homoscedasticity were analyzed by means of a one-way ANOVA and the Tukey posteriori test. All analyses were performed at a 95% confidence level with the Statistica 7.0 program.
RESULTS
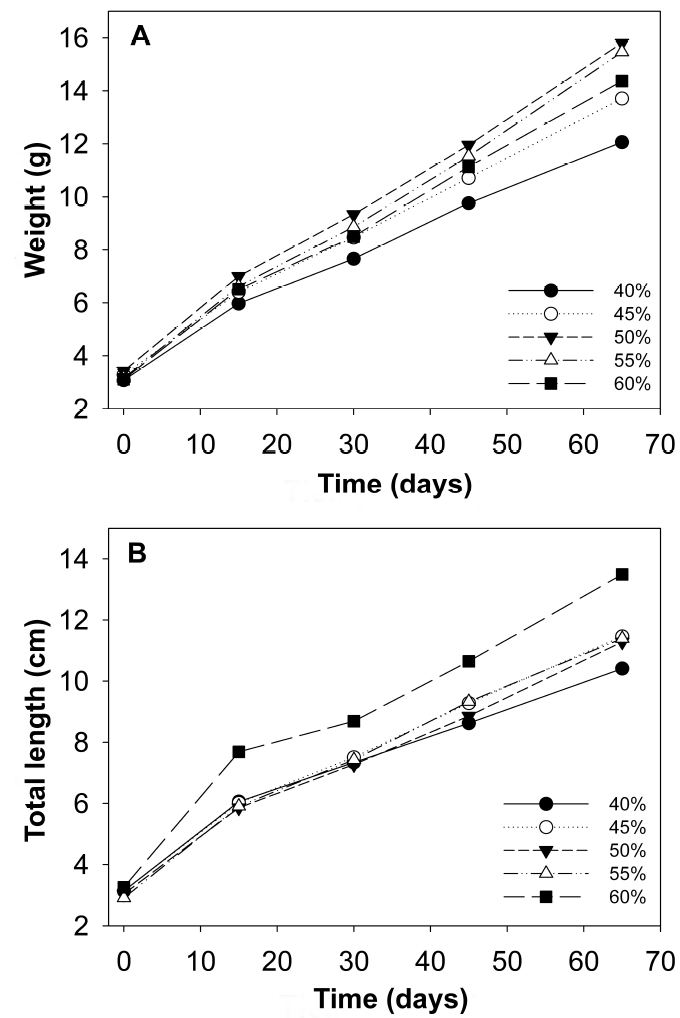
After 65 d of culture there was a 100% survival rate in all treatments evaluated. In marine water, fish fed 50 and 55% protein had the highest average weight and total length, as well as the highest AWG and DWG compared to the other treatments, while fish fed 40% protein obtained the lowest values (p < 0.05). The K values increase as the protein level increases. The highest PER was determined in fish fed 40% protein, which were negatively affected by the protein increase (p < 0.05), while fish fed with 60% protein showed the lowest value in relation to those fed 55% protein. With respect to PI content, the maximum value was found in the fish of the 60% protein treatment and the lowest values with 40% (p < 0.05) PI content. The FCF, SGR, DGR and FE values were statistically higher (p < 0.05) for fish fed with 55% protein, compared to fish fed 50 and 60% protein, respectively; these values are higher than those recorded in fish fed with lower protein levels (Table 2, Figure 1A).

Figura 1: Growth in average weight (g) of C. undecimalis juveniles in marine water (A) and brackish water (B).
A similar trend with respect to the parameters evaluated was obtained in the fish reared in BW, which improved their growth with the increase in protein levels, without showing a definitive optimal requirement. However, the best growths were obtained with fish fed with 60% protein (Figure 1B). The weight and total length averages showed significant differences (p < 0.05) between fish fed with 60% protein, with respect to the other PI contents (p < 0.05). The FCF showed differences between fish fed with the 40% protein diet and those with 55 and 60%, while fish fed with 60% PI content had the highest value (7.33 ± 0.28 g d-1) when compared to the rest of the protein levels (p < 0.05) (Figure 2). The highest PER values were observed in fish fed with 40% protein and the lowest with 60% (p < 0.05). On the other hand, SGR, FE and K showed an increase in fish fed 60% protein (Table 3).

Figura 2: Broken-line analysis of growth in C. undecimalis juveniles in marine water (A) and brackish water (B).
DISCUSSION
The species Centropomus undecimalis has a well-developed stomach, with large numbers of branched gastric glands and oxynthic glands, which is related to a greater capacity to digest proteins of animal origin (Fragoso-Machado et al. 2013). Protein, being one of the most expensive and important nutrients in the formulation of fish diets, needs to be properly determined in the feed to improve growth, reduce ammonia excretion and decrease production costs (Xia et al. 2015). According to Concha-Frías et al. (2016), digestion of proteins starts in the stomach, which has an acidic environment, through the action of pepsin and continues in the intestine in an alkaline environment where greater trypsin activity is observed (Blewett et al. 2006). This implies a very high protein requirement for saline environments, so it is essential that the diet formulation include high-protein ingredients. Considering the above, when ingredients of high protein value are used due to the digestive physiology of the fish, the synthesis of trypsinogens and the secretion of trypsin from the pancreas are regulated in the lumen of the digestive tract (García-Meilán et al. 2013), which participates in the degradation of proteins and the release of amino acids (Al-Saraji and Nasir 2013), which are absorbed in the intestinal tract and transported to the bloodstream to be distributed to various tissues where they perform various functions (Kpogue et al. 2013). After 65 d of feeding, there were no mortalities in the MW and BW treatments, which indicate that even the 40% protein level provides enough dietary protein to maintain C. undecimalis juveniles, but their growth was affected.
The results in MW indicate that the increase in dietary protein levels produces an increase in average weight and final length, FCF, AWG, DWG, and K until reaching maximum values with the 50% protein diet, with a direct correlation between growth and the amount of protein in the diet, which has been reported for various fish species (Santigosa et al. 2011a, Prasad 2014), while an excess of proteins in the diet can stimulate increased trypsin production, which increases both satiety and energy costs used for ammonia excretion. Therefore, an increase in protein catabolism reduces the use of other nutrients (carbohydrates and lipids) as an energy source, due to deamination, which causes greater feed intake and low protein utilization (Morgane and Fountoulaki 2014), while a greater release of amino acids causes a greater concentration of ammonia in the plasma, which can be toxic (Ozório et al. 2009), and reduces growth (Mohseni et al. 2013) and PER, as has been seen in the leopard coral grouper (Plectropomus leopardus, Lacepede, 1802) and the Yellow catfish (Horabargus brachysoma, Günther, 1864) (Prasad 2014, Xia et al. 2015). In this same aspect, the high PER values in diets with low protein percentages are usually due to the u-pregulation of amino acid transport as a response to the compensation for a nutritional deficit in the diet (Santigosa et al. 2011a, b). Therefore, fish regulate their protein consumption voluntarily to meet their nutritional requirements, by increasing the intake to compensate for the energy deficiency (Kpogue et al. 2013), although they can also modify the gastric evacuation time as in C. undecimalis (García-Galano et al. 2003), so a low protein level in the diet causes reduced growth and a low immune response (Morgane and Fountoulaki 2014).
The FI values were similar to those reported by Deng et al. (2013) in juvenile of Kanglang fish (Anabarilius grahami, Regan 1908) so the increase in feed intake is directly proportional to the protein level, which explains the decrease in voracity to meet their energy needs (Mohseni et al. 2013). From the treatment with 50% protein, the FI values decrease, which can be attributed to an excess of protein, which causes the decrease in growth; this was reported in other species by Mohseni et al. (2013), García-Meilán et al. (2013) and Liu et al. (2013), who conclude that an excess or deficit of protein in the diet limits the energy derived to maintain adequate growth in fish.
Based on the broken-line model, it can be seen that the optimal protein requirement in marine water for C. undecimalis is 54% protein, which has already been reported for other carnivorous marine species such as common dentex (Dentex dentex Linnaeus 1758), gilthead seabream (Sparus aurata Linnaeus 1758), European seabass (Dicentrarchus labrax Linnaeus 1758), pike silverside (Menidia estor Jordan 1880), African catfish (Heterobranchus bidorsalis Geoffroy Saint-Hilaire 1809) x mudfish (Clarias anguillaris Linnaeus 1758), meagre (Argyrosomus regius Asso 1801), Senegal sole (Solea senegalensis Kaup 1858), shi drum (Umbrina cirrosa Linnaeus 1758) and P. leopardus (Morgane and Fountoulaki 2014, Xia et al. 2015).
In brackish water treatments, growth indices increased with increasing protein levels, without showing a decrease in values for fish fed 60% protein. In this growth stage, fish tend to migrate to euryhaline environments, so they are expected to have greater growth than those reared in marine water; however, the lower growth of the fish in brackish water may be due to the fact that the energy from the protein was used in osmoregulation processes (Gracia-López et al. 2006). This is related to the increased oxygen requirement in the muscle, so that lactate levels rise and affect energy production capacity at the cellular level (Pérez-Pinzón and Lutz 1991). Moreover, Sterzelecki et al. (2013), in a study conducted in juvenile fat snook (Centropomus parallelus Poey 1860), found that prolonged exposure (60 d) to low salinities (5 UPS) has no effect on the weight and length of juveniles when moving to high salinities (35 UPS), while the energy expenditure caused by the osmoregulation process can be regulated with the addition of minerals in the diet which has been tested in D. labrax, S. aurata, barramundi (Lates calcarifer Bloch 1790), black seabass (Centropristis striata Linnaeus 1758), and tilapia shiranus (Oreochromis shiranus Boulenger 1897) (Arockiaraj and Appelbaum 2010). However, to achieve a decrease in the physiological cost due to osmoregulation, it is necessary to evaluate the optimal concentration of minerals in the diet, specifically for fish reared in low-salinity water (Alam et al. 2015, Mzengereza and Kang’ombe 2015).
The specific growth rate is the parameter most used to correlate the optimal protein level in the diet, which is determined by the broken-line model, which helps determine the appropriate protein level in the fish diet (Robbins et al. 2006, Kpogue et al. 2013). By optimizing the protein level, the biological and productive costs of the species are improved; most studies show that marine fish species with carnivorous habits require an optimal protein level of between 40 and 55%, compared to those of omnivorous habitats (El-Dahhar et al. 2011), which has been determined in species such as the silver pumfret (Pampus argenteus Euphrasen 1788) (Arshad-Hossain et al. 2011), yellow snapper (Lutjanus argentiventris Peters 1869), Great snakehead (Channa marulius Hamilton 1822) (Maldonado-García et al. 2012, Raizada et al. 2012) and the fine flounder (Paralichthys adspersus Steindachner 1867) (Kpogue et al. 2013).
CONCLUSIONS
C. undecimalis juveniles in marine water require a 54% protein content diet, while in brackish water they require more than 60% protein, possibly due to the greater energy need to compensate, with osmoregulation processes, for the effect of low salinity. Rearing C. undecimalis in both environments is possible, although the dietary protein requirement is high for the species, which indicates the need to include at least 55% high-quality protein in balanced feed.


 nueva página del texto (beta)


