1. Introduction1 3 4 5 6 7 Fig. 1 8 13 14 18 19 20 21 22 23 24
2. Experiment
where (Re = La, Ce, Nd, Gd, Dy, Y) and (Tm = Fe, Cr). Nucleation is responsible for the formation of grains. In our case transition metal ions act as seed crystal and responsible of nucleation during the sol-gel process. The stoichiometric ratio of rare earth and transition metal ions is equal, so more nucleation was observed in synthesis process that is responsible to nanocrystals formation. The phase identification was carried out using Bruker D8 advance X-ray diffractometer equipped with Cu-K
(5)3.1. Structural and morphological Properties
Figure 2 shows the X-ray diffraction pattern of a representative sample LaFeO3 among the prepared samples analyzed by using Rietveld refinement technique considering orthorhombic structure with Pbnm space group. The pseudo-Voigt function was used to perform fitting of diffraction peaks by using the JANA2006 software. A good fitting has been clearly seen between observed and refined XRD data, as all the peaks are well overlapped with fitted data, which confirm single phase has been successfully formed and no impurity peak has been observed. All samples of ReTmO3 (Re = La, Nd, Gd, Dy, Y and Tm = Fe, Cr) were fitted by JANA2006 (not shown here). Figure 3(a) shows the XRD spectra of polycrystalline ReTmO3. The diffraction peaks are narrow and sharp, which reflects the high crystalline nature of the prepared samples. The diffraction pattern of ReTmO3 (Re = La, Nd, Gd, Dy, Y and Tm = Fe, Cr), suggest orthorhombic perovskite structure with space group pbnm (No. 62). The XRD pattern of polycrystalline Ce(Fe,Cr)O3, where a couple of secondary phases are present as shown in Fig. 3(b). Thus single phase Ce(Fe,Cr)O3 could not be obtained by sol-gel combustion method. The calculated lattice parameters (a, b, c), unit cell volume (V), and data collected about miller indices (hkl) of lattice planes of as prepared ReTmO3 (Re = La, Nd, Gd, Dy, Y and Tm = Fe, Cr), are tabulated in Table I. It is clearly shown that, in all cases,
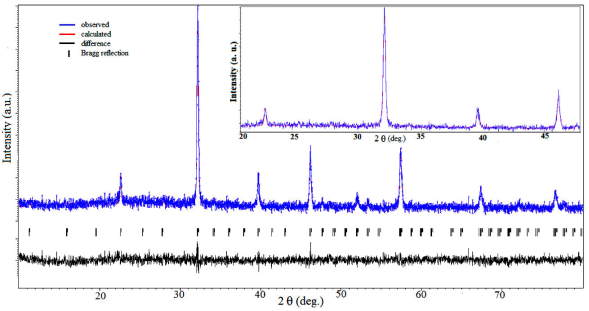
FIGURE 2 (color online) Rietveld refinement of the XRD pattern by using the JANA2006 program of representative sample LaFeO3. Inset shows zoom region of the fit of calculated curve on observed curve.
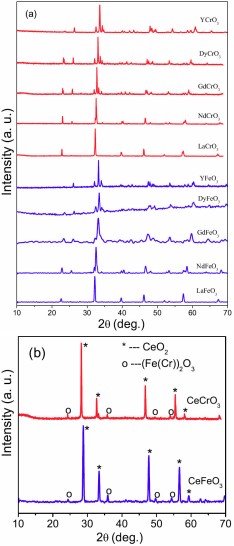
FIGURE 3 XRD pattern of (a) ReTmO3 (Re = La, Nd, Gd, Dy, Y and Tm = Fe, Cr) and (b) Ce(Fe,Cr)O3. The asterisks on the peaks show the cerium dioxide (CeO2) phase and circles on the peaks show. Iron(III) oxide or ferric oxide (Fe2O3) and Chromium(III) oxide (Cr2O3).
TABLE I Summary of XRD refined data of ReTmO3 (Re = La, Nd, Gd, Dy, Y and Tm = Fe, Cr). Where S.C (Sample Code), C.F (Chemical Formula), F.W (Formula Weight), C.S (Crystal Structure), S.G (Space Group), D.C (Data Collected).
| S.C | LF(C)O | NF(C)O | GF(C)O | DF(C)O | YF(C)O |
| C.F | LaFe(Cr)O3 | NdFe(Cr)O3 | GdFe(Cr)O3 | DyFe(Cr)O3 | YFe(Cr)O3 |
| a(Å) | 5.55 (5.48) | 5.45 (5.42) | 5.35 (5.31) | 5.30 (5.262) | 5.28 (5.24) |
| b(Å) | 5.56 (5.51) | 5.58 (5.48) | 5.62 (5.52) | 5.60 (5.50) | 5.59 (5.51) |
| c(Å) | 7.87 (7.76) | 7.77 (7.69) | 7.67 (7.60) | 7.62 (7.55) | 7.60 (7.53) |
| V(Å3) | 243.0 (234.3) | 236.5 (228.6) | 230.2 (222.6) | 226.3 (262.5) | 224.8 (217.4) |
| F.W | 242.7 (238.9) | 248.1 (244.2) | 261.1 (257.2) | 266.3 (262.5) | 192.7 (188.9) |
| Z | 4 | 4 | 4 | 4 | 4 |
| C.S | Orthorhombic | Orthorhombic | Orthorhombic | Orthorhombic | Orthorhombic |
| S.G | Pbnm | Pbnm | Pbnm | Pbnm | Pbnm |
| S.G | 62 | 62 | 62 | 62 | 62 |
| D.C | 0≤h≤4 0≤k≤4 0≤1≤6 | 0≤h≤4 0≤k≤5(4) 0≤1≤6 | 0≤h≤4 0≤k≤5(4) 0≤1≤6 | 0≤h≤4 0≤k≤5(4) 0≤1≤6 | 0≤h≤4 0≤k≤5(4) 0≤1≤6 |
The values of average grain size of ReTmO3, which was calculated by using the well known Scherrer’s formula [
In nanomaterials lattice strain and grain size both have their self contribution to peak broadening of X-ray diffraction and lattice strain is to be contributed in peak broadening due to large volume of grain boundaries26,27. In order to measure the grain size precisely, the lattice strain calculations are very important28. Hence, the Williamson-Hall (W-H) method was used for estimating the lattice strain and grain size29,30. In addition, lattice strain and grain size independently contribute to the total peak broadening. The peak broadening induced by strain (
Rearranging Eq. (3) gives:
where k is the shape factor and D is the grain size. A graph is plotted by taking
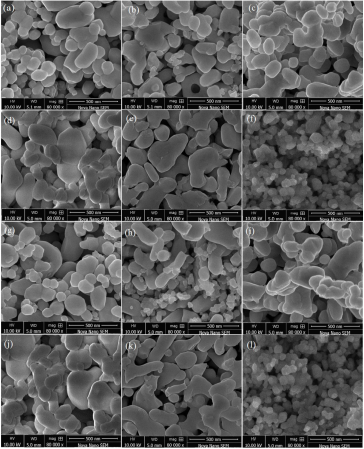
FIGURE 5 SEM images of perovskite (a) LaCrO3 (b) NdCrO3 (c) GdCrO3 (d) DyCrO3 (e) YCrO3 (f) CeCrO3 (g) LaFeO3 (h) NdFeO3 (i) GdFeO3 (j) DyFeO3 (k) YFeO3 and (l) CeFeO3.
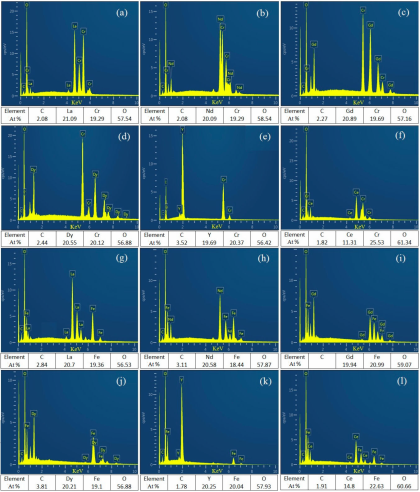
FIGURE 6 EDX images of perovskite (a) LaCrO3 (b) NdCrO3 (c) GdCrO3 (d) DyCrO3 (e) YCrO3 (f) CeCrO3 (g) LaFeO3 (h) NdFeO3 (i) GdFeO3 (j) DyFeO3 (k) YFeO3 and (l) CeFeO3.
The variation in lattice parameters (
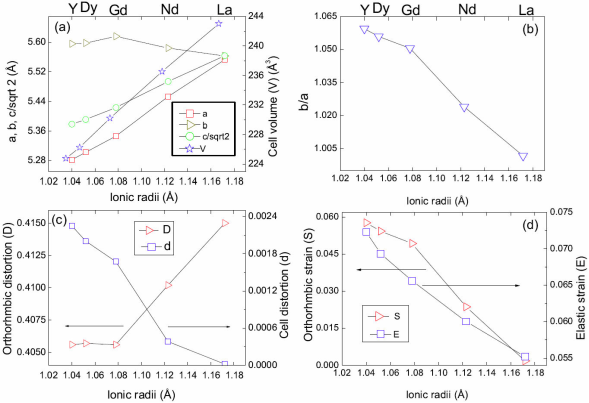
FIGURE 7 Variation of (a) lattice parameters (a; b; c= √2) and cell volume V. (b) Orthorhombicity factor (b/a). (c) Orthorhombic distortion (D) and cell distortion (d). (d) Orthorhombic strain (S) and Elastic strain (E) with ionic radius of Re-site.
The orthorhombic factor (b/a) sharply increases, with decreasing ionic radius of Re site in ReFeO3, as shown in the Fig. 7(b). Similar trend is also obtained for ReCrO3, not shown here. To study the structural distortion, cell distortion (d) [32] was calculated as,
where
TABLE II Crystallographic characteristics of ReFeO3 (Re = La, Nd, Gd, Dy, Y).
| Sample Code | LFO | NFO | GFO | DFO | YFO |
| Chemical formula | LaFeO3 | NdFeO3 | GdFeO3 | DyFeO3 | YFeO3 |
| Orthorhombic distortion (D) | 0.4150 | 0.4102 | 0.4056 | 0.4057 | 0.4056 |
| Cell distortion (d) x10-6 | 3 | 386 | 1673 | 2005 | 2252 |
| Orthorhombic strain (S) | 0.0018 | 0.0237 | 0.0493 | 0.0543 | 0.0577 |
| Elastic strain (E) | 0.0552 | 0.0600 | 0.0656 | 0.0693 | 0.0723 |
| Grain size (nm)(Scherrer formula) | 52.38 | 39.00 | 31.62 | 27.78 | 25.48 |
| Grain size (nm)(W-H analysis) | 67.56 | 60.52 | 47.38 | 40.29 | 35.77 |
| BET surface area (m2/g) | 17.26 | 22.08 | 25.18 | 27.61 | 41.32 |
| X-ray density (dx-ray) (g/cm3) | 6.64 | 6.97 | 7.54 | 7.82 | 5.70 |
| Bulk density (d bulk ) (g/cm3) | 5.20 | 5.43 | 5.92 | 6.11 | 3.32 |
| Porosity(P) | 0.2163 | 0.2212 | 0.2147 | 0.2193 | 0.4178 |
TABLE III Crystallographic characteristics of ReCrO3 (Re = La, Nd, Gd, Dy, Y).
| Sample Code | LCO | NCO | GCO | DCO | YCO |
| Chemical formula | LaCrO3 | NdCrO3 | GdCrO3 | DyCrO3 | YCrO3 |
| Orthorhombic distortion (D) | 0.0047 | 0.0071 | 0.0272 | 0.0323 | 0.0358 |
| Cell distortion (d) x10-6 | 30 | 60 | 940 | 1320 | 1620 |
| Orthorhombic strain (S) | 0.0062 | 0.0097 | 0.0375 | 0.0446 | 0.0493 |
| Elastic strain (E) | 0.0599 | 0.0653 | 0.0708 | 0.0749 | 0.0766 |
| Grain size (nm)(Scherrer formula) | 55.00 | 41.62 | 38.82 | 36.89 | 33.79 |
| Grain size (nm)(W-H analysis) | 72.30 | 67.60 | 53.52 | 44.29 | 41.47 |
| BET surface area (m2/g) | 16.05 | 20.32 | 20.14 | 20.38 | 30.77 |
| X-ray density (dx-ray) (g/cm3) | 6.78 | 7.09 | 7.68 | 7.98 | 5.77 |
| Bulk density (d bulk ) (g/cm3) | 5.05 | 5.28 | 5.77 | 5.96 | 3.17 |
| Porosity(P) | 0.2545 | 0.2565 | 0.2488 | 0.2537 | 0.4514 |
Orthorhombic distortion (D), which is defined as the ratio of standard deviation to average of the lattice parameters is calculated as33,
where

FIGURE 7 Variation of (a) lattice parameters (a; b; c=√2) and cell volume V. (b) Orthorhombicity factor (b/a). (c) Orthorhombic distortion (D) and cell distortion (d). (d) Orthorhombic strain (S) and Elastic strain (E) with ionic radius of Re-site.
where M the molar mass, Z is the number of molecules per formula unit (4 for the orthorhombic structure), N
A
Avogadro s number (
where 𝑚 is the mass and 𝑉 =
where
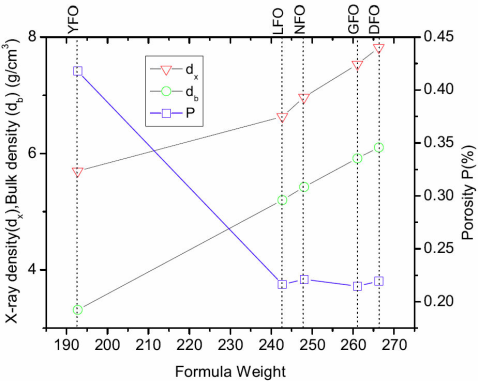
FIGURE 8 Variation in x-ray density (dx), bulk density (db) and porosity (P) with variation of the formula weight of ReFeO3 (Re = Y, La, Nd, Gd, Dy).
The Brunauer-Emmett-Teller (BET) specific surface areas of ReTmO3 (Re = La, Nd, Gd, Dy, Y and Tm = Fe, Cr) nanoparticles are measured by the BET relation of the form,
where D is the orthorhombic distortion and
3.2. Optical Properties
The obtained UV-visible diffuse reflectance spectra (DRS) of 𝑅𝑒FeO 3 and 𝑅𝑒CrO 3 (Re = La, Ce, Nd, Gd, Dy, Y) were measured by using UV/VIS/NIR spectrophotometer and are shown in Fig. 9(a) and (b), respectively. The absorbance spectrum of ReFeO3 and ReCrO3 is obtained from their reflectance spectrum according to the Kubelka-Munk theory38. Moreover, optical energy band gap of ReFeO3 and ReCrO3 (Re = La, Ce, Nd, Gd, Dy, Y) is estimated by using the Tauc relation39.
where
4.Conclusion
The sol-gel auto combustion citrate method is successfully used for the synthesis of polycrystalline ReTmO3 (Re = La, Nd, Gd, Dy, Y and Tm = Fe, Cr) and single phase character has been confirmed by XRD patterns. A systematic increase in grain size with increasing r


 nueva página del texto (beta)


