1. Introduction
The ROTSE-I survey for variable stars (Akerlof et al. 2000) has identified nearly 2000 new variables. Among them is ROTSE1 J164341.65+251748.1 (hereinafter J1643+2517), reported by these authors as a variable source with a V magnitude of around 14.2, varying with an amplitude of 0.69 mag and a periodicity of 0.32343200 days. No further information was given about the nature of its variability. While conducting a spectroscopic and photometric study in the V band on AH Herculis, J1643+2517 was detected as a serendipitous source in the field. Our extensive photometric coverage revealed that J1643+2517 has the typical light curve of W UMa-type systems.
Since the pioneer work by Lucy (1968) on contact stars, it is now well established that W UMa-type systems are over-contact binary stars, which consist of two late type main sequence stars sharing a common connecting envelope (Rucinski 2010). There is a considerable number of publications about this kind of objects, both observational and theoretical, since the early work by Eggen (1961), who recognized that binaries with orbital periods of less than a day and with continuous light variations could be considered stars in full contact. Among these studies are the reviews published by Rucinski (1993) and Eggleton (1996). In this paper, based on the obtained V light curves of J1643+2517, we determine the most important parameters of the system.
2. Observations and data reduction
CCD observations were made during three observing runs, with the 0.84-m f/15 Ritchey-Chrétien telescope at Observatorio Astronómico Nacional at Sierra San Pedro Mártir (OAN-SPM), the Mex-man filter-wheel, and the ESOPO CCD detector (e2v CCD42-90), which has a 2048x4608 13.5 μm square pixel array, a gain of 1.7 e-/ADU, and a readout noise of 3.8 e-. A 2x2 binning was used during our observations. The combination of the telescope and detector characteristics ensured an unvignetted field of view of 7.4' x 9.3'. Since the observations were obtained with AH Her as the primary target, we obtained mainly V photometry. During our last run we made BVR photometry, basically to obtain sufficient information to derive the spectral type of the primary. The log of the observations is shown in Table 1. Sky flats and bias exposures were also taken each night.
Table 1 Log of photometric observations of j1643+2517.
| Date | Filter | Exp. Time | Images | Obs. Time |
|---|---|---|---|---|
| yyyymmdd | (secs) | (hours) | ||
| 20130530 | V | 30 | 439 | 4.85 |
| 20130531 | V | 30 | 709 | 8.27 |
| 20130601 | V | 30 | 263 | 2.93 |
| 20130602 | V | 30 | 683 | 7.87 |
| 20130603 | V | 30 | 376 | 4.57 |
| 20130604 | V | 30 | 281 | 3.65 |
| 20130605 | V | 30 | 340 | 4.57 |
| 20130606 | V | 30 | 267 | 2.90 |
| 20130607 | V | 30 | 223 | 2.42 |
| 20130613 | V | 30 | 603 | 7.19 |
| 20130614 | V | 30 | 479 | 7.03 |
| 20130617 | V | 30 | 574 | 6.64 |
| 20130618 | V | 30 | 373 | 4.52 |
| 20140214 | V | 180 | 43 | 3.25 |
| 20140215 | V | 180 | 28 | 2.30 |
| 20140216 | V | 60 | 42 | 1.526 |
| 20140220 | V | 120 | 17 | 0.64 |
| 20140308 | V | 20 | 532 | 4.66 |
| 20140312 | V | 20 | 475 | 4.86 |
| 20140519 | V | 60 | 208 | 4.26 |
| 20140520 | V | 20 | 210 | 1.80 |
| 20150630 | V | 30 | 264 | 3.33 |
| 20150702 | B,V,R | 30,20,15 | 106,106,106 | 4.47 |
| 20150703 | B,V,R | 30,20,15 | 47,47,47 | 3.13 |
| 20150729 | B,V,R | 30,20,15 | 151,151,151 | 5.79 |
| 20150730 | B,V,R | 30,20,15 | 51,51,51 | 2.01 |
All CCD images were processed using the IRAF1 package. Images were bias subtracted and flat field corrected and then cosmic rays were removed with the help of the L.A. Cosmic2 script. Then, the instrumental magnitudes of the stars were computed using the standard aperture photometry method.
During an observing run of UBVRI photometry of Galactic stellar clusters this field (Figure 1) was included in the list of targets, so that its stars could be calibrated in the Johnson-Cousins system. The results are presented in Table 2. Although dimmer than other stars in the field, star number 12 was used as the comparison star to obtain the differential photometry, since it has a similar colour to J1643+2517.
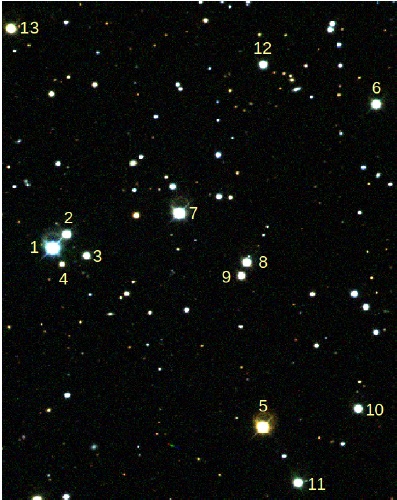
Fig. 1 Observed field. The numbered stars are calibrated photometrically and are shown in Table 2. J1643+2517 is star number 6 while AH Her is star number 1. The comparison star used is number 12.
Table 2 UBV RI photometry of the field stars*
| ID | RA | DEC | U | B | V | R | I | eU | eB | eV | eR | eI | Name | B0 | V0 |
|---|---|---|---|---|---|---|---|---|---|---|---|---|---|---|---|
| 1 | 251.04172 | +25.25060 | 11.517 | 12.354 | 12.297 | 12.143 | 11.954 | 0.001 | 0.003 | 0.002 | 0.004 | 0.007 | V*AHHer | ||
| 2 | 251.03647 | +25.25510 | 14.788 | 14.747 | 14.139 | 13.769 | 13.408 | 0.002 | 0.007 | 0.001 | 0.002 | 0.005 | [HH95]AHHer-27 | 14.800 | 14.187 |
| 3 | 251.02930 | +25.24806 | 16.202 | 15.815 | 15.058 | 14.621 | 14.238 | 0.004 | 0.005 | 0.002 | 0.002 | 0.009 | [HH95]AHHer-26 | 15.892 | 15.117 |
| 4 | 251.03827 | +25.24531 | 18.520 | 17.322 | 16.164 | 15.442 | 14.843 | 0.012 | 0.012 | 0.002 | 0.007 | 0.008 | [HH95]AHHer-25 | 17.429 | 16.205 |
| 5 | 250.96619 | +25.19135 | 15.274 | 13.851 | 12.532 | 11.831 | 11.194 | 0.003 | 0.004 | 0.002 | 0.003 | 0.004 | 2MASSJ16435186+251128 | ||
| 6 | 250.92379 | +25.29666 | 14.573 | 14.432 | 13.784 | 13.380 | 13.024 | 0.016 | 0.004 | 0.001 | 0.003 | 0.010 | J1643+2517 | ||
| 7 | 250.99569 | +25.26163 | 13.117 | 13.184 | 12.670 | 12.369 | 12.059 | 0.002 | 0.003 | 0.002 | 0.004 | 0.004 | 2MASSJ16435895+2515418 | ||
| 8 | 250.99569 | +25.24536 | 14.762 | 14.749 | 14.079 | 13.654 | 13.224 | 0.002 | 0.007 | 0.002 | 0.002 | 0.007 | [HH95]AHHer-21 | 14.721 | 14.035 |
| 9 | 250.97337 | +25.24101 | 15.990 | 15.580 | 14.720 | 14.234 | 13.751 | 0.001 | 0.007 | 0.002 | 0.003 | 0.006 | [HH95]AHHer-22 | 15.565 | 14.688 |
| 10 | 250.93149 | +25.19695 | 15.181 | 15.029 | 14.417 | 14.040 | 13.696 | 0.001 | 0.006 | 0.002 | 0.004 | 0.005 | 2MASSJ16434356+2511489 | ||
| 11 | 250.95348 | +25.17302 | 14.700 | 14.627 | 14.022 | 13.605 | 13.243 | 0.005 | 0.011 | 0.004 | 0.003 | 0.009 | [HH95]AHHer-18 | 14.592 | 13.938 |
| 12 | 250.96468 | +25.31011 | 15.299 | 15.243 | 14.602 | 14.201 | 13.836 | 0.006 | 0.009 | 0.003 | 0.005 | 0.011 | [HH95]AHHer-33 | 15.226 | 14.560 |
| 13 | 251.05568 | +25.32264 | 15.771 | 14.723 | 13.665 | 13.079 | 12.618 | 0.006 | 0.011 | 0.003 | 0.010 | 0.001 | [HH95]AHHer-2 | 14.714 | 13.645 |
*The values in the last two columns are those found in the literature.
3. Photometric analysis
The orbital period of the light curve was derived from a frequency search algorithm, using the Peranso program (Vanmuster 2014). The derived period was P = 0.323456 ± 0.000024 days. The following ephemeris has been obtained:
where phase zero is defined by the lower of the two minima, corresponding in this case, to the inferior conjunction of the primary star. This definition follows the convention that the deeper minimum of the light curve is defined as the primary minimum (e.g. Binnedijk 1984). Therefore, the primary maximum occurs at phase 0.25. The parentheses indicate the error in the previous digit. Using this ephemeris, we obtain the phased light curve of J1643+2517 shown in Figure 2. The figure shows our three observing runs. In order to identify the observing time sequence, we have included a colour bar in which the labels of the ticks are HJD days and show the date, starting from 2456443.
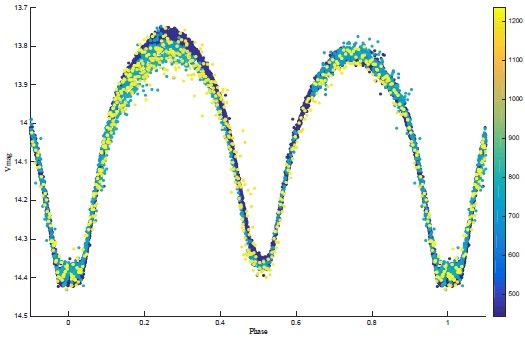
Fig. 2 Phase diagram of the V photometry of J1643+2517 (see text for the colour code). Notice that there is a clear distinction between the primary and secondary eclipses and that the primary's maxima (phase 0.25) show much larger variations than the secondary maxima (phase 0.75). The color figure can be viewed online.
4. Spectral type of the primary star
From the photometry obtained at phase zero, we found colours B - V = 0.64 and V - R = 0.43. The B - V index indicates a G2V star, while the V - R index suggests a later spectral type of G9V. Thus the system appears to have a small extinction. We adopted a G0V spectral type to reconcile these indices and an initial temperature of 5900 K. This spectral type and temperature are important, as we said, in the sense that they provide initial values for modeling the binary.
5. Modeling the binary
A preliminary solution of the phased light curve was obtained by Fox Machado et al. (2015a) with the PHOEBE package (Prsa & Zwitter 2005), following the strategy explained in Fox Machado et al. (2015b). PHOEBE is an interactive software package for modeling eclipsing binary stars based on the Wilson-Devinney code (WDc) (Wilson & Devinney (1971); Wilson (1990, 1994)). It permits the creation of a synthetic light curve that fits the observational data by adjusting interactively the orbital and stellar parameters through a user friendly graphical interface. The preliminary results from Fox Machado et al. (2015a) were used in the present paper as a starting solution for the latest version of the WDc code (Wilson & Van Hamme 2014) available in 2015 in the electronic link ftp://ftp.astro.ufl.edu/pub/wilson/lcdc2015/.
A final solution was then achieved using this new code. Some insights about the morphology of the binary system can be obtained from the shape of the light curve. Since there is a total eclipse of the secondary star by the primary star, a flat bottom at the primary minimum is seen. indicating a high inclination angle of the system. The primary and secondary eclipses occur at 0.5 phase intervals, with no clear beginning and end of the eclipses, suggesting a circular orbit. These properties are consistent with a short period over-contact binary of the W UMa type. The lower minima appear at the primary minimum when the secondary star is covered by the primary star at around phase zero (see § 3). In this case, we obtain a lower effective temperature of the more massive star. The different magnitudes of two maxima in the light curve are known as the O'Connell effect, after first being recognized by O'Connell (1951).
During all the observations of J1643+2517 the primary maxima showed strong variations, with the profile of the light curve changing on a time scale larger than a day. The secondary maxima were much more stable, particularly during the third run. To model all of these variations, we found that the best solution was one with two hot spots on the primary star. Since we cannot make a uniform model for the light curves, we separated the data into the three observed epochs in order to perform independent analyses.
Some of the parameters of the contact binary model could be fixed or well estimated. The thermal albedo A1 = A2 = 0.5 (Lucy 1967) and the gravitational constant g1 = g2 =0.32 (Rucinski 1969) were assumed fixed by the convective envelope of both stars, and the limb darkening was automatically interpolated by the WDc from the van Hamme (1993) table. Based on the BVR observations (see § 4), the spectral class could be estimated as close to GOV, giving an initial temperature of the primary of ≈ 5700 K.
As the standard to build the model for this system, we used the 2013 data, which had the best photometric quality. A q-search strategy was applied to find the mass ratio of the system (Figure 4). The best fitted parameters of the simulation are listed in Table 4, and comparisons between simulations and observations are displayed in Figure 5.
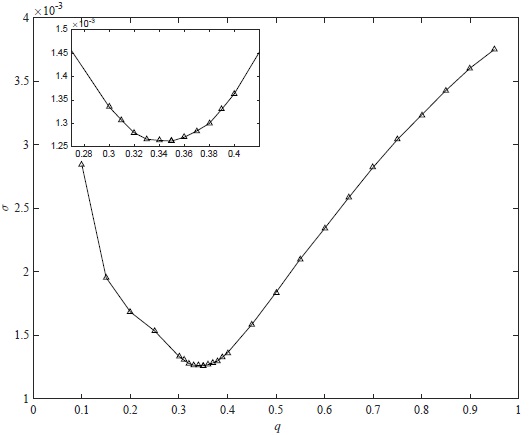
Fig. 4 The q-search strategy for the mass ratio determination. The mass ratio at minimum σ is at around 0.35.
Table 3 Spots parameters for the data of each part*
| Parameter | Spot 1 | Spot 2 |
|---|---|---|
| Epoch1 | ||
| Colatitude (deg) | 68.0 ± 1.3 | 75.0 ± 1.4 |
| Longitude (deg) | 112.00 ± 0.02 | 16.00 ± 0.02 |
| Radius (deg) | 22.0 ± 4.7 | 30.0 ± 1.4 |
| Temp. factor | 1.07 ± 0.012 | 1.0500 ± 0.002 |
| Epoch 2 | ||
| Colatitude (deg) | 55.0 ± 0.52 | 85.0 ± 1.46 |
| Longitude (deg) | 155.00 ± 0.016 | 22.01 ± 0.02 |
| Radius (deg) | 21.0 ± 2.7 | 19.0 ± 1.1 |
| Temp. factor | 1.06 ± 0.022 | 1.0500 ± 0.015 |
| Epoch3 | ||
| Colatitude (deg) | 60.0 ± 9.4 | |
| Longitude (deg) | 34.90 ± 0.16 | |
| Radius (deg) | 28.1 ± 9.48 | |
| Temp. factor | 1.026 ± 0.002 | |
*The spots are all on the primary star. There is only one significant spot on the system for the third data part.
Table 4 Light-curve parameters of J1643+2517 at 2013.06.01*
| Parameter | Primary | Secondary |
|---|---|---|
| HJDo | 2456443.5675±0.0009 | |
| Porb (day) | 0.3234561±0.0000004 | |
| incl | 84.35 ±0.31 | |
| q=m2 / ml | 0.3425 ±0.0014 | |
| Ω= Ω1 = Ω2 | 2.520 ±0.005 | |
| T (K) | 5648a | 5873± 7 |
| G1 = g2 | 0.32a | |
| Al = A2 | 0.5a | |
| xl(bolo) = x2(bolo) | 0.646a | |
| yl(bolo) = y2(bolo) | 0.212a | |
| xlv = x2v | 0.749a | |
| ylv = y2v | 0.209a | |
| L/(L1 + L2)v | 0.6857 ±0.0012 | |
| r=R/a (pole) | 0.4547 ±0.0005 | 0.2767 ± 0.0014 |
| r=R/a (side) | 0.4895 ±0.0007 | 0.2892 ± 0.0017 |
| r=R/a (back) | 0.5187 ±0.0008 | 0.3267 ± 0.0032 |
*The parameters with superscript a are assumed.
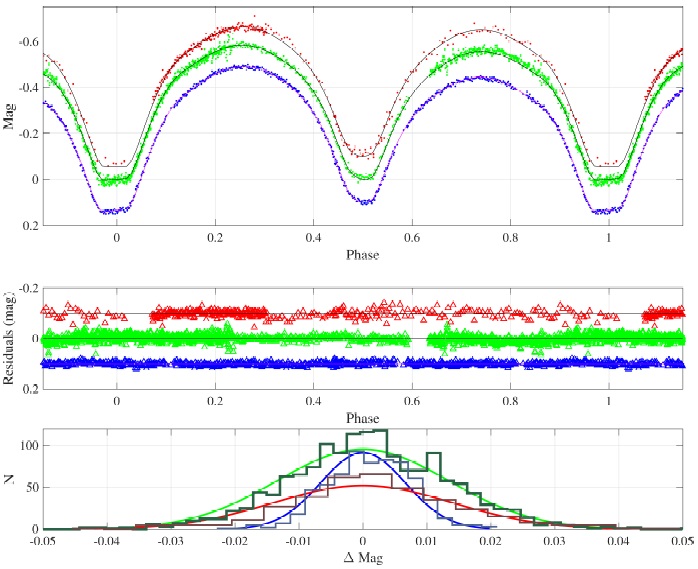
Fig. 5 Top. Simulated (solid lines) light curves fitted to the observations. Blue points correspond to the 2013 observations, green points to the 2014 observations and red points to 2015 observations. Middle. The residuals of the simulations. Bottom. The statistical distribution of residuals and their Gaussian distribution fits. The color figure can be viewed online.
We also provide the residuals and the statistics histogram in the same figure. With the Kolmogorov-Smirnov test, the residuals are seen to follow a Gaussian distribution with σ ≈ 0.0064 at 95% confidence. We also present in Figure 6 the shape of the system provided by the new feature of the WDc.
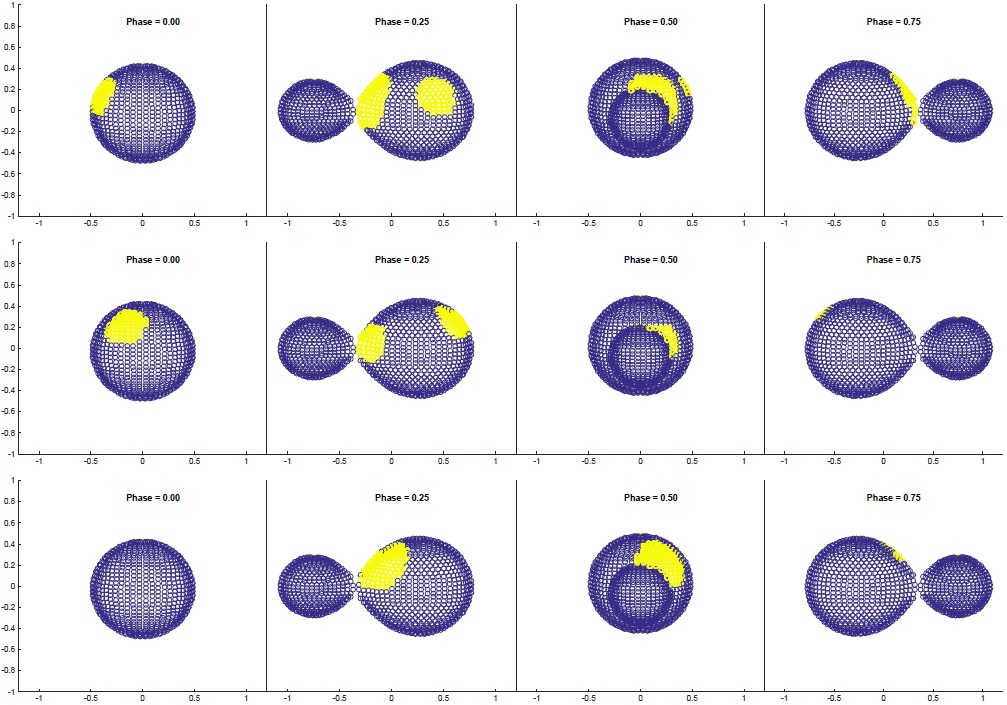
Fig. 6 The shape of system for the three epochs. We present four subfigures of the shape for each epoch. The figures from top left to bottom right are for the first, second, and third year, respectively. The blue part is the shape of the star, and the yellow part represents the hot spots. The color figure can be viewed online.
6. Discussion
Our analysis of this eclipsing binary reveals properties similar in many respects to those of the W UMa systems [Zhu et al. (2010); Dimitrov & Kjurkchieva (2015)], which are characterized by having short orbital periods and an over-contact configuration that is composed of F-K stars sharing a common envelope that thermalizes the stars. This system appears to have a mass ratio of q ≈ 0.323, an inclination of i ≈ 84.3°, and a secondary star temperature of T2 ≈ 5873K. It is also interesting to note that, based on our results, the degree of over-contact in the system, defined as
where the potentials Ωin and Ωout define the inner and outer critical surfaces in Roche geometry and Ω is the potential corresponding to the surface of the over-contact binary, is calculated to be f ≈ 11.5%.
The fact that the primary maximum is variable and sometimes brighter than the secondary maximum can be explained by hot spot activity. The variation of the light curve profile can be well simulated by adjusting the parameters of the spots. For a simplified strategy, we assumed at the beginning that the location and temperature of the spots were fixed. Figure 7 presents the size variation of two hot spots in 19 days of the first epoch. Figure 5 and Table 3 present the spots parameter results of the second and third epochs, and Figure 6 presents the star shapes. Two similar spots can be identified in the first and second epochs, but only one spot can be found in the third part of the data. With all the parameters found, the temperature of the massive component is about 230 K cooler than that of the smaller one.
7. Conclusions
Using the WDc and long term photometric observations of ROTSE-I J1643+25, we were able to determine its basic physical properties and establish that this system belongs to the group of W UMa variables. With a mass ratio of ≈ 0.34, it presents an inclination of ≈ 84.6 degrees and a degree of over-contact of 11%. The analysis of the data shows spots variations on the primary star, which imply strong activity on its surface.


 nueva página del texto (beta)


