1. Introduction
Longitudinal bone growth is regulated by the growth plate, a cartilaginous region located between the diaphysis and epiphyses of long bones (Ballock & O’Keefe 2003; Burdan et al. 2009). New bone tissue is produced in the growth plate by endochondral ossification, a process in which cartilage is changed into bone by chondrocytes hypertrophy followed by osteoid production and mineralization and subsequent remodeling of the resulting calcified tissue. Such process is regulated by several factors among which genetic, hormonal, and biochemical ones have been traditionally considered as the most important, controlling proliferation, hypertrophy and differentiation of chondrocytes within the growth plate (Ballock & O’Keefe 2003; Burdan et al., 2009; Forriol & Shapiro, 2005; Mackie et al., 2008; Mao & Nah, 2004; Nilsson et al., 2005). However, mechanical stimulation is progressively considered as another major actor in growth plate biology. It is well-known that, during development, bone experiences a complex mechanical environment in which compressive forces derived from independent growth of diaphysis and epiphyses, constraints imposed by the nearby structures such as the periosteum, perichondrium, Lacroix ring and adjacent bones and, finally, forces exerted by muscles have a major role (Forriol & Shapiro, 2005; Henderson & Carter 2002; Mao & Nah, 2004; Nowlan et al., 2010; 2007; Stokes, 2002; Stokes et al., 2008; Villemure & Stokes, 2009). The importance of mechanical stimulation on growth plate biology has been confirmed by several experimental studies. For instance, in vivo studies have demonstrated that in prenatal stages, muscle contractions are required for normal bone ossification, while axial loading affects bone growth rate and growth plate histological pattern (Apte & Kenwright 1994; Giorgi et al., 2014; Niehoff et al., 2004; Nowlan et al., 2010; 2007; Ohashi et al., 2002; Valteau et al., 2011). Additionally, based on clinical observations and in vivo studies in rodents, it is recognized that overloading of bones is associated with growth rate reduction, while tension accelerates bone growth, following the so-called the Hueter-Volkmann law (Stokes, 2002; Villemure & Stokes, 2009). Different computational studies have been performed to analyze the mechanical environment within epiphysis and growth plate of bones at different developmental stages to evaluate possible correlations between specific mechanical stimuli and biological responses (Carter & Wong 1988; Guevara et al., 2015; Nowlan et al., 2008; Piszczatowski, 2011; 2012). For instance, using this type of analysis, Carter and co-workers suggested that shear stress may favor ossification while hydrostatic pressure may preserve cartilage tissue (Carter & Wong 1988). Studies derived from this latter work have attempted to simulate several aspects of skeleton development using a combination of biological and mechanical factors, obtaining patterns that highly resemble the actual biological behavior. Some of these works include the study of bone growth due to growth plate ossification in response to shear stress (Benson et al., 2010; Garzón-Alvarado et al., 2011; Heegaard et al., 1999; Narváez-Tovar & Garzón-Alvarado, 2012; Stevens et al., 1999); joint morphogenesis using a combination of shear stress and hydrostatic pressure as stimuli, the former promoting ossification, while the latter inhibiting it (Shefelbine, et al., 2002; Shefelbine & Carter, 2004); and cartilage growth during joint morphogenesis in response either static or dynamic hydrostatic pressure as main mechanical regulator, with static loads inhibiting growth and dynamic loads promoting it (Giorgi et al., 2014). Finally, other authors used combined experimental and computational approaches to predict bone growth in response to mechanical loading, providing evidence that prove the importance of such relationship during in vivo bone development (Nowlan et al., 2008; Stokes et al., 2006; Sundaramurthy & Mao, 2006). Nevertheless, there is still a large uncertainty about the role of mechanical loading in growth plate development, since this structure experiences several morphological changes comprising modifications in width, location within bone and geometry during growth (Carter & Beaupré 2000; Chan et al., 2012; Cole et al., 2013; Kandzierski et al., 2012; Roach et al., 2003; Scheuer & Black, 2004; Varich et al., 2000). In humans, it is observed that growth plate width diminishes progressively through life. For instance, its morphology in the proximal femur exhibits changes acquiring straight, concave, convex and irregular shapes at different ages (Byers et al., 2000; Fitzgerald et al., 2002; Kandzierski et al., 2012; Scheuer & Black, 2004; Varich et al., 2000). Based on these facts, we hypothesize that growth plate morphological changes may respond to specific mechanical stimuli. Therefore, in this study we aim to analyze the influence of several mechanical stimuli in growth plate morphological changes observed in vivo by means of mathematical modelling and simulation. For such purposes, we analyzed several types of possible mechanical stimuli (hydrostatic pressure, shear stress, compression, and osteogenic index) that have been previously reported to have potential influence on growth plate ossification during bone development. Thus, this study not only focuses on exploratory analyses and theoretical predictions of epiphyseal ossification patterns and growth rate, but also analyzes the relationship between mechanical stimuli and growth plate morphological evolution. This information is important to better understand the mechanical regulation of bone growth that may favor either development or improvement of orthopedic therapies to treat pathologies that imply abnormal bone growth under abnormal mechanical conditions.
2. Materials and methods
2.1. Geometric model
A plane stress model was implemented, considering that we have a section of considerable thickness, allowing to place mechanical loads in a central and eccentric way. However, it is important to mention that the correct analysis should involve an analysis on three-dimensional models. Based on a simplified two-dimensional model for development of proximal femur, three physiological scenarios were simulated. All of them include the following common anatomical structures: perichondral ring of LaCroix, growth plate cartilage, epiphyseal cartilage, cortical bone, and trabecular bone. The first scenario corresponds to a prenatal developmental stage in which the cartilaginous epiphysis has not ossified yet (Figure 1A). The second, whose base geometry is also shown in Figure 1A, represents a developmental stage when a cartilaginous epiphysis ossifies progressively in a process like the one observed in rats (Cole et al., 2013); however, the most basic case was considered which consisted in simulating just one SOC. The last scenario represents a developmental stage when a secondary ossification center (SOC) appears in the middle of the cartilaginous epiphysis (Figure 1B). Mechanical properties of anatomical structures were considered as linearly elastic, isotropic, and homogeneous (Table 1).
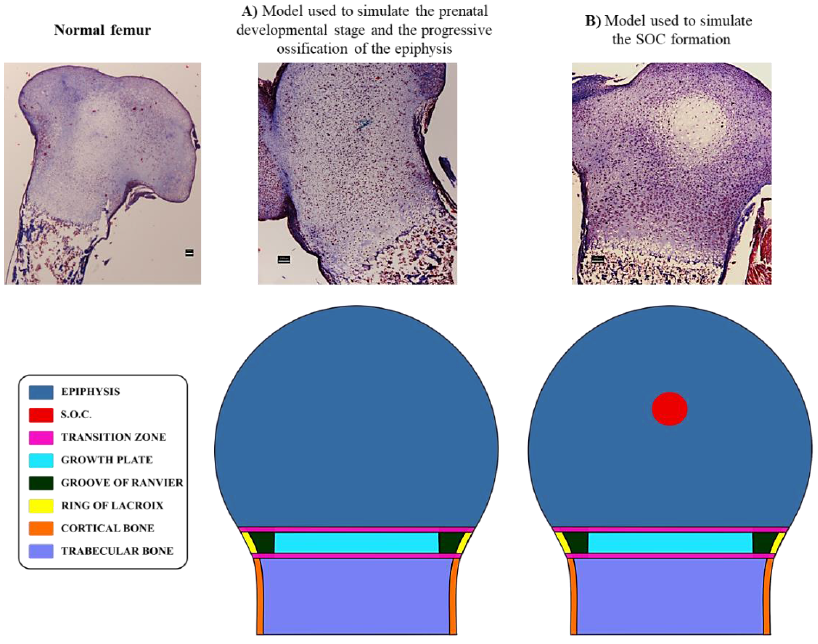
Figure 1 Anatomical zones are considered in the distinct geometrical models. Histological images elucidate the scenarios simulated in this computational model. A) Anatomical zones considered for the first and second developmental scenarios. B) Anatomical zones considered for the third developmental scenario. Scale bars = 100 µm.
Table 1 Mechanical properties of anatomical structures.
| Anatomical Structure | E (MPa) | 𝜈 | References |
|---|---|---|---|
| Growth plate | 6 | 0.45 | (Gómez-Benito et al., 2007) |
| Cortical Bone | 5000 | 0.3 | (Yadav et al., 2016) |
| Trabecular Bone | 2942 | 0.3 | |
| Ring of LaCroix | 775 | 0.3 | (Fishkin et al., 2006) |
Three transition zones were modelled to reduce abrupt changes in mechanical properties between adjacent anatomical structures. The first zone was located between the growth plate and perichondral ring of LaCroix. This transition zone was assumed to be the groove of Ranvier. The second transition zone was located between the epiphysis and growth plate. Finally, the third transition zone was located between the diaphysis and growth plate. The second and third zones were modelled with its adjacent zones: perichondral ring of LaCroix and groove of Ranvier. Each transition zone was distributed into a fixed number of layers of finite elements, which were set to three layers. The elastic modulus (𝐸) and Poisson’s ratio (𝜈) for each layer was assigned following a linear relation from two adjacent areas, as shown in Equation (1).
with
being
2.2. Epiphyseal progressive ossification and SOC
The second and third simulated physiological scenarios correspond to cases where the entire epiphysis progressively ossifies and the SOC appears and expands within the epiphysis, respectively. In both cases, the starting mechanical properties of the epiphysis were those for the first simulated scenario (Table 1). For the case of the progressive ossification of the epiphysis, corresponding to the second simulated scenario, it was assumed that mechanical properties of the epiphysis change from cartilaginous to bony values over a fixed time. Such behavior has been proposed for epiphyseal ossification in rats (Cole et al., 2013). Mathematically, this assumption is expressed as follows in Equation (3):
where
Regarding the SOC, which corresponds to the third simulated physiological scenario, such structure was modelled by assigning bone material properties to four elements located near the geometric center of the epiphysis. Then, a simple diffusion equation (4) was imposed to simulate a biological scenario in which a biochemical molecule is responsible for ossification of the surrounding cartilaginous tissue.
Here, C is the time-dependent concentration of the molecule and 𝐷 is the diffusion coefficient. Considering the poor understanding of concentrations and diffusion coefficients for most biologically relevant morphogens in developing bones, an initial concentration value was fixed at nodes of original ossified elements. According to the study developed by Brouwers et al. (2006), the magnitude of this concentration was set to a normalized value of 1 and the diffusion coefficient was set to a magnitude of 0.001 to generate a SOC within the established period. Last, the expansion of the SOC was simulated based on the average nodal concentration of the molecule for a given element. When this value gets over a fixed threshold value, which was fixed to a value of 24 hr, the mechanical properties of such element are changed from cartilage to bone tissue, since we are interested in the advance of columns in the growth pate for a well-formed SOC.
2.3. Loads and boundary conditions
Two loading schemes were simulated (Figure 2). The first case corresponds to an applied axial static compressive unitary load (Figure 2A), while the second corresponds to an eccentric static compressive unitary load (Figure 2B). In both schemes, displacement restrictions in the lateral and lower boundaries of the model were imposed like a previous model reported by Carter and Wong (1988). Horizontal displacements were fixed to the lateral boundaries, corresponding to cortical bone, while vertical displacements were also restricted to the lower boundary of the model (Figures 2A and 2B). For the case of the developing SOC, a zero-flux boundary conditions were additionally imposed on the external borders of the model, as shown in Figure 2C.
2.4. Growth plate column behavior
Since chondrocytes within the proliferative zone of the growth plate align and stack themselves forming columns that orient in the longitudinal axis of bone and constitute the functional unit of the endochondral ossification process, the benefits of the structured meshing scheme were exploited to simulate a physiological scenario where columnar chondrocytes are correctly aligned with the longitudinal axis of the bone.
Based on this scheme, it was defined a set of independent columns of elements equal to the number of elements in the horizontal direction (identified by the tag “Growth plate length” in Figure 3A) of the zones corresponding to the growth plate, groove of Ranvier and perichondral ring of LaCroix. Each of such columns had a height of ten elements (identified by the tag “Growth plate width” in Figure 3A) which correspond to the width of each of those three structures. Furthermore, every element within the column behaved as a cell automaton, with allowed displacement only in the longitudinal direction of the bone, towards the epiphysis.
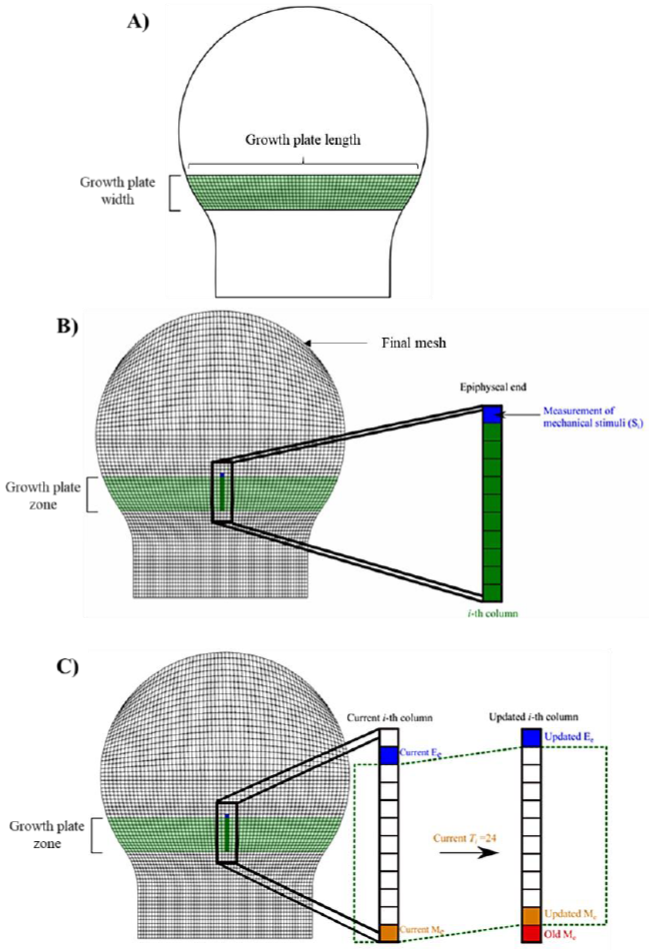
Figure 3 Growth plate geometry and stimuli measurement. A) Growth plate dimensions. B) Elements where the measurement was made after applying the mechanical loading. C) Measurement of mechanical stimuli Si on the i - th column of the growth plate. Elements colored green indicate that they belong to the growth plate. The element colored in blue indicates that the measurement of the mechanical stimulus was performed on such element. The dotted green line represents the growth plate area. Me: Metaphyseal element (the element of the i - th column located at metaphyseal end of the growth plate). Ee: Epiphyseal element (the element of the i - th column located at epiphyseal end of the growth plate).
2.5. Mechanical stimuli
The stimuli considered in this study to explore the behavior of several specific mechanical stimuli and their potential association with the morphological changes observed in vivo in the growth plate, correspond to the following equivalent stresses: maximum shear stress (𝑆), hydrostatic stress (𝑃), osteogenic index (𝑂𝐼) and von Mises stress (𝜎𝑉𝑀). Both S and P have been associated with the regulation of specific biological responses of tissues involved in skeletal development. Based on a descriptive computational analysis of stress distribution in developing bones, Carter and co-workers proposed a relation between specific mechanical stimuli and cartilage ossification, suggesting that 𝑆 may favor ossification, while 𝑃 may preserve cartilage tissue. Furthermore, based on their findings, they proposed a mathematical relationship of S and P, called OI as an indicator of mechanical stimuli, influences on the ossification process (Carter & Wong, 1988). Furthermore, Sundaramurthy et al. provided some experimental evidence of the mechanism of mechanical stimulation proposed by Carter and Wong (Sundaramurthy & Mao, 2006).
Similarly, a computational analysis performed in chick embryo bone rudiments, showed that areas of high octahedral shear stress correlated well with regions where ossification take place (Nowlan et al., 2008). Last, 𝜎𝑉𝑀 traditionally used as a yield criterion for ductile isotropic materials, has also been suggested as a relevant mechano-regulatory signal of the growth plate due to its close relationship with the octahedral shear stress and strain (Castro-Abril et al., 2016).
Despite the evidence on the relevance of mechanical cues on growth plate biology, there is still unawareness of which of these stimuli are most likely to have a predominant role in growth plate ossification. Thus, it was assumed that growth plate ossification was driven only by one stimulus at a time to study the influence of each stimulus independently. This approach aimed to visualize the growth plate shape evolution because of different ossification velocities along the structure related to the distribution pattern of each stimulus.
A fixed initial straight growth plate geometry was established for all stimuli, which corresponds to the physiological shape observed by 1 year of age in humans (Carter & Beaupré, 2000; Ogden, 1984). The measurements made on the growth plate, after having applied the mechanical load, were made on the elements that are in the upper part of the epiphyseal plate (elements colored in blue showed in Figure 3B). In addition to the measurements, the average value of each stimulus on the epiphysis and the growth plate was calculated to observe their relationship with the progressive change of the growth plate shape. Hence, for a given stimulus 𝑆 at a time 𝑡, the average value was calculated using Equation (5):
where
2.6. Element hypertrophy
Following a procedure developed in a previous work (Castro-Abril et al., 2017), element hypertrophy was defined as a function of cell strain and applied mechanical loading. Cell strain at a particular time 𝑡 is given by Equation (6):
where
where
2.7. Growth plate column advance
The growth plate column advance was modelled based on the following hypothesis. 1) During development, there is a continuous transition from resting to proliferative states and from proliferative to hypertrophic states to maintain growth plate thickness. In addition, chondrocytes from adjacent columns communicate with each other to maintain synchronicity along the growth plate. 2) Transition from proliferative to hypertrophic state is a differentiation process that occurs within a time limit from 24 to 48 hr (Ağırdil, 2020), 3) According to Hueter-Volkmann law, mechanical stimulation plays a pivotal role in modulating bone growth. Thus, under sustained static compressive loading growth is inhibited, whereas under tensile loading growth is promoted (Stokes, 2002). Therefore, based on facts, it was assumed that mechanical stimulation “sensed” at the epiphyseal end of the growth plate alters the rate at which proliferative chondrocytes near the hypertrophic zone complete their hypertrophy process. Mathematically, this assumption was expressed as follows in Equation (8):
where
2.8. Numerical and computational implementation
Domain meshing was performed using 4-noded quadrilateral elements and a structured meshing scheme was used. After meshing, a total number of 4158 nodes and 4030 elements were obtained. The computer simulation was performed in 2000-time steps corresponding to 2000 hr of real time, so the time step chosen was 1 hr. The mechanical and diffusion models were implemented using Fortran programming language. The equations were solved by means of finite element spatial discretization and a backward Euler scheme for temporal discretization. The computational model was solved in ABAQUS 6.5.1 by means of a UEL subroutine developed in FORTRAN 90 (Formula Translating System, New York, USA), the geometric model was built in Trelis 3D CAD (Coreform, Orem, Utah), and the results were visualized in TECPLOT 360 (Tecplot Inc. Bellevue).
3. Results
3.1. Mechanical stimuli behavior
The average values for the 𝑆, 𝑃, 𝑂𝐼 and 𝜎𝑉𝑀 were calculated for each of the 24 simulated scenarios to analyze the mechanical environment within the epiphysis (Figure 4). The average stress was heterogeneous and dependent on the considered developmental stage and the driving stimulus for column advance when an axial load was applied. In addition, it was observed that during the first-time steps, average stress values of 𝑆, 𝑃, 𝑂𝐼 and 𝜎𝑉𝑀 tended to be clustered around 0.07, 0.35, 0.4 and 0.7 MPa, respectively. Nevertheless, it was evidenced that those average stress values started to separate from each other with increasing time. In fact, such separation for 𝑃 and 𝑂𝐼 occurred earlier than for 𝑆 and 𝜎𝑉𝑀 (Figure 4). A similar behavior was observed for the average stimuli values within the growth plate (Figure 5). In this case, the average value for 𝑆 was nearly zero.
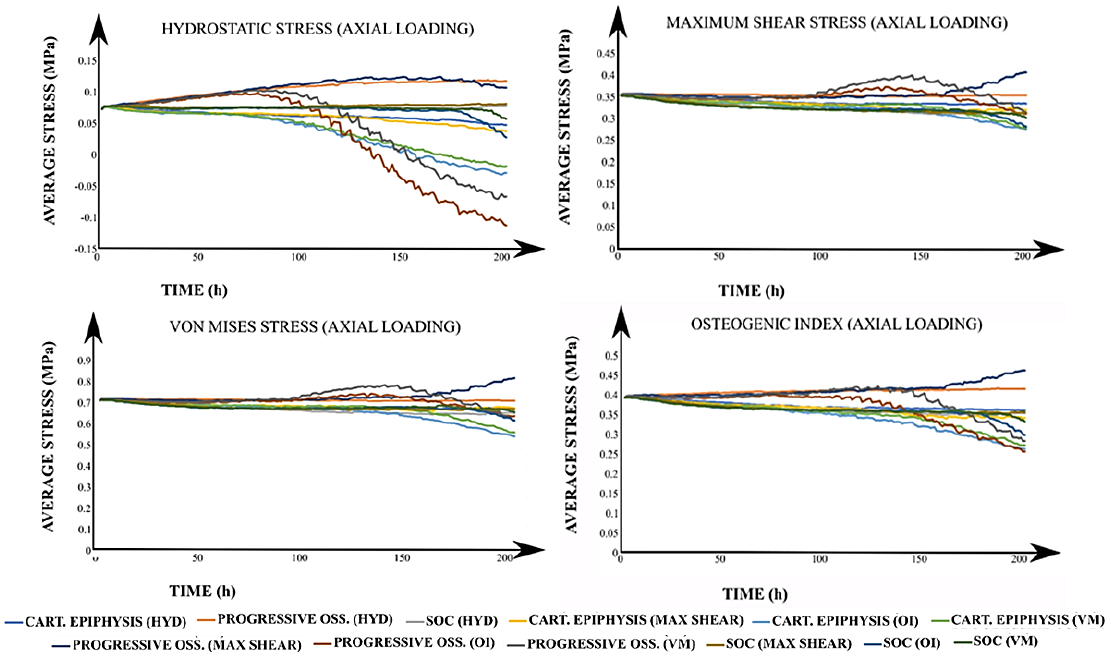
Figure 4 Average stresses for all simulated cases under axial loading. The title of each graph corresponds to the calculated average value of the stimulus with the applied loading scheme (in parenthesis). In the legend, each label has the corresponding developmental scenario (cartilaginous epiphysis, progressive ossification, and the onset of the SOC) and, in brackets, the driving stimulus for the column advance. CART: Cartilaginous. OSS: Ossification. SOC: Secondary Ossification Center. HYD: Hydrostatic stress. OI: Osteogenic Index. VM: Von Mises stress.
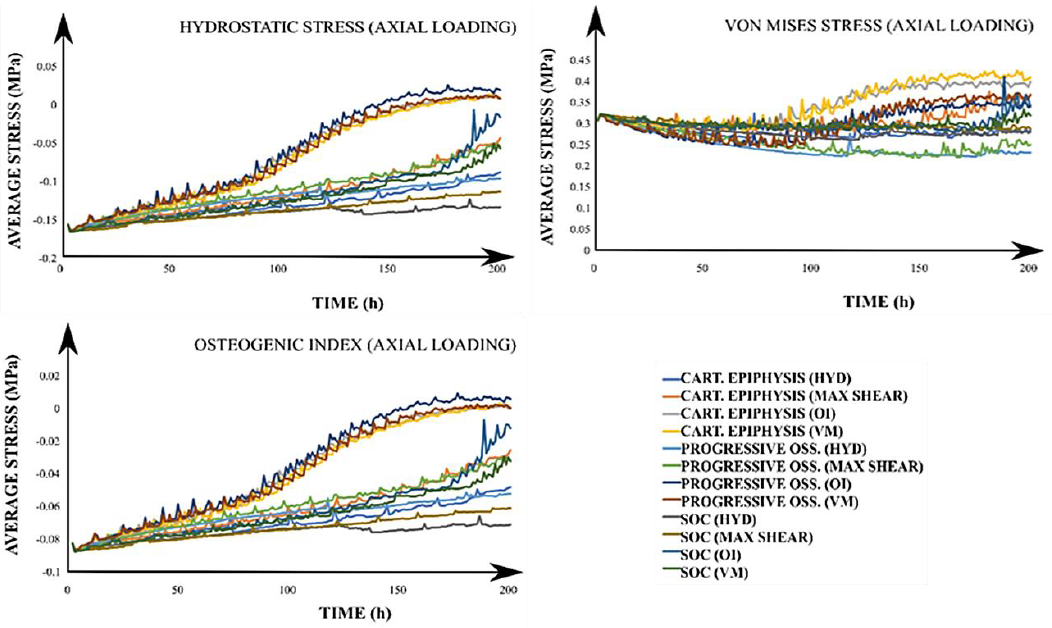
Figure 5 Growth plate average stresses for all simulated cases under an axial loading. The title of each graph corresponds to the calculated average value of the stimulus with the applied loading scheme (in parenthesis). In the legend, each label has the corresponding developmental scenario (cartilaginous epiphysis, progressive ossification, and the onset of the SOC) and, in brackets, the driving stimulus for the column advance. CART: Cartilaginous. OSS: Ossification. SOC: Secondary Ossification Center. HYD: Hydrostatic stress. OI: Osteogenic Index. VM: Von Mises
Similarly, results for the epiphysis under lateral load stimulus showed that average stress values were lower than those obtained for the axial load (Figure S1 at Appendix A). Furthermore, it was revealed that with the SOC onset, magnitudes of average stress values were about 10-fold greater in the growth plate than those obtained for the other two developmental scenarios. Average stimuli values within the growth plate were in similar ranges to those observed under axial loading. In addition, it was observed that growth plate is under compressive stress (Figure S2 at Appendix A), in contrast to what is observed in the epiphysis. Finally, the 𝑂𝐼 showed a heterogeneous behavior in the growth plate (Figure S2).
3.2. Growth plate column advance
In this first example, temporal changes of growth plate morphology (column advance) in response to different mechanical stimuli were analyzed computationally. Three different developmental scenarios were simulated (completely cartilaginous epiphysis, progressive ossification of the epiphysis and the onset of the SOC), using two different loading schemes (axial and lateral).
The most visible changes in growth plate morphology were observed in schemes where axial loading was applied (Figures 6, 7, and 8). For such cases, results showed that when using P as the driving stimulus for the advance of the columns, these exhibited a restricted movement, especially in the central zone of the growth plate. In contrast, when using 𝑆, 𝑂𝐼 and 𝜎𝑉𝑀 as driving stimuli, columns located in the central region of the growth plate displayed a faster advance, compared to the one on the periphery, leading to the characteristic concave shape of the growth plate. In addition, an increasing number of irregularities in the growth plate were observed over time, particularly for the 𝑂𝐼 and 𝜎𝑉𝑀 cases. Furthermore, both columns advance, and growth plate morphology resulted in similar when epiphysis was either cartilaginous or experiencing progressive ossification (Figures 6 and 7). In contrast, a remarkable decrease in growth plate column advance rate was observed when SOC was introduced (Figure 8). Regarding the lateral loading scheme, results evidence that during the simulated period, growth plate columns advance was much slower than axial loading scheme (Figures S3, S4, and S5 at Appendix A). In fact, no visible changes in growth plate morphology were observed for cases where epiphysis was completely cartilaginous or experiencing progressive ossification (Figures S3 and S4). However, when SOC was introduced (S5), an asymmetric behavior of the growth plate columns advance was observed either favoring or inhibiting the advance at the load opposite side. Furthermore, it was observed that epiphysis subtly deviated towards that load on the opposite side.
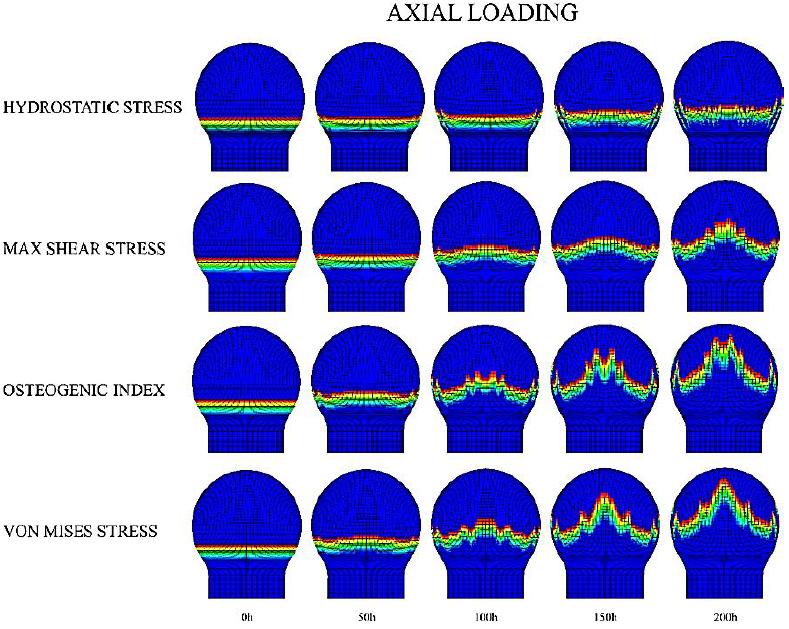
Figure 6 Axial loading scheme for growth plate morphology changes in a completely cartilaginous epiphysis. The legend on the left corresponds to the different driving mechanical stimuli for the advance of the column.
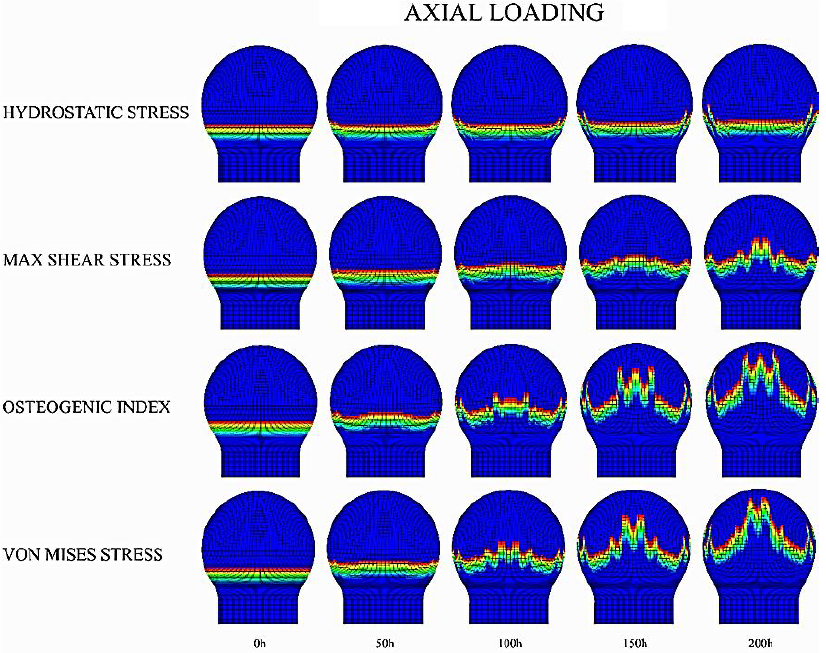
Figure 7 Axial loading scheme for growth plate morphology changes in an epiphysis experiencing progressive ossification. The legend on the left corresponds to the driving mechanical stimulus for the advance of the column.
4. Discussion
The growth plate is a dynamic anatomical structure that is constantly subjected to mechanical loading. As such, mechanical factors have been proposed as regulators of growth plate behavior (Carter & Beaupré, 2000; Chan et al., 2012; Cole et al., 2013; Kandzierski et al., 2012; Roach et al., 2003; Scheuer & Black, 2004; Varich et al., 2000). However, there is poor understanding regarding the influence of mechanical factors in morphological changes experienced by growth plate during development. Thus, in this study the behavior of (𝑆), (𝑃), (𝑂𝐼) and (𝜎𝑉𝑀) and their effect on growth plate shape under different physiological scenarios and loading conditions were explored.
Regarding the detailed effect of each driving stimulus on growth plate behavior, several observations can be addressed. First, the constraining effect that 𝑃 has in the growth plate zone, leading to a slow column advance, correlates well with the proposed negative effect of this stimulus on the ossification process (Carter & Wong, 1988; Giorgi et al., 2014). In fact, the observed mean values of P within the growth plate reflect the role of this stimulus in preserving its cartilaginous nature throughout bone development (Ballock & O’Keefe 2003; Carter & Wong, 1988). Second, it was observed that 𝑆 remained almost constant with values close to zero within the growth plate. Such behavior seems to correlate with the hypothesis that growth plate attempts to minimize 𝑆 to prevent internal failure (Castro-Abril et al., 2016), which may be seen as contradictory with the proposed cartilage ossification stimulatory role of this stimulus (Carter & Wong, 1988; Shefelbine & Carter, 2004; Shefelbine et al., 2002). However, considering the higher values of 𝑆 observed in the epiphysis, these results suggest that chondrocytes located in the limit zone between growth plate and epiphysis might be the ones responsible for sensing the mechanical stimulation and initiate a mechanosensitive cell transduction cascade. In fact, when 𝑆 was considered as driving stimulus, sensed by the epiphyseal side of the growth plate, a fast column advance was observed (Figures 4 and 5). Last, similarities observed between the growth plate shapes for 𝑂𝐼 and 𝜎𝑉𝑀, suggest a remarkable contribution of 𝑆 to the overall growth plate shape. However, based on the observed increase in the rate at which columns advance towards the epiphysis for 𝑂𝐼 case compared to the other ones, we hypothesize that, biologically, 𝑃 in combination with other stimuli may contribute to the stimulation of either chondrocyte proliferation or hypertrophy, the main steps involved in endochondral ossification process (Ballock & O’Keefe 2003; Stokes, 2002).
Concerning the different mechanical loading schemes considered, axial loading drove to a greater growth plate advance compared to lateral loading. This can be explained mechanically by the relationship between the defined column advance rule and the driving stimulus pattern generated by the applied mechanical load. Indeed, as the value of a specific stimulus increases in each area of the epiphysis, columns located beneath that area will require less time to advance than those experiencing a small value of the driving stimulus. As a result, the macroscopic shape of the growth plate will be modified accordingly. Thus, in the cases of axial loading, where greater values for each mechanical stimulus are in the central zone of the epiphysis, the growth plate will tend to acquire its characteristic concave shape. The obtained shapes resemble distinct stages of growth plate development (Figure 9). As such, under S stimulation, the obtained irregular morphologies are like those observed for the ages around 6 to 7 years in humans, although later some irregularities are also present (Figure 9). Regarding the P, it is possible to reproduce a flattened shape as observed in early human proximal femur development (1 year) (Figure 9). Finally, when 𝑂𝐼 and 𝜎𝑉𝑀 were considered more irregularities appeared, which may correspond to the observed growth plate morphologies at 12 years old (Figure 9). Such irregularities could be related with the fact that the proximal femur is subjected to different complex mechanical loads, beyond axial and lateral mechanical loading (Gómez-Benito et al., 2007; Rydell, 1966); in fact, it is composed of varied materials to the isotropic considered in this investigation. This study is an initial trial that shows how the effect of mechanical loading on growth plate development should be approached and studied; however, future work is needed to simulate the femur in a more real and complex context, considering different mechanical and biochemical variables. Furthermore, these growth plate morphological transitions directly influence the stimuli distribution within epiphysis (Figures 6-8), generating a feed-back loop where stimuli distribution inside epiphysis alters the growth plate shape.

Figure 9 Morphologies displayed by human proximal femur at different ages Jones (n. d). Compilation generated based on images reported by Brouwers et al. 2006, Benson et al. 2010, Valteau et al. 2011, Nakamura et al. 2013, Vazquez-Noguerol et al. 2013 and Vermaelen et al. 2015.
Here, the shape redistributes and decreases values of stimuli in the neighboring zones of the growth plate to minimize peak values that would lead to local alterations of biological development and failure. This observation can also be extrapolated to lateral loading stimulus. Here, the observed reduced column advance was expected considering that the growth plate will not sense maximum stimulus values due to the gradient generated by this type of loading. Indeed, under a lateral loading scheme, maximum stimulus values will be concentrated in a zone diametrically opposed to the loading application site along the mechanical loading axis, which is located at opposite side of the epiphysis. It is important to elucidate that those loads tend to vary according to several factors such as bone geometry, human weight, muscle interaction in the bone, among others. Here, it would be novel to consider those parameters to observe how they influence femur development. However, this first attempt applies generic loads in a bidimensional generic model to understand, in a simplified way, what is occurring in the development of the growth plate.
Regarding the different simulated developmental scenarios, results indicated that cartilaginous epiphysis evidenced a similar behavior compared to epiphysis which experienced a progressive ossification. This can be explained by the fact that, despite the temporal advance, mechanical properties in the latter case remained closer to cartilaginous properties considered in the first scenario. This phenomenon is caused by the rate at which the transition takes place (see the Epiphyseal progressive ossification and SOC section). In fact, during the considered period, epiphyseal mechanical properties in the progressive ossification case were almost three-fold the ones established for cartilage, being below the ones expected for bone tissue. It was observed that a decrease in the values of the different stimuli when SOC appears. This may be due to the stress absorbing effect that bone tissue exerts within cartilaginous epiphysis. Given that bone tissue of the SOC is stiffer than the surrounding tissue, stress lines will tend to concentrate around the SOC; therefore, this stress redistribution tends to decrease the stress values sensed by the growth plate, leading to reduced column advance observed in this developmental scenario. The formation of concave shapes and presence of irregularities, which agrees with the observed pattern during human proximal femoral growth plate development (Figure 9).
Lastly, to the best of the authors’ knowledge, this is the first attempt to analyze the behavior of mechanical stimuli during early bone development and their relationship with growth plate morphological changes. Thus, results obtained shed light on the possible role of each stimulus on growth plate physiology.
Nevertheless, this theoretical approach has important limitations regarding the simplified loading scheme here considered and the fact that biochemical stimulation and later stages of bone development were not considered. For instance, the cellular automaton behavior was considered only in the longitudinal direction, representing some limitations such as the interaction between surrounding columns, mechanical and biochemical stresses, and cellular interaction, which are crucial on growth plate development and the femur onset. In addition, the algorithm employed to model growth plate column advance does not completely simulate both a complex geometry and the physiological growth of the structure. The former is crucial due to factors such as tissue heterogeneity, anisotropy and tissue localization need to be considered not only to understand the biochemical and cell-cell interaction, but also assess these interactions in more complex geometrics and close to reality. Secondly, the proximal femoral growth plate in in vivo scenario tends to keep its relative position with respect to the proximal femoral head, since both growth plate and epiphysis are continuously growing (Kandzierski et al., 2012). However, the algorithm does not allow the incorporation of new elements to the original geometrical model, which leads to the invasion of the growth plate into the femoral epiphysis (Figures 6 - 8). Furthermore, the model included a unique time scale for simulating both SOC growth and growth plate column advance, which seems not to be the case according to histological evidence (Kandzierski et al., 2012; Vaca-González et al., 2018; Varich et al., 2000). The location of the SOC has been widely discussed in previous works. According to (Sundaramurthy & Mao, 2006), the SOC appears in the center of the epiphysis due to mechanical loading. They mention that SOC does not appear in the absence of mechanical loads; in fact, mechanical loading not only keeps the SOC, but also allows the SOC expansion within the epiphysis. In this model, the interaction between SOC and growth plate was studied, as changes in the central property of those tissues make those different mechanical stresses in the epiphysis may affect the growth of the epiphyseal plate. Even though in this model the SOC and growth plate could be created depending on the mechanical loads, these structures were assumed in a simplified way depending on the size of elements and mesh. This model considered long intervals of time for the application of mechanical loads, unlike oscillating processes of fluid movement that could be required in a more complex model, including the active transport of molecules that allow differentiation, known as convection. This could be achieved in a more complex model that contemplates either poroelastic or viscoelastic features of materials. Last, the lack of experimental evidence regarding the growth plate shape evolution during mammal and especially human development hampers the validation of our results.
5. Conclusions
Overall, results suggest that 𝑆, 𝑃 and 𝜎𝑉𝑀 may contribute to morphological changes of the growth plate; however, none of them alone are able to completely predict the actual in vivo behavior. Based on such results we suggest that, from a mechanical point of view, changes observed in vivo may result from the interaction with each stimulus triggering specific cell responses in a time dependent way. However, it is important to consider that during bone development several biological factors are also involved that were not considered here (Mackie et al., 2008). Furthermore, the interaction among mechanical and biological factors is still not well understood.
Despite limitations mentioned, this work is an initial approximation to elucidate the role of specific mechanical stimuli on growth plate ossification and morphological changes. Further works should aim to better understand computationally the patterns here observed using dynamic loading schemes and analysis on experimentally derived 3D morphologies. Additionally, although growth plate morphologies obtained resembled physiological shapes reported in isolated cases, it is required to generate imaging registries of population-associated variations of proximal femoral growth plates throughout different stages of human development. This data would provide sufficient information to serve either as a starting point of new computational approaches or as a reference point to contrast current computational results. Moreover, it is necessary to generate more data regarding the mechanical stimuli sensed by growth plate in vivo to refine and develop more realistic computational models.
Conflict of interest
The authors have no conflict of interest to declare.
Funding
Authors gratefully thank the financial support provided by “Fondo Nacional de Financiamiento para la Ciencia, la Tecnología, y la Innovación -Fondo Francisco José de Caldas- Minciencias” and Universidad Nacional de Colombia through the grant No. 80740-290-2020.


 nueva página del texto (beta)


