


 nueva página del texto (beta)
 Inglés (pdf)
 Artículo en XML
 Referencias del artículo
 Enviar artículo por email
 Citado por SciELO
  Similares en
SciELO
Similares en
SciELO 
 Permalink
Introduction
Among the sustainable energy sources, organic solid waste is believed to be a viable alternative to fossil fuels due to its capacity to support the transportation, power, and chemical industries as a main source of inexhaustible, concentrated non-fossil carbon that is accessible on earth [1]. Organic solid waste is a significant renewable energy source and accounts for approximately 10 % of global energy consumption [2], because of its rich reserves, low sulfur and nitrogen contents, “carbon neutral” and so on [3]. However, the properties of biomass, such as high water and oxygen content, low bulk density and heating value, hinder its broad utilization as fuel by conventional technologies [4].
There are various organic materials which were hazardous to human health as well as to the ecosystem. Aromatic compounds exist in the effluents which originate from paint, oil, pharmaceutical, plastics, paper, and tissue industries [5]. Dye compound was used in a large quantity for the coloring of different materials, which were further divided into colorants substances such as dyes and pigments. Dyes are soluble in water while pigments are insoluble [6].
Activated carbon is commonly used for the elimination of contaminants from wastewater [7]. It determined exceptional adsorption ability such as high Surface area, pore structure and the properties of chemicals available on the surface. The structures of carbon absorbents are mostly microporous, mesoporous and macroporous. The equipment used for the preparation of carbon is well-ordered which would offer the application not only in the field adsorption and separation of macromolecules which cannot enter into the micropores but is also used in electrical double-layer capacitors, gas separation, catalysis, water and air purification and energy storage [8-10].
Methylene blue is a cationic dye, largely used for acrylic, nylon, silk and fabric dyeing in the textile industries. In the universe, approximately 11 ~ 16 % of the recycled dye is discharged in the waste of textile [11]. Methylene Blue causes eye burns leading to severe damage to the eyes of humans and animals. It causes short periods of inhalation problems and ingestion causes burning of the alimentary tract and may cause nausea, mental confusion, and vomiting [12].
Marketable dyes are typically a mixture of a large number of complexes and their molecular structure and properties have not been reported so far. Dyes are also very common in chemical composition. In short basic dyes are considered one of the more challenging classes of dyes which are considered toxic colourants. As a consequence, enhanced and cost-effective technologies are required to remove them from textile effluents [13,14].
Methylene blue dye (MB), is a basic dye that has been mostly used in the textiles and printing industry, and it has been found a non-biodegradable dye. Numerous techniques such as chemical or physical have been used for a wide range of wastewater contaminated processes, which include coagulation/flocculation, ozonation, oxidation, ion exchange, irradiation, precipitation, and adsorption [15,16]. Several critical reviews on current treatment technologies were reported [17]. But most of these techniques are costly, required several tools and have limitations. It has been reported that the adsorption onto activated carbon, has proven to be the most efficient and reliable method for the removal of many pollutants, including different dyes [16]. While commercial activated carbon is a very effective adsorbent, its high cost needs the search for substitutes of low-cost adsorbents [18]. Several low-cost adsorbents have been used for eliminating dyes [19], such as orange peel, peat, pith [18], giant duckweed, cellulose, banana pith and other agricultural wastes [19]. While Eucalyptus Lanceolata is generally found in different areas in Malakand, Pakistan as well as in other countries.
However, there are no reports of obtaining activated carbon from Eucalyptus Lanceolata. Therefore, the basic purpose of the recent research is to prepare efficient adsorbent which can eradicate the toxic substances from an aqueous media and compared the kinetics, adsorption, and thermodynamic properties of raw and activated carbon. Moreover, Intraparticle diffusion, Elovich and Bhangam models were applied to evaluate kinetics studies at different temperatures. Thermodynamic parameters, ΔH≠, ΔS≠ and ΔE≠ were investigated from the adsorption kinetics.
Experimental
Preparation of carbon used as an adsorbent
The source materials used were the stem of Eucalyptus lenceolata, which were constantly heated in the absence of oxygen for about 8 h in an oven, with an outlet for the release of water molecules. Carbon attained almost half of the sample mass, which was cooled in a room temperature and crushed with the help of a pestle and separated with US standards mesh 150-180 μm. The carbon was leached with standard 0.2 N nitric acid and hydrochloric acid solutions in 1:1 and allowed for 24 h at 25 °C with regular mixing. The sample was filtered and washed with distilled water until it becomes neutral. The carbon was further activated with organic solvent n-hexane for 24 h at 25 °C with mechanical stirring to remove the organic content. The carbon was filtered and was air-dried in an oven at 80 ± 2 °C. The activated carbon was allowed to cool in the presence of an inert atmosphere.
Methylene blue is used as an adsorbate
Methylene blue is used as an adsorbate supplied by BioM Laboratories, Cerritos USA (Chemical Division Malaysia). Dyes stock solution was prepared from which the different solutions were prepared in double distilled water. The chemical structure and trade name of the dye is given in Scheme 1.

Characterization
The surface area of the carbon was calculated through BET-N2. The test was designed manometrically at 195 °C and pore size analyzer (Model: Quanta chrome NOVA 2200). For the identification of elemental analysis used, Energy dispersive spectrum (INCA 200 Oxford Instruments). SEM of the sample was obtained through aluminum discs (1 cm x 0.25 cm) and by using SEM-Model-JSM-5910, Japan JEOL. Fourier transmission infrared spectrum of the carbon was achieved, using 8201PC Shimadzu Fourier Transform Infrared Spectrophotometer along with FTCOM-1 computer organize disc part.
Adsorption studies
Equilibrium time
0.1 g of carbon was taken in reagent bottles and activated with 10 cm3 of the basic dye solution. Two altered initial concentrations of the dye were prepared for the sample and added 1:10 carbon to adsorbate in reagent bottles which were homogenized in a thermostated water bath at 25 °C for several periods such as 0.5, 1, 2, 4, 6 and 8 h [20]. Fig. 1 shows the standard curve of absorbance. Moreover, it indicates that the equilibrium was reached up to 4 h and then become plateau. It was concluded from the equilibration study that 4 h is the optimum time to cover the surface. Moreover, the sample was filtered, and the filtrate was examined due to a change in the concentration of dye through spectrophotometer. The quantity of adsorbed dye (DΦ. Mol.g -1 ) was calculated.

Where Do is preliminary concentration and Dσ is the equilibrium concentration of dye (mol dm-3), V represents the volume of dye and the weight of the adsorbent was denoted by W.
Adsorption kinetic study
The 0.1 g adsorbent was mixed with 10 cm3 of adsorbate solution. The reaction mixture was shaken at 20 °C, 30 °C and 40 °C for 10-40 mins. Furthermore, changes occur in the concentration were analyzed by the filtered slurry.
Discussion
Raw and activated carbon prepared from the wood of Eucalyptus Lanceolata were analyzed through different analytical techniques such as SEM, EDS, and FTIR for the structural composition. However, BET was used to measure the surface area. Adsorption of Methylene blue on the samples was indicated through the batch adsorption procedure at various temperatures. These results were then interpreted by different models.
SEM/EDS
SEM is used to recognize the surface morphologies of the sample. The SEM images indicated that there are various numbers of sizes, as well as shapes and pores, are present on the sample surface which is presented in Fig. 2. Elemental analysis of the raw and activated carbon was examined through EDS which reveals that carbon and oxygen are present in the samples. The ratio of carbon was surplus as compared to oxygen [21]. However, in the raw carbon, a small per cent of calcium is also detected as shown in Table 1.
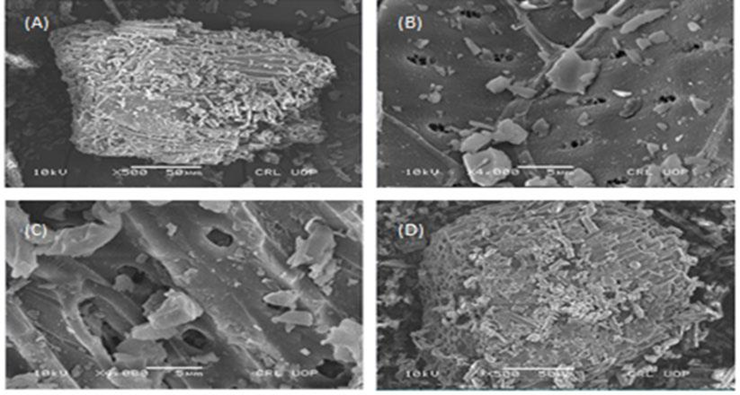
Fig. 2 Scanning electron micrographs of (A) raw carbon with (X500), (B) (X4000), (C) activated carbon with (X500), (D) (X4000).
FTIR
The adsorption band that arises at 1735 cm-1 can assign to H-O-H bending. According to the literature, the absorption band indicates the bending mode of adsorbed water. All the samples were dried for FTIR analysis but as mentioned in the literature, it is too difficult to remove all the water from the sample. FTIR spectra of raw and activated carbon are given in Fig. 3. A strong band appears in the regions 1032 cm-1 indicating the C-O stretching bond was present in the spectrum of both samples, but the changes occur in their transmittance of 83.47 % for activated whereas 91.38 % was associated with raw carbon [22]. C=C group are present at 1595 cm-1 with 98.20 % transmittance in raw carbon, but in the case of activated carbon, it was 1598 cm-1 with 96.59% transmittance. C-O group was present on 1179.29 cm-1, and 1182.55 cm-1 in raw as well as in activated carbon. Whereas the raw and activated carbon display the C=O band in the region of 1732 cm-1. C=C show stretching bonds in the benzene rings band on 1511.12 cm-1 with 98.20 % and 1504.59 cm-1 with 96.59 % for the raw and activated carbon [23]. C = O represent stretching which indicates the existence of oxygen-containing functional groups, such as carboxyls, phenols and ethers C6H5-O-CH3 or -CH2-O-CH3. Sharp bands in the area of 1000-1100 cm-1 indicate that mineral matters were present in both spectra.

The surface area
Brunner Emit and Teller (BET) is a procedure [24] through which the surface area of the sample was calculated. It is built on multilayer adsorption in the presence of an inert atmosphere on the surface of adsorbent, which offers a base to spread microporous surface area of the adsorbent. The process is based on monolayer adsorption Langmuir's theory goes to multilayer adsorption with assumptions: the molecules of N 2 adsorb on the surface of adsorbent in different layers. Whereas the absence of intramolecular attractive forces. Langmuir's model is appropriate for each adsorbed layer. Following is the linear form of BET.
𝑝 and 𝑝o are the adsorbate diffusion pressure, a quantity of the adsorbed gas on the surface is denoted by 𝑣, whereas 𝑣m is the volume of unilayer N2 adsorbed and is used for the constant value which is given below:
𝐸1 represented the heat of sorption for the first layer, and 𝐸𝐿 is used for the upcoming layers.
Equation 2 represented the adsorption isotherm by plotting
The following equation was known as the total specific surface area.
𝑣𝑚 is the molar volume of nitrogen gas, and V represented the Molar volume of adsorbate gas.
Surface area (SBET) of the activated, as well as raw carbon, were obtained from 1/W [(Po/P)-1] against P/Po adsorption of N 2 which was increased from 150 to 355m2.g-1 for Eucalyptus lenceolata. The results show that the surface area increases with treating the carbon samples with chemicals as given in Table 2. During chemical changes the surface became tidy, and the foreign substances were eliminated and developed the surface for the adsorption of dye molecules. Another reason for a high surface area is due to the carbon surface with a non-polarity at high temperature is the fact that these groups are available on the sample surface which leads to a homogeneous [25]. Eisazadeh studied specific surface area and pore structure and its main characteristics in determining its chemical and physical contacts. Due to this fact, most of the chemical reactions occur on the surface. In the same way, the analysis of physical properties such as permeability requires an exact measurement of specific surface area and the pore structure. One of the most familiar methods for determining the surface area known is BET method [15].
Adsorption studies
Equilibration time for dye adsorption on the surface of carbon was activated for a while of 0.5, 1, 2, 4, 6 and 8 h at room temperature. Fig.1 shows that equilibrium was achieved up to 4h and then it becomes linear. It was decided from the study of equilibration that 4hrs is the optimum period for surface coverage. Due to equilibration time, the range of solution for the adsorption kinetics was prescribed and adsorption of dye was considered at 20, 30 and 40 °C on all the raw and activated samples were shown in Fig. 4 and Tables 3-4. It was detected that adsorption within fifteen minutes was very quick and then reduced due to the extreme diffusion on the surface of the carbon. With rising in adsorption temperature sorption of dyes on adsorbent increases that was the evidence of the endothermic process.

Table 3 Adsorption kinetics of methylene blue on the surface of raw carbon.
| Time (Min) | Adsorption Temperature = 20 oC | Adsorption Temperature = 30 oC | Adsorption Temperature = 40 oC | |||||||||
| AbM | Dσ mol dm-3 ×10⁻⁵ | Do- Dσ mol dm-3 ×10⁻⁵ | Dφ mol/g ×10-6 | AbM | Dσ mol dm-3 ×10- 5 | Do- Dσ mol dm-3 ×10- 5 | Dφ mol/g × 10- 6 | AbM | Dσ mol dm-3 ×10⁻⁵ | Do- Dσ mol dm-3 ×10- 5 | Dφ mol/g × 10- 6 | |
| 10 | 1.530 | 3.934 | 4.065 | 4.065 | 0.785 | 2.018 | 5.981 | 5.981 | 1.607 | 4.132 | 3.867 | 3.867 |
| 20 | 1.384 | 3.558 | 4.441 | 4.441 | 0.760 | 1.954 | 6.045 | 6.045 | 1.238 | 3.183 | 4.816 | 4.816 |
| 30 | 1.214 | 3.121 | 4.878 | 4.878 | 0.577 | 1.483 | 6.516 | 6.516 | 1.156 | 2.972 | 5.027 | 5.027 |
| 40 | 1.174 | 3.018 | 4.981 | 4.981 | 0.482 | 1.239 | 6.760 | 6.760 | 0.876 | 2.252 | 5.747 | 5.747 |
| 50 | 1.159 | 2.980 | 5.019 | 5.019 | 0.407 | 1.046 | 6.953 | 6.953 | 0.875 | 2.249 | 5.750 | 5.750 |
Initial Concentration of Methylene blue = 8 ×10⁻⁵mol dm-3, Adsorbent doze = 0.1 g, Adsorbate volume=10 Cm-3
Table 4 Adsorption kinetics of methylene blue on the surface of activated carbon.
| Time (Min) | Adsorption Temperature = 20 oC | Adsorption Temperature = 30 oC | Adsorption Temperature = 40 oC | |||||||||
| AbM | Dσ mol dm-3 ×10⁻⁵ | Do- Dσ mol dm-3 ×10⁻⁵ | Dφ mol/g ×10-6 | AbM | Dσ mol dm-3 ×10- 5 | Do- Dσ mol dm-3 ×10- 5 | Dφ mol/g × 10- 6 | AbM | Dσ mol dm-3 ×10⁻⁵ | Do- Dσ mol dm-3 ×10- 5 | Dφ mol/g × 10- 6 | |
| 10 | 0.559 | 1.437 | 6.562 | 6.562 | 0.429 | 1.103 | 6.896 | 6.896 | 0.421 | 1.082 | 6.917 | 6.917 |
| 20 | 0.452 | 1.162 | 6.837 | 6.837 | 0.339 | 0.871 | 7.128 | 7.128 | 0.388 | 0.997 | 7.002 | 7.002 |
| 30 | 0.448 | 1.151 | 6.848 | 6.848 | 0.303 | 0.779 | 7.220 | 7.220 | 0.352 | 0.905 | 7.094 | 7.094 |
| 40 | 0.404 | 1.038 | 6.961 | 6.961 | 0.281 | 0.722 | 7.277 | 7.277 | 0.336 | 0.863 | 7.136 | 7.136 |
| 50 | 0.342 | 0.879 | 7.120 | 7.120 | 0.162 | 0.416 | 7.583 | 7.583 | 0.326 | 0.838 | 7.161 | 7.161 |
Initial Concentration of Methylene blue = 8 ×10⁻⁵mol dm-3, Adsorbent doze = 0.1 g, Adsorbate volume=10 Cm-3
Linear equations for adsorption kinetic
Calculation of the rate constant by using the first order for the adsorption of Methylene blue on the woody plants Eucalyptus Lanceolata [26].
Do is initial and Dσ is the equilibrium concentration of dyes (mol dm-3), whereas rate constant is represented by kad which were examined from the straight line of ln Dσ vs. t at various temperatures given in Tables 3-4. The values for rate constant increased with increasing experimental temperature. The value of R 2 was (0.8- 0.99) near to 1, indicating best agreement with literature.
The activation energy was calculated through the Arrhenius straight line equation [27].
Activation energy is denoted by Ea, k1 and k2 represent rate constants, R denoted gas constant and T is used for absolute temperature. The calculated activation energies for adsorbed dyes at different temperatures on the surface of carbon are mentioned in Table 7. The sequence of the adsorbed dye was given in the following order. 33.67, 49.14 were recorded for the activated, as well as for the raw samples. The rate of reaction of Methylene blue on raw carbon is low, whereas the rate of reaction is high for Methylene blue on activated carbon. Different thermodynamic parameters such as ΔH# and ΔS# were calculated from activation energies given in Table 5 by using the equations [26].
Table 5 Thermodynamic constants for adsorption of methylene blue.
| Sample | k (min-1) | ΔE≠ (kJ mol-1) | ΔH≠ (kJ mol-1) | ΔS≠ (kJ mol-1K-1) | ||||||
|---|---|---|---|---|---|---|---|---|---|---|
| 20 oC | 30 oC | 40 oC | 20 oC | 30 oC | 40 oC | 20 oC | 30 oC | 40 oC | ||
| Raw | 0.0109 | 0.0212 | 0.0065 | 49.14 | 46.70 | 46.62 | 46.53 | -0.157 | -0.157 | -0.172 |
| Activated | 0.0072 | 0.0175 | 0.0179 | 33.67 | 31.23 | 31.15 | 31.06 | -0.213 | -0.209 | -0.213 |
Table 6 Comparison of the parameters for rate equations of methylene blue on the raw carbon.
| Kinetic model | Parameter | Adsorption temperatures | ||
|---|---|---|---|---|
| 20 °C | 30 °C | 40 °C | ||
| Elovich | AE (g/mg) | 3.212 | 2.707 | 6.317 |
| R2 | 0.9354 | 0.8858 | 0.9875 | |
| Intraparticle diffusion | C (mg/g) | 6.4936 | 6.7639 | 6.8754 |
| Kid (mg/gmin1/2) | 0.0248 | 0.0305 | 0.0124 | |
| R2 | 0.9201 | 0.9336 | 0.9453 | |
| Bangham | A | -0.272 | -0.5008 | -0.1657 |
| KO | 3.224 | 4.606 | 2.015 | |
| R2 | 0.9131 | 0.7673 | 0.9826 | |
Table 7 Comparison of the parameters for rate equations of methylene blue on the activated carbon.
| Kinetic model | Parameter | Adsorption temperatures | ||
|---|---|---|---|---|
| 20 °C | 30 °C | 40 °C | ||
| Elovich | AE (g/mg) | 1.566 | 1.572 | 0.830 |
| R2 | 0.966 | 0.885 | 0.9633 | |
| Intraparticle diffusion | C (mg/g) | 3.9424 | 5.6533 | 3.6323 |
| Kid (mg/gmin1/2) | 0.049 | 0.0532 | 0.0939 | |
| R2 | 0.8813 | 0.9588 | 0.9078 | |
| Bangham | A | -0.1904 | -0.4204 | -0.4016 |
| KO | 7.830 | 7.369 | 13.587 | |
| R2 | 0.9649 | 0.8644 | 0.9488 | |
Where k, kB, h, was the rate constant, Boltzmann constant and Planck constant respectively. The value of ΔH# for the adsorbed dye on a raw and activated carbon was 1.495 to 0.915. The endothermic nature of the sample was known by the positive values of ΔH#. The negative values of the entropy (ΔS#) exposed the affinity of the dyes towards carbon which decreases with the increase in adsorption temperature leads that the system is in order.
Elovich model
Linear form of the Elovich model is expressed as [28].
Straight lines were obtained by drawing q t against ln (t) with the slope of “1/A” and intercept “1/AlnBA” were shown in Fig. 6. The values of “ A” reduced from 20 °C to 40 °C which displays that higher temperature is preferred for the adsorption Tables 6-7. The value R2 is near to 1 determined that Elovich is best fitted for the adsorption of dyes on the surface of the carbon.
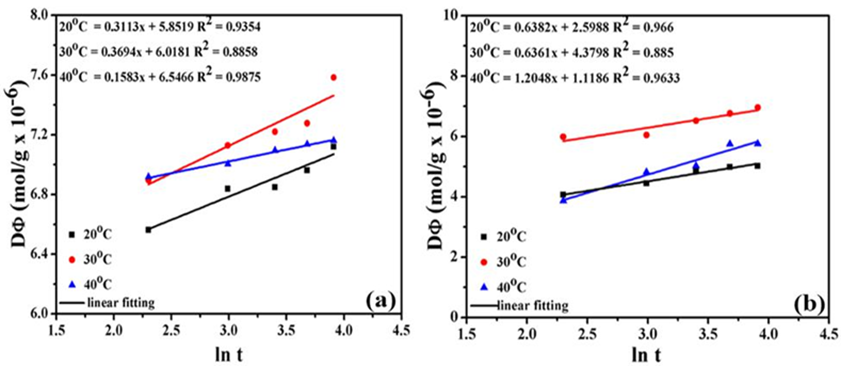
Fig. 5 Elovich graph for adsorption of Methylene blue on the surface of (a) raw (b) activated carbon.
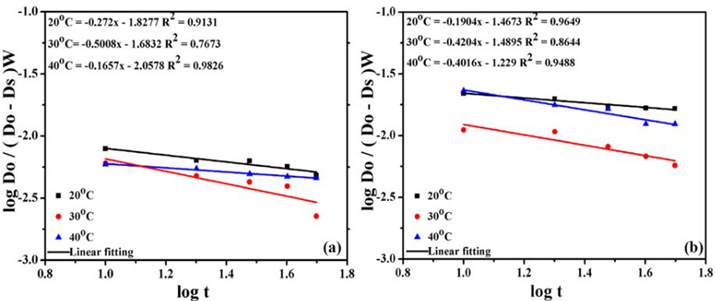
Fig. 6 Bangham plots for adsorption of Methylene blue on the surface of (a) raw (b) activated carbon.

Bangham equation
Linear form of the Bangham equation is written as.
In the solution, Do is the initial concentration of dye, W represents the weight of adsorbate, the volume of the solution is denoted by V, Dσ is the amount of quantity adsorbed at time t. In the Tables 6-7 the value of ko and α were calculated from the intercepts and slopes of the linear graph in Fig. 6. With the increase of shaking temperature, the values of α decreases whereas, ko increased with the increase in temperature of adsorption indicated that the distribution of dye on the pores of carbon is significant leads to a well-controlled process [14,29,30].
Parabolic diffusion model or intarparticle difussion
Previous phenomena from the graph between DΦ vs. t1/2 show multi-linearity, which analyzed different phases counting in the adsorption [27]. According to Morris and Weber parabolic diffusion is denoted by the equation:
The kid value is achieved by a graph of DΦ against t1/2 as revealed in Fig. 7. Moreover, the Intraparticle diffusion coefficient (kid) is specified in Tables 6-7. The kid values for Methylene blue at 40 oC: 0.0939 for activated carbon, and 0.0124 for raw carbon. The correlation coefficient R 2 for the Intraparticle diffusion adsorption is 0.999 which is closer to 1 showing best agreement for the adsorption of dye. This is due to the instant operation of most easily obtainable adsorbing sites on adsorbent the surface.
Equation (1) states a relationship between equilibrium constant and temperature. Fig. 1 indicates a straight line between ln𝐾 against 1/𝑇. The values of Δ𝐻 and Δ𝑆 were calculated from the slope and intercept, respectively. The thermodynamic parameters associated with the adsorption of MB onto activated carbon prepared from Eucalyptus Lanceolata are listed in Table 5. According to the van’t Hoff equation, standard enthalpy and the entropy values in the range of 20-40 °C were obtained as 46.70 kJmol-1 and -0.123 kJmol-1K-1, respectively. The positive value of Δ𝐻 shows the endothermic nature of the adsorption process. Moreover, it confirmed the endothermic nature of the adsorption process. The negative value of Δ𝑆 indicates that the process is spontaneous and adsorption medium interface during the adsorption.
In recent work, the values of R2 obtained from Intraparticle model equation were higher than 0.90, indicating that the Intraparticle model was a rate-limiting step in adsorption. However, if the Intraparticle model is the rate-controlling process, the fitted curve will start from the origin; and if the Intraparticle model occurs independently, there should be two or more fitted lines [31]. In the current research, there was only one fitted line which did not start at the origin Fig. 7. Additionally, the values of R2 obtained from Bangham model were less than 0.90, suggesting that Intraparticle and Bangham models occurred simultaneously, but the Intraparticle model was the main rate control step; similar results were presented by Youssef et al. [32] and Xu and Liu. [33]. Literature also revealed that the formation of a chemical bond was also a rate control process [34]. The values of this experiment revealed that chemical reaction played an important role during adsorption and was also a rate-limiting step [33].
Conclusion
In a recent paper, sample was examined through SEM, EDS and FTIR to study the structural composition of the Eucalyptus lenceolata. BET studies were used to measure the surface area, 399 to 475 m 2g-1, confirmed that the surface area increased with the chemical treatment. The adsorption of Methylene blue on each sample was investigated through batch adsorption procedures at various temperatures (20 oC, 30 oC and 40 oC). The spectra of EDS reveal that the sample contains a high content of carbon and oxygen. The region of 3406.29 cm-1 and 3414.0 cm-1 in the FTIR bands are the evidence of (-OH) stretching group which leads to hydrogen bonding. 4 h was the maximum equilibration time for the complete coverage of the surface. The positive value of ΔH# indicated that the process was endothermic. Moreover, the negative value of ΔS# shows that the system is in order. The results show that the adsorption of dyes on the surface of carbon particles is fit to the linear equations, and it was summarized that it favors a diffusion-controlled process.

