Introduction
Euphausiacea (order Euphausiacea; Dana, 1852) is an ecologically and oceanographically relevant marine holoplanktonic crustacean (Brinton, 1996; Mauchline, 1980). It is ubiquitous in oceans, including the Gulf of Mexico. Euphausiids may substantially outnumber copepods in number and biomass (Antezana & Brinton, 1981; Mauchline & Fisher, 1969) on the continental shelf and in areas of high productivity, where they are characterized by their high abundance and low diversity (Gibbons et al., 1999). They contribute to 5-10% of the total zooplankton biomass in marine pelagic ecosystems and are key organisms in the pelagic trophic web (Abraham & Sydeman, 2006; Castellanos & Gasca, 1999; Mauchline, 1980; Pérez et al., 2006). The distribution and abundance of these organisms offer insights into their relationship with local hydrography in the Gulf of Mexico (Biggs et al., 1988; 1997; Färber Lorda et al., 2019). They are an indicator species of water masses such that when in waters with adequate characteristics for their development, they increase their population (Antezana, 1978) and provide sustenance to numerous marine resources (Baker et al., 1990; Deagle et al., 2007; Jayalakshmi et al., 2011; Schramm, 2007).
In the Gulf of Mexico, the main oceanographic variables that influence the distribution and abundance of euphausiids are temperature, dissolved oxygen concentration, food availability, and oceanographic processes, which determine the spatial and temporal permanence of populations (Robledo & Mujica, 1999; Salas-de León et al., 1998).
Complex oceanographic processes occur in marine canyons including internal waves, cyclonic and anticyclonic eddies, subsurface upwelling, and convergent flows -all of which promote high organic productivity (Allen et al., 2001; Bosley et al., 2004; Greene et al., 1988; Macquart-Moulin & Patriti, 1996). The Campeche Canyon, in the southern Gulf of Mexico, shows hydrodynamic characteristics of oceanographic interest that influence chemical and biological processes (Aldeco et al., 2009; Santiago-Arce & Salas-de León, 2012).
The distribution, abundance, and diversity of the different euphausiid species in the Campeche Canyon, along with their relationships with hydrodynamic processes and phytoplankton, have not been extensively studied. In the Gulf of Mexico, most of the studies used bongo nets with oblique sampling, which allowed us to obtain samples of the water column in a single layer (Gasca et al., 2001). In the present study, samples were collected with openingclosing plankton nets and allowed for consecutive analysis at 4 depth ranges (e.g., surface, 50, 100, and 200 m). This type of sampling helps identify the distribution of euphausiids in the water column, determine their migration, and identify whether they are epipelagic or mesopelagic species. The objective of this study was to characterize the changes in the distribution, abundance, and diversity of euphausiids in relation to hydrodynamic processes, temperature, dissolved oxygen, and phytoplankton fluorescence in different areas of the Campeche Canyon, Gulf of Mexico, during 2 oceanographic campaigns carried out in February 2011 and October 2012.
Materials and methods
From October to April, the Gulf of Mexico is subject to strong winds from the north (winter storms or northern cold fronts, which are locally called “Nortes”). In summer, tropical storms often develop into hurricanes with winds of more than 120 km h-1 (Monreal-Gómez & Salas-de León, 1990). The Loop Current influences the circulation and water masses of the Gulf of Mexico, including the Yucatán shelf, Campeche Bank, Bay of Campeche, and Campeche Canyon (Díaz-Flores et al., 2017). This current regulates the formation of anticyclonic eddies and presents its maximum flow in the months of AprilMay until August when its greatest intrusion also occurs. Later, when the current loses strength, it begins to strangle and forms anticyclonic eddies that are accompanied by cyclonic meanders from which cold cyclonic eddies are formed (Vukovich & Maul, 1985). Cyclonic eddies significantly influence local production by transporting nutrients from the deep layers to the surface layer (Díaz-Flores et al., 2017; Salas-de León et al., 2004). Salas-de León et al. (2004) showed the existence of subsurface cyclonic and anticyclonic eddies in the Campeche Canyon in the summer of 1999. The eddies were clearer below the mixed layer (-40 m deep) and their influence extended to a depth of 300 m. Increasing the temperature, salinity, and dissolved oxygen isoclines in the southeast of the canyon suggests the existence of colder and nutrientrich intermediate upwelled waters near the surface. The subsurface anticyclonic eddy induced convergence of water over the Campeche Canyon, while the cyclonic eddy produced a divergence, presenting a well-delimited frontal region between the 2 eddies.
The Gulf of Mexico has a wide continental shelf off the Yucatán Peninsula, known as Campeche Bank; its southwestern portion is called Campeche Sound. At the western end of the Campeche Bank, south of the Gulf of Mexico, is an area that exhibits abrupt depth changes; this region is known as the Campeche Canyon (Creager, 1958). The canyon is an outstanding feature of the continental slope located between 20°12’ and 21°36’ N, 92°24’ and 93°24’ W; the axis of the canyon is defined by a line that extends from 20°00’ N, 92°21’ W to 21°00’ N, 92°42’ W (Fig. 1).
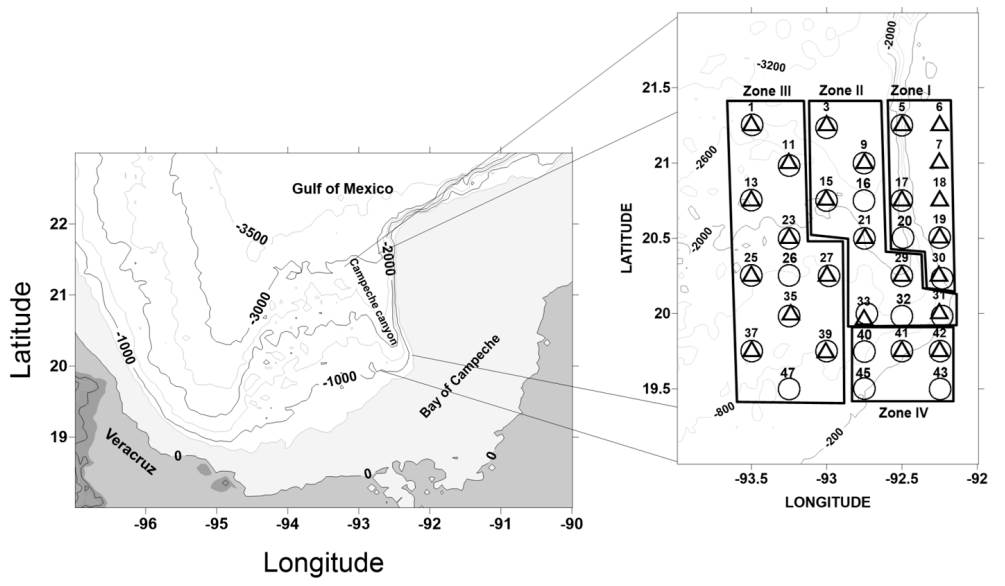
Figure 1 Bathymetry (m) of the Campeche Canyon and the Gulf of Mexico. The panel on the right represents the sampling stations and zoning according to the topography during February 2011 (triangles - ▲) and October 2012 (circles - ●): zone I - Continental Slope region, zone II - axis and head of the Canyon, zone III - western region of the Campeche Canyon, and zone IV - southern part near the Continental Shelf. Most of the stations shown in the 2 samples coincide.
The canyon is 125 km long and up to 55 km wide; its origin is tectonic, and it is considered a topographically complex region (Creager, 1958). The canyon is classified as hydrodynamically wide because of its internal deformation Rossby radius, which is less than the width of the canyon at the center (Santiago-Arce & Salas-de León, 2012). The area of the canyon is approximately 2700 km2, with its characteristic slopes varying from less than 1° to 3° (Mendoza & Ortiz-Pérez, 2000). Santiago-Arce and Salas-de León (2012) reported horizontal speeds of the order of 3 10-1 m s-1 and positive vorticity (cyclonic eddies) to the southwest of the study area and negative vorticity (anticyclonic eddies) toward the western side of the domain in the order of 10-6 s-1. The upward and downward flow patterns over the canyon agree with the positive and negative vorticity values at different depths. The Froud numbers calculated by Santiago-Arce and Salas-de León indicate the existence of internal waves and a hydraulic jump within the Campeche Canyon.
Two oceanographic cruises were conducted aboard R/V Justo Sierra owned by the National Autonomous University of Mexico (UNAM) from February 21-28, 2011 (mid-winter or northern storm season), and from October 4-12, 2012 (end of summer, the start of the winter or northern storm season). Campeche Canyon was divided into 4 zones based on canyon bathymetry and hydrography. Stations 5, 6, 7, 17, 18, 19, 20, and 30 were in zone I, which is on the continental slope with a steep drop and the influence of the Loop Current. Zone II corresponds to the axis and head of the canyon where hydrodynamic processes occur (anticyclonic-cyclonic eddy and hydraulic jump); stations 3, 9, 15, 16, 21, 29, 31, 32, and 33 were located here. Zone III, with anticyclonic-cyclonic eddy and a thermal front, encompasses the western part of the canyon; here, stations 1, 11, 13, 23, 25, 26, 27, 35, 37, 39, and 47 were located. Finally, zone IV corresponds to the southern part near the continental shelf with shallow depths and included stations 40, 41, 42, 43, and 45 (Fig. 1).
Temperature, salinity, and dissolved oxygen levels were recorded using a Neil Brown Mark-III CTD. Solar irradiance (EoPAR) was recorded with a Biospherical PNF-300 profiler. These measurements were obtained from the subsurface to a depth of 200 m. The conservative temperature Θ (°C), absolute salinity (g kg-1), and density (kg m-3) were calculated using the thermodynamic equation of Seawater-2010 (TEOS-10). Chlorophyll-a (Chl-a) concentrations (mg m-3) were calculated using the internal software of the PNF-300 profiler (Kiefer et al., 1989; Chamberlin et al., 1990).
The vertical component of the relative vorticity was obtained by numerically solving the vertical component of the rotational velocity as described by Santiago-Arce and Salas-de-León (2012), while the geostrophic currents were obtained as described by Salas-de Léon et al. (1992).
Zooplankton samples were obtained using horizontal trawls with opening-closing cylindrical conic nets (1.15 m mouth diameter, 2.35 length, and 550 µm mesh size) for 15 min at a speed of 1 m s-1 at different depths (surface, 50, 100, and 200 m). During each campaign, the 55 stations were sampled once during the day or night, depending on the trajectory of the vessel. This method is adequate for determining the vertical distribution of euphausiids, in agreement with their biological clocks.
Filtered-water volumes were determined using calibrated General Oceanic flowmeters that were placed at the mouths of the nets (Zavala-García & FloresCoto, 1989). The zooplankton samples were fixed in 4% formalin for 24 h, 30 g of sodium borate was added, and the samples were subsequently transferred to 70% alcohol for preservation (Harris et al., 2000).
The euphausiids at different stages of development were sorted, and their relative abundances (Ind m-3) were estimated at the surface depths of 50, 100, and 200 m levels at daytime and nighttime. Adult-stages were taxonomically identified with the help of specialized literature (Boden et al., 1955; Brinton, 1962, 1975; Gibbons et al., 1999; Mathew et al., 2003; Mauchline, 1980); after the adult individuals were their diversities in the 4 zones were determined using the Shannon-Wiener H diversity index with base 10 logarithms (Magurran, 1988).
Based on the results obtained from the abundance of adult-stage euphausiids during February and October, a map was created that showed their horizontal distributions at different depths in the 4 regionalized zones. Additionally, representative (those that most closely approximated the average of the station values) vertical profiles of temperature, dissolved oxygen, and Chl-a concentrations were set for each area. Using temperature data, topographies of the 18.5 °C, 15 °C, and thermocline isotherms were created to identify cyclonic and anticyclonic eddies in each area of the Campeche Canyon (Salas-de-León et al., 2004).
Finally, with the abundance and diversity data of the adult-stage euphausiids and the environmental variables (temperature °C, salinity g kg-1, dissolved oxygen µmol L-1, and Chl-a mg m-3), the Bray-Curtis dissimilarity analysis was performed using the SPSS statistics program to obtain similarity groups between the stations of each sampling campaign. To determine the environmental variables that most influenced the abundance and diversity of euphausiids, principal component analysis (PCA) was applied (Jolliffe, 2002).
Results
Twenty-four different species of the order Euphausiacea, belonging to the 5 genera Euphausia, Nematobrachion, Nematoscelis, Stylocheiron, and Thysanopoda, were identified in the Campeche Canyon area during the study period. Of the 24 identified species, T. orientalis and T. cristata were recorded only in October, whereas E. brevis, E. pseudogibba, N. sexspinosum, and T. obtusifrons were recorded only in February (Table 1).
Table 1 Mean abundance percentages of adult (sorted by species) and development stages of euphausiids collected in February and October in the Campeche Canyon.
| February 2011 | October 2012 | |||||
|---|---|---|---|---|---|---|
| % Abundance | ||||||
| Euphausiid species | Day | Night | Total | Day | Night | Total |
| Euphausia americana (Hansen, 1911) | 0.0 | 14.9 | 15.0 | 6.2 | 20.7 | 27.0 |
| Euphausia brevis (Hansen, 1905) | 0.0 | 1.2 | 1.2 | N/R | N/R | N/R |
| Euphausia gibboides (Ortmann, 1893) | 0.0 | 3.7 | 3.7 | 0.2 | 1.2 | 1.4 |
| Euphausia hemigibba (Hansen, 1910) | 0.0 | 0.9 | 0.9 | 0.0 | 0.2 | 0.3 |
| Euphausia mutica (Hansen, 1905) | 4.5 | 4.8 | 9.3 | 1.7 | 5.6 | 7.3 |
| Euphausia pseudogibba (Ortmann, 1893) | 0.0 | 0.1 | 0.1 | N/R | N/R | N/R |
| Euphausia tenera (Hansen, 1905) | 1.0 | 23.4 | 24.4 | 4.1 | 12.7 | 16.8 |
| Nematobrachion flexipes (Ortmann, 1893) | 0.0 | 0.1 | 0.1 | 0.0 | 0.1 | 0.1 |
| Nematobrachion sexspinosum (Hansen, 1911) | 0.0 | 0.0 | 0.0 | N/R | N/R | N/R |
| Nematoscelis atlantica (Hansen, 1916) | 0.8 | 0.4 | 1.2 | 0.1 | 0.2 | 0.2 |
| Nematoscelis microps (G.O.Sars, 1883) | 0.1 | 1.0 | 1.1 | 0.4 | 0.8 | 1.2 |
| Nematoscelis tenella (G.O. Sars, 1883) | 0.0 | 0.1 | 0.1 | 0.0 | 0.2 | 0.2 |
| Stylocheiron abbreviatum (G.O. Sars, 1883) | 0.0 | 0.5 | 0.5 | 0.3 | 0.8 | 1.1 |
| Stylocheiron carinatum (G.O. Sars, 1883) | 9.3 | 24.8 | 34.1 | 9.4 | 24.8 | 34.1 |
| Stylocheiron elongatum (G.O. Sars, 1883) | 0.0 | 0.8 | 0.8 | 0.4 | 0.6 | 1.1 |
| Stylocheiron longicorne (G.O. Sars, 1883) | 0.6 | 3.7 | 4.2 | 3.2 | 3.7 | 6.9 |
| Stylocheiron maximum (Hansen, 1908) | 0.0 | 0.1 | 0.1 | 0.0 | 0.0 | 0.0 |
| Stylocheiron robustum (Brinton, 1962) | 0.0 | 0.1 | 0.1 | 0.0 | 0.1 | 0.1 |
| Stylocheiron suhmi (G.O. Sars, 1883) | 1.9 | 0.1 | 2.1 | 0.4 | 1.0 | 1.4 |
| Thysanopoda aequalis (Hansen, 1905) | 0.0 | 0.2 | 0.2 | 0.1 | 0.4 | 0.4 |
| Thysanopoda cristata (G.O. Sars, 1883) | N/R | N/R | N/R | 0.0 | 0.0 | 0.0 |
| Thysanopoda obtusifrons (G.O. Sars, 1883) | 0.0 | 0.3 | 0.3 | N/R | N/R | N/R |
| Thysanopoda orientalis (Hansen, 1910) | N/R | N/R | N/R | 0.0 | 0.0 | 0.0 |
| Thysanopoda tricuspidata (Milne Edwards, 1837) | 0.2 | 0.4 | 0.6 | 0.0 | 0.2 | 0.2 |
| Stages of development Calyptopis | 0.4 | 3.2 | 3.6 | 7.5 | 6.7 | 14.2 |
| Furcilias | 19.1 | 60.0 | 79.1 | 46.2 | 30.6 | 76.8 |
| Juveniles | 2.9 | 14.4 | 17.3 | 2.8 | 6.1 | 8.9 |
Note: N/R, species not registered
Stylocheiron carinatum was the most abundant species, both in February and October (34.1% at each period), followed by E. americana, E. tenera, and E. mutica (Table 1). These species were found during the daytime and the nighttime samples at depths of 50 and 100 m. Note that except for S. longicorne (4.2% in February and 6.9% in October), the remaining adult euphausiid species presented an abundance of less than 4.2% (Table 1). Adult euphausiid species with abundance lower than 0.2% were recorded between depths of 100 and 200 m at night in zones II and III in both February and October. Furthermore, in February, zones I, II, and III had higher abundance of euphausiids, while in October, the highest abundance was observed in zone IV.
Regarding larval stages, calyptosis, furciliae, and juveniles were found in both February and October. The furcilia stage had the greatest abundance in the 4 levels sampled in the water column in both months, especially in zones II and III. The relative abundance of the larval stages (88.3% in February and 72.6% in October) was higher than that in the adults (11.7% in February and 27.4% in October).
Euphausiid species diversity showed its highest values in zones III, IV, and II, (2.14, 1.89, and 1.87 bits Ind-1, respectively) in February and in zones III, II, and I (1.99, 1.94, and 1.73 bits Ind-1, respectively) in October. In both February and October, zone III was the most diverse, with the highest diversity recorded mainly at depths of 100-200 m.
The spatial-temporal distribution of euphausiids, based on their abundance (Ind m-3), was heterogeneous (Figs. 2, 3). In February, the adult stage was more abundant between 50 and 100 m than at the surface and at 200 m depth; this difference was more evident at 200 m (Fig. 2), whereas in October, the abundance was higher at 100 and 200 m depths than at the surface and at 50 m depth (Fig. 3).
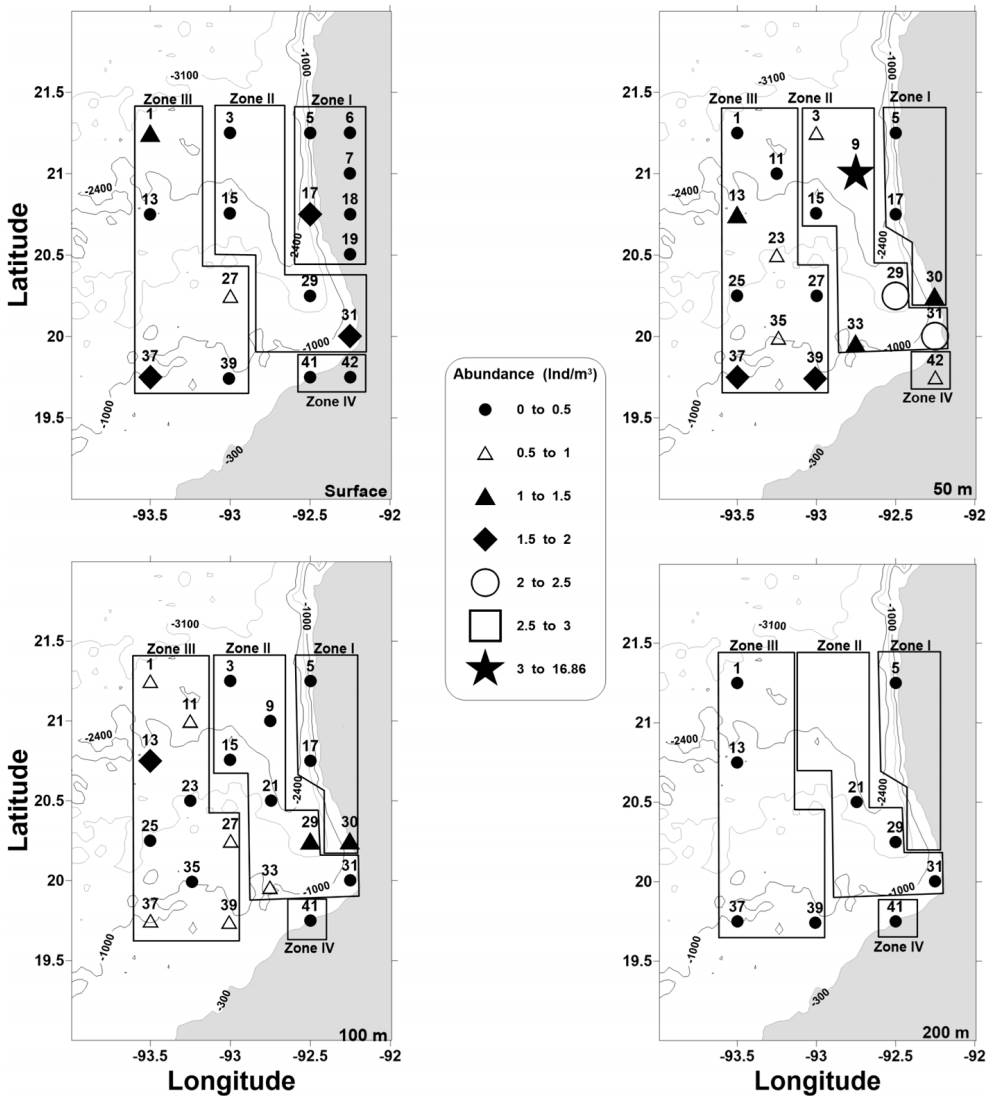
Figure 2 Horizontal distribution of abundances of euphausiids (Ind m-3), adults and early stages at different depths (surface, 50, 100, and 200 m) in the different zones (I, II, III, and IV) of the Campeche Canyon during February of 2011. The geometry of the figures is proportional to the total abundance of euphausiids.
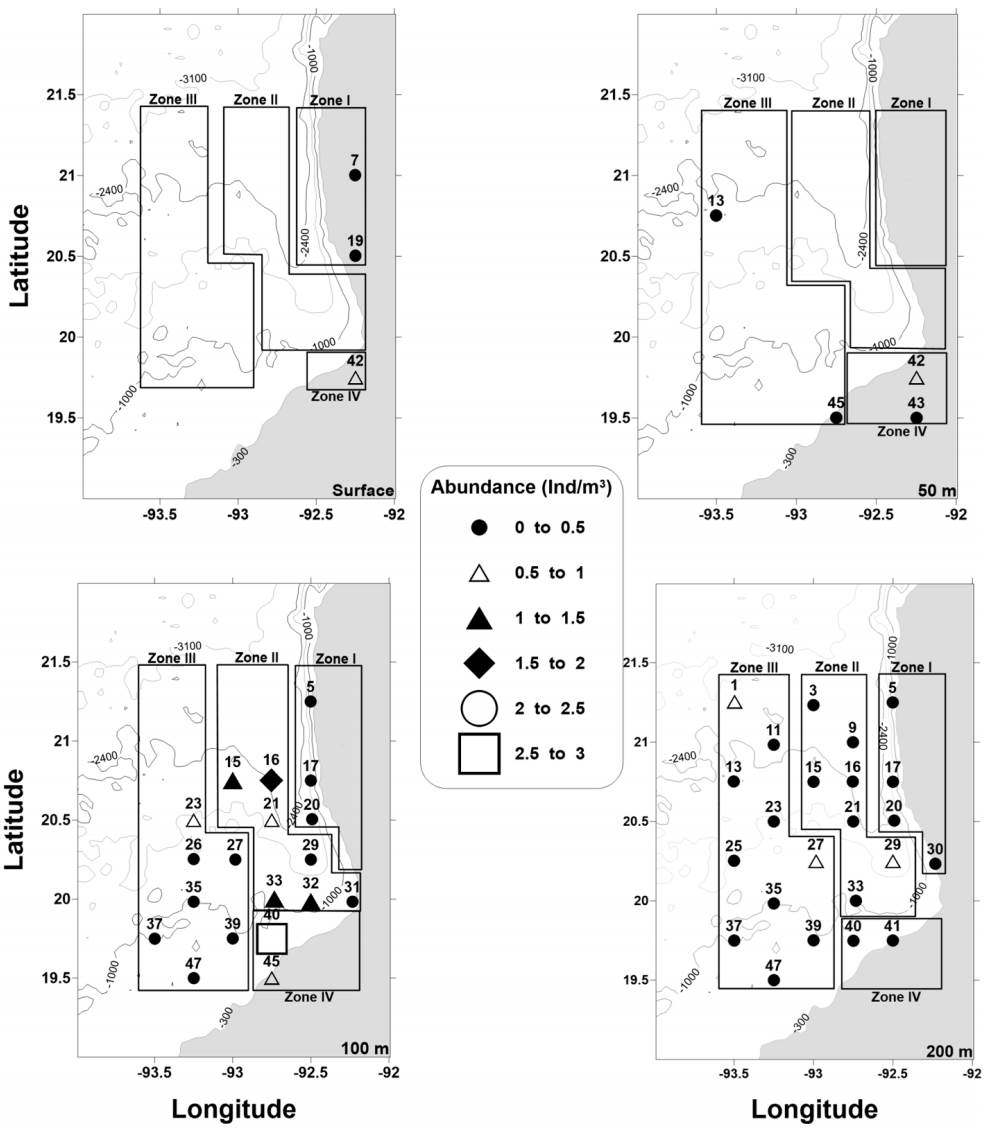
Figure 3 Horizontal distribution of abundances of euphausiids (Ind m-3), adults and early stages at different depths (surface, 50, 100, and 200 m) in the different zones (I, II, III, and IV) of the Campeche Canyon during October of 2012. The geometry of the figures is proportional to the total abundance of euphausiids.
The high abundance of the early stages recorded on the surface may be because the organisms have limited mobility due to their rustic structures. Another factor that encourages the early stages to be located close to the water surface is the thermocline because it can act as a barrier that prevents both furcilia and calyptopis from migrating to deep waters. As the furcilia grow, they acquire additional appendages that aid swimming capacity to migrate to greater depths. This widens their distribution in the water column.
In the horizontal plane, the distribution of euphausiids was heterogeneous, and the offshore areas (e.g., zones II and III) presented the highest abundance compared to the areas near the shelf (e.g., zones I and IV); this was observed in the 2 samplings (Figs. 2, 3).
Euphausiids and their relationship with hydrodynamic processes. In February, a deep mixed layer with a deep thermocline was observed (approximately at 80 m depth), while in October, the water column was stratified, and the thermocline was located at a depth of 50 m (Figs. 4, 5). Temperature in February was lower (24.44 °C) than that in October (29.09 °C). This suggests that temperature was one of the main drivers of euphausiid distributions; in both sampling periods, the highest abundance was recorded at temperatures between 15 and 22 °C, and euphausiids were mostly located at the lower levels (100 and 200 m) in October and from the surface to 200 m in February (Figs. 2, 3).
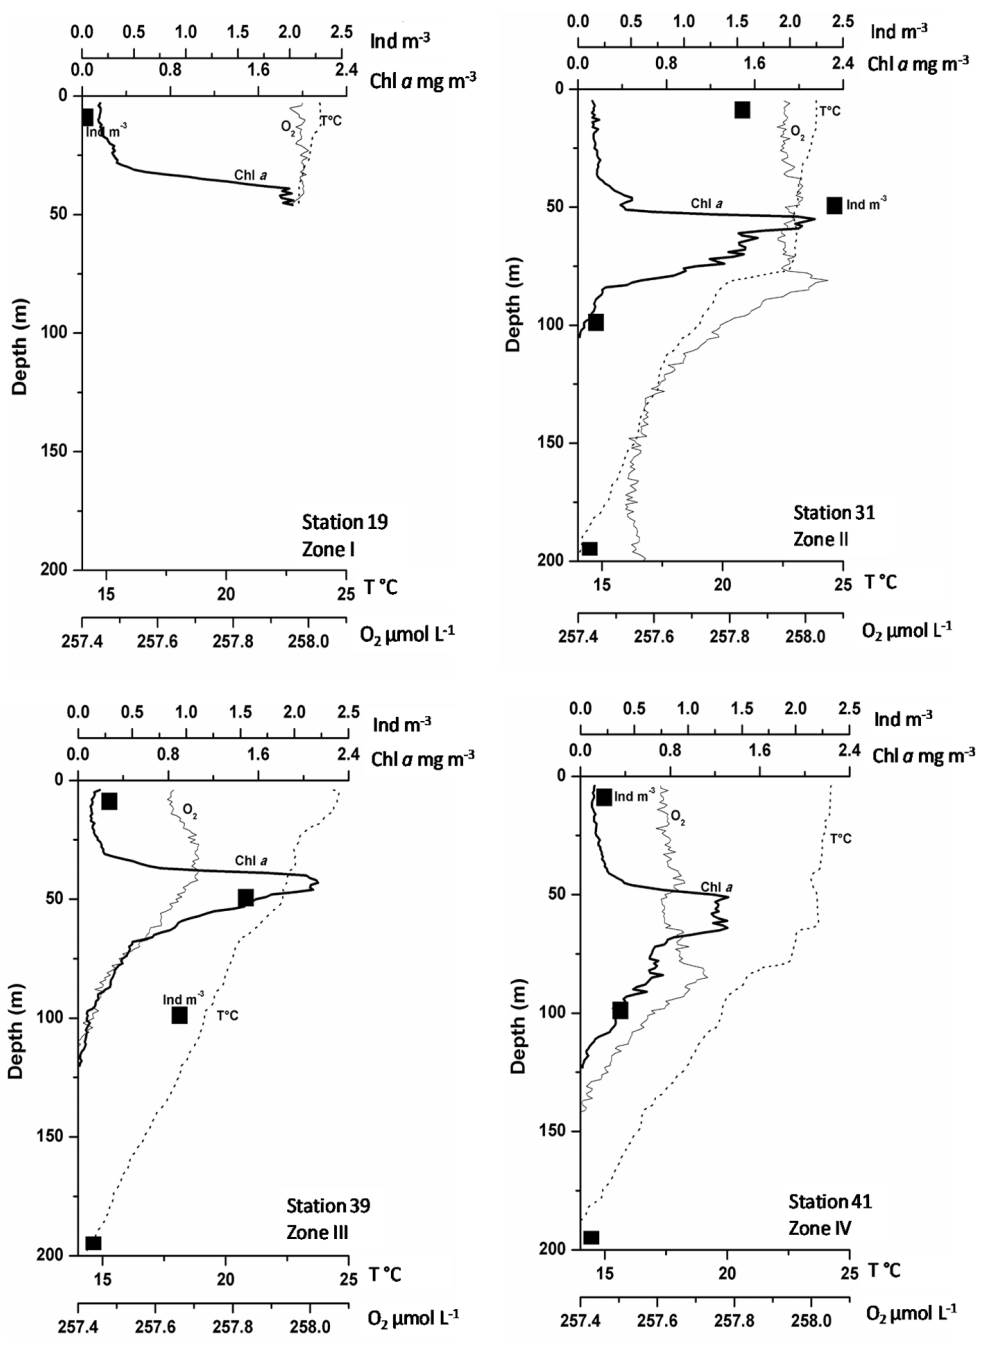
Figure 4 Vertical profiles of the environmental variables: temperature (°C, dotted line), Chlorophyll-a concentration (mg m-3, thick solid line), and dissolved oxygen (µmol L-1, thin solid line) in different zones (I, II, III, and IV), and euphausiid abundance (Ind m-3, black squares ■) of Campeche Canyon during February 2011.
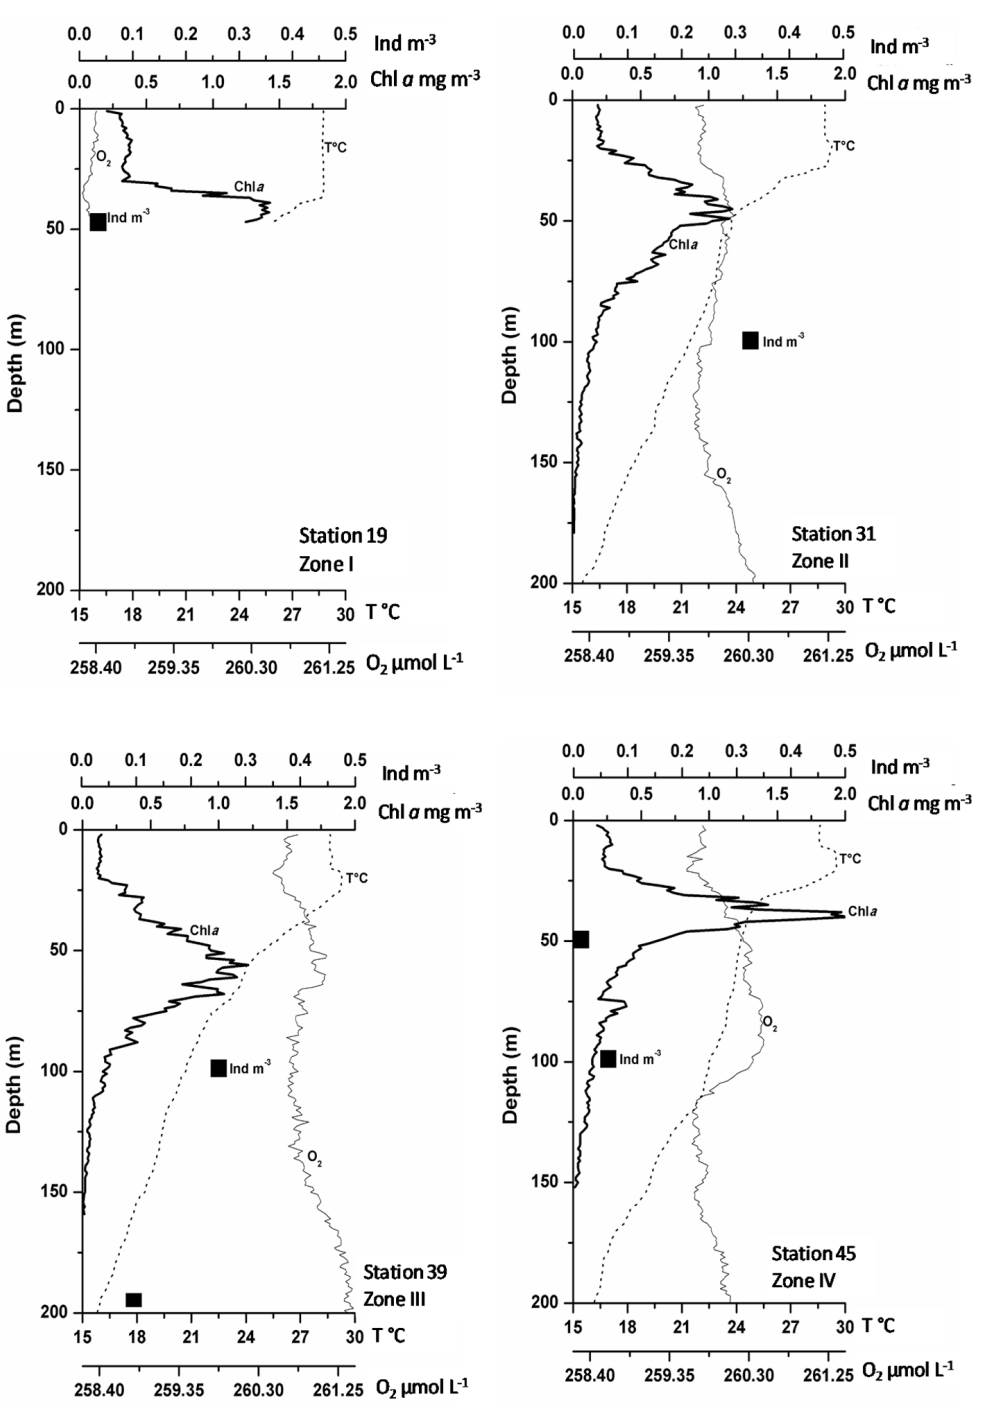
Figure 5 Vertical profiles of the environmental variables: temperature (°C, dotted line), Chlorophyll-a concentration (mg m-3, thick solid line), and dissolved oxygen (µmol L-1, thin solid line) in different zones (I, II, III, and IV), and euphausiid abundance (Ind m-3, black squares ■) of the Campeche Canyon during October 2012.
Figure 6 shows the geostrophic vorticities and currents obtained from the data taken during the February 2011 campaign. Positive vorticities correspond to cyclonic gyres, whereas negative vorticities correspond to anticyclonic gyres. Cyclonic gyres induce vertical updrafts, bringing subsurface water to the photic surface zone and carrying nutrients during their rise. The anticyclonic gyres have an inverse dynamic; they generate convergent currents that produce subsidence, dragging nutrients and organisms towards the subsurface layers. Figure 6 shows, an anticyclone gyre centered at 92.80 W and 20.80 N that is clearer at 50 m depth and a frontal zone that goes from south to north at 93.00 N. This pattern continued down to 300 m, with intensity decreasing at greater depths. The vorticities and geostrophic current paths for sampling in 2012 (not shown) were similar. The mixing of the water column and the sinking of the thermocline in February may be related to cold fronts (winter storms), which cool the mixed layer and decreases temperatures (Fig. 7).
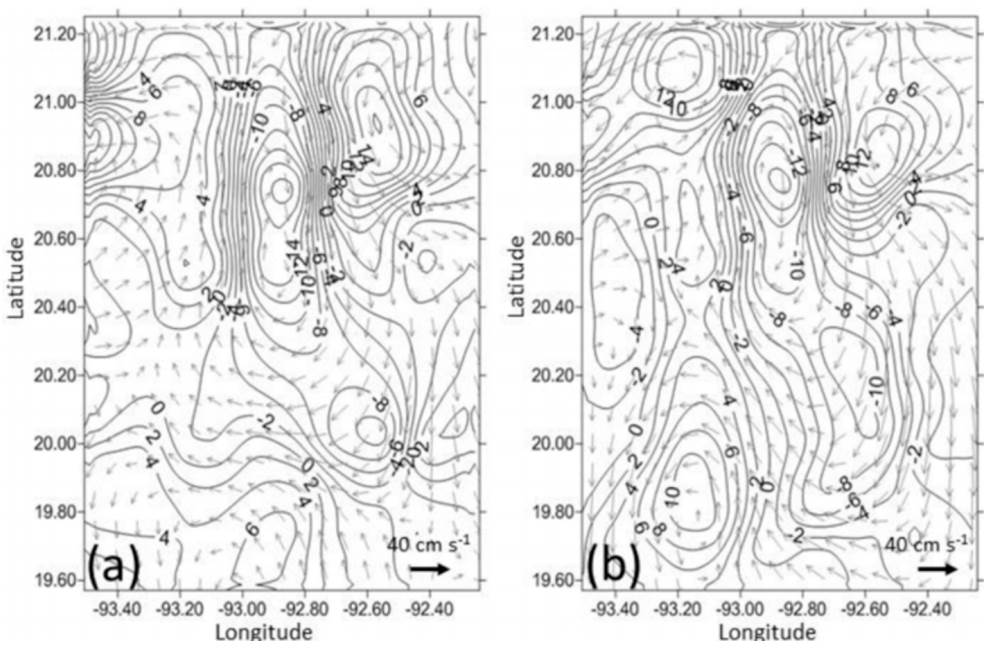
Figure 6 Vorticity (× 10-6 s-1) solid lines, and geostrophic currents (cm s-1) arrows. a) 4 m and b) 50 m deep.
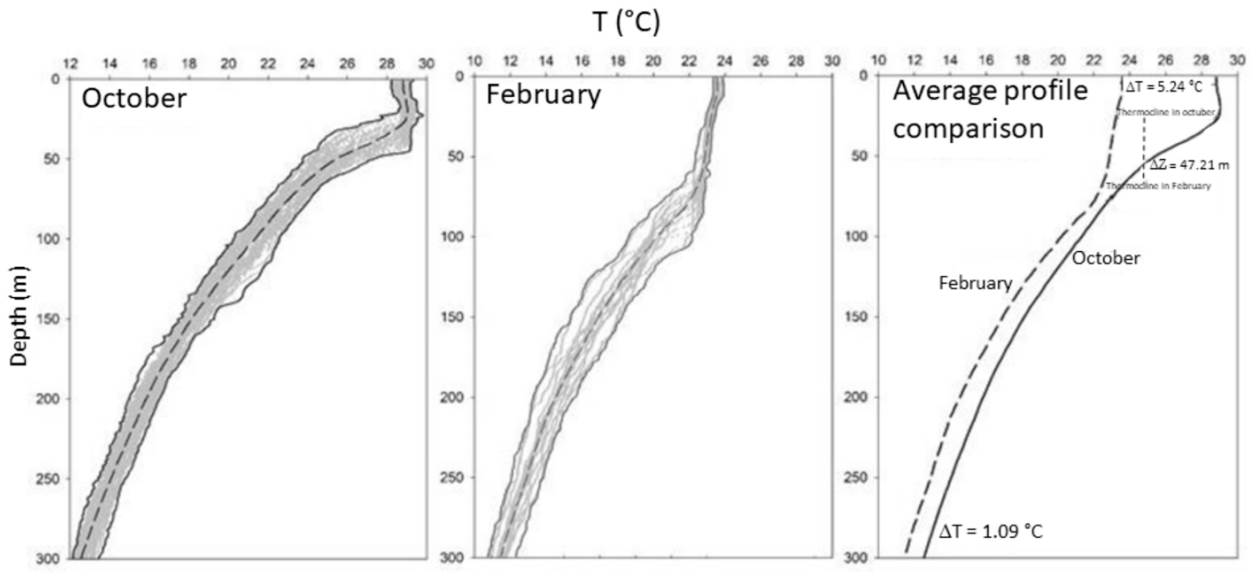
Figure 7 Temperature profiles, all (gray dots), minimum (solid black line to the left of the profiles), average (broken line in the center of the profiles), maximum (solid black line to the right of the profiles), and comparison of the average profiles in which the difference in surface temperature (∆T = 2.24 °C) and the difference in the depth of the thermocline (∆Z = 47.21 m) are shown for the October, February, and average samplings respectively.
In October, no atmospheric process can influence the mixing of the water column, and only cyclonic and anticyclonic eddies were observed mainly in zone III. These hydrodynamic characteristics were found in the topographies of the 15 °C, 18.5 °C, and thermocline layers (Fig. 8) and influenced euphausiid distributions (Fig. 3).
Euphausiids were distributed at the peripheries of cyclonic and anticyclonic eddies in October when the water column exhibited marked stratification and when hydrodynamic processes were more evident than in February (Figs. 8, 9). The euphausiids showed a preference for areas such as the fronts or peripheries of the cyclonic and anticyclonic eddies. During February, the water column exhibited a mixture from the surface to a depth of 200 m, which favored the distribution of euphausiids throughout the water column.
Four water masses were evidenced by temperaturesalinity (T-S) diagrams and according to the classification of Durán-Campos et al. (2017) and Portela et al. (2018): 1) Tropical Atlantic Central Water characterized by 8 < T < 20 ºC and 35.1 < S < 36.6 g kg-1, 2) Gulf Common Water characterized by 22 < T < 28 °C), and absolute salinity of 36.2 < S < 36.4 g kg-1, 3) Caribbean Subtropical Underwater with 22 < T < 26 °C), and absolute salinity of 36.4 < S < 36.6 g kg-1, and 4) North Atlantic Subtropical Underwater characterized by 20 < T < 25 ºC and absolute salinity of > 36.8 g kg-1. The last 2 occurred in the top 150 m of the water column. The highest abundances were found in the waters of the Caribbean Subtropical Underwater in February (Fig. 10).
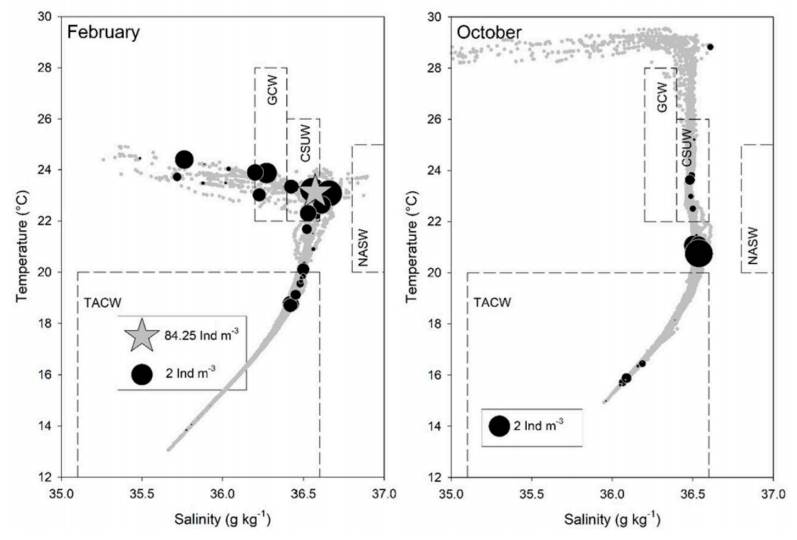
Figure 10 T-S diagram and euphausiid abundances according to the classification of water on the Gulf of Mexico by Durán-Campos et al. (2017), and Portela et al. (2018), during February 2011 and October 2012. The solid black circle dimension is proportional to the total euphausiid abundances (Ind m-3), and the star is a sample with very high values that goes off the scale. In the lower-left part, the corresponding scales for the abundances and station with a very high value are shown. Tropical Atlantic Central Water (TACW), Gulf Common Water (GCW), Caribbean Subtropical Underwater (CSUW), and North Atlantic Subtropical Underwater (NASUW).
Euphausiid distributions were affected by the dissolved oxygen concentrations in the water column; these organisms can survive at low dissolved oxygen concentrations (Figs. 4, 5). The euphausiids showed a wider distribution in the whole water column in February, when the dissolved oxygen concentration was rather low (258.58 µmol L-1) than in October when the oxygen concentration was slightly higher (262.16 µmol L-1 at 100 m depth).
Regarding Chl-a concentrations, it was observed that in February, the highest abundance of euphausiids was above and below the deep chlorophyll maxima that were rather narrow and located above the thermocline at approximately 70 m depth (Fig. 4). In October, the highest euphausiid abundance was recorded below the deep chlorophyll maxima, located at approximately 50 m depth below the thermocline and was wider than those found in February (Fig. 5).
Chl-a concentrations higher than 1 mg m-3 were recorded in 84% of the stations in February, but only in 40% of the stations in October. The maximal Chl-a concentrations per zone in February and October were 1.917 and 1.428 mg m-3 for zone I (station 19), 2.140 and 1.736 mg m-3 for zone II (stations 31 and 21, respectively), 2.127 and 1.215 mg m-3 for zone III (station 39), and 1.473 and 2.015 mg m-3 for zone IV. Thus, in February, the highest Chl-a concentrations were recorded in zones II and III, which also had the highest euphausiid abundance. In October, the zones with the highest fluorescence concentrations (zones IV and II) also corresponded to the highest euphausiid abundance. However, no significant correlation was observed between Chl-a and euphausiid abundance.
According to the Bray-Curtis dissimilarity index conducted in February, 3 groups and a separate station were determined (Fig. 11). The first group consisted of 8 stations, of which 75% were nightly samplings. The mean abundance (0.678 Ind m-3) and diversity (1,337 bits Ind-1) of this group were higher than those of groups 2 and 3. The mean temperature and salinity (19.67 °C and 36.20 g kg-1, respectively) were lower than those of the other groups. The second group consisted of 5 stations located on the continental shelf, zone I, of which 60% were daytime samplings. The dissimilarity between this group and the other 3 groups was mainly due to the higher Chl-a concentrations (0.413 mg m-3). The third group consisted of 11 stations, of which 81% were daytime samplings. This group was dissimilar to other groups due to lower values of euphausiid abundances, diversities, and Chl-a concentrations (0.042 Ind m-3, 0.056 bits Ind-1, and 0.165 mg m-3, respectively) and higher values of temperatures and salinities (23.65 °C and 36.49 g kg-1). Finally, a single station (station 9) registered an abundance higher than all other stations (8.65 Ind m-3); for this reason, it was separated from the other stations. This site presented low diversity since the abundance was attributable to furciliae.
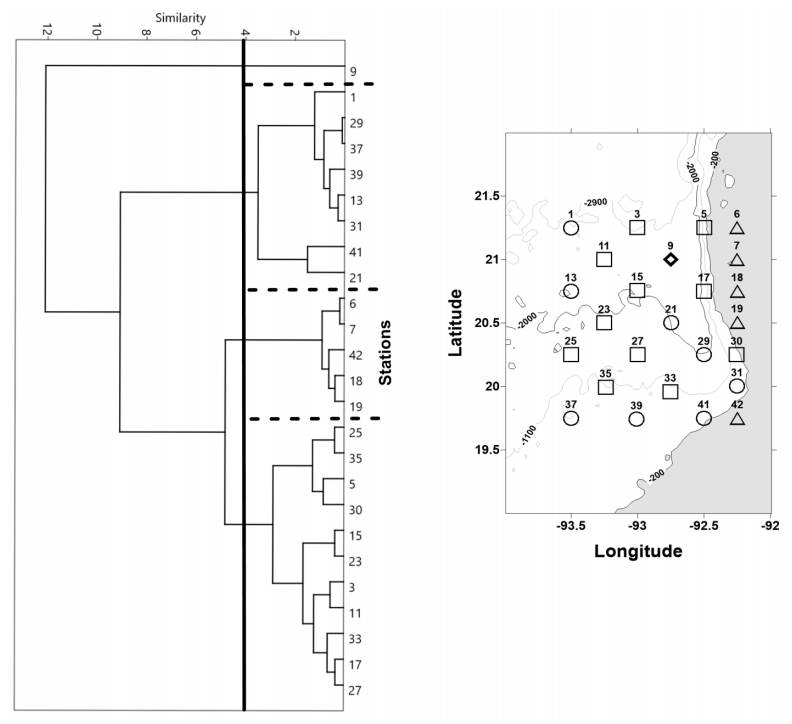
Figure 11 Dendrogram generated using dissimilarity cluster analyses with Bray-Curtis applied to euphausiid abundance, and group distributions of the stations in the study area during February 2011: group I, circles - ●; group II, triangles - ▲; group III, squares - ■; and an isolated rhombus station.
The Bray-Curtis dissimilarity analysis performed in October produced 3 groups (Fig. 12). The first group consisted of 19 stations, of which 53% were daytime samplings; these sites were located within and on the periphery of a cold water body (cyclonic eddy) in zones II and III. This group exhibited similarities among its stations due to higher diversity (1,195 bits Ind-1), lower temperatures (17.6 °C), and Chl-a (0.090 mg m-3), compared to the other 2 groups.
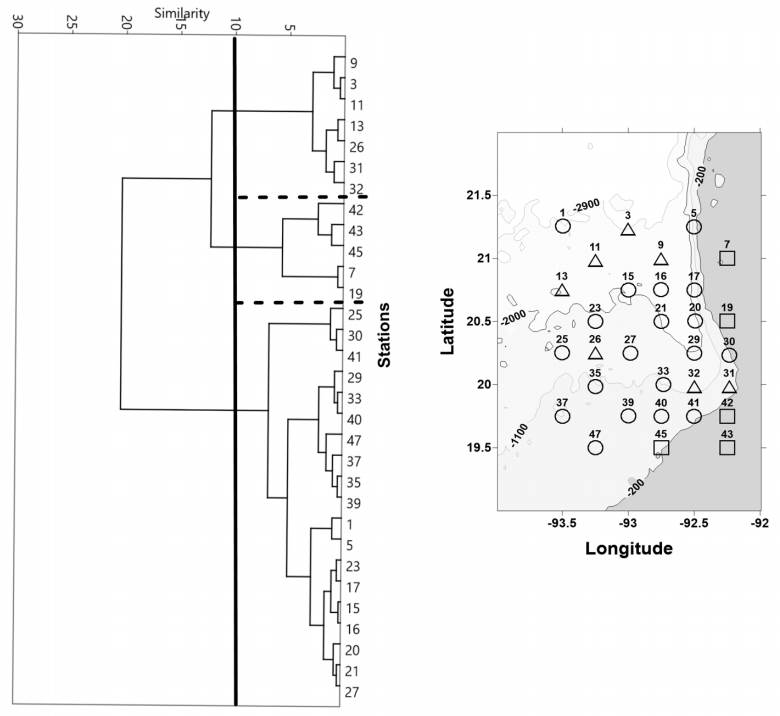
Figure 12 Dendrogram generated by dissimilarity cluster analyses with Bray-Curtis applied to euphausiid abundance, and group distributions of the stations in the study area during October 2012: group I, circles - ●; group II, triangles - ▲; group III, squares - ■.
The second group consisted of 7 stations, which were mainly sampled during the day (57%) located in zones II and III. The mean abundance was 0.434 Ind m-3, and the mean diversity was 1,147 bits Ind-1. Finally, group 3 consisted of 5 stations, of which 60% were night samplings and were located on the continental shelf of zones I and IV. This group showed lower mean abundance and diversity (0.230 Ind m-3, 0.254 bits Ind-1) and higher Chl-a and salinities (26.3 °C, 0.360 mg m-3, and 36.50 g kg-1) than those of the other 2 groups.
From the principal component analysis (PCA), in February, temperature and dissolved oxygen had the highest effect on variance; the first principal component had large positive associations with temperature and salinity, followed by dissolved oxygen. The second component had positive associations with oxygen and negative associations with Chl-a and temperature. The abundance presented an association of almost zero with the first component and a high positive association with the second component; diversity showed a high negative association with component 1 and a low positive association with component 2. (Fig. 13). Temperature and dissolved oxygen primarily influenced variance in both February and October. The second component had a negative association with oxygen and a positive association with salinity. In this sampling, abundance presented a low negative association with the first component and a high positive association with the second component; diversity showed a high negative association with component 1 and a low positive association with component 2 (Fig. 13).
Discussion
Studies on the abundance, diversity, and distribution of euphausiids and their relationships with hydrodynamic processes in the Gulf of Mexico are scarce, and this research is, to our knowledge, the first in this regard for Campeche Canyon. The 24 euphausiid species from the genera Eufausia, Nematobrachion, Nematoscelis, Stylocheiron, and Thysanopoda -found in the Campeche Canyon during this study- represent 80% of the species reported by Brinton (1996) and Kinsey and Hopkins (1994), which are greater than those reported by Castellanos and Gasca (1999) and Gasca et al. (2001) for the Gulf of Mexico. These authors reported between 17 and 19 species of euphausiids from the same genera that were identified in this investigation, except for Thysanoessa. All euphausiid species reported by Castellanos and Gasca (2002) for the Mexican Caribbean were detected in our study area, Campeche Canyon, except for Thysanopoda monacantha.
Stylocheiron carinatum, the dominant species during our study in both February and October, displayed a relative abundance (34.1% of total abundance) higher than that reported by Gasca et al. (2001) for the same area (28%) but lower than those previously reported in the Mexican Caribbean by Castellanos and Gasca (2002) (49%) or in various investigations in the Gulf of Mexico (Castellanos & Gasca, 1996, 1999; Gasca et al., 2001). These differences may be due to the minimal vertical migration of the genus Stylocheiron (Kinsey & Hopkins, 1994), which explains that it can be found in the water column from the surface to 200 m depth during the day and at night, as was observed in this investigation. Euphausia tenera, another important species during this study, exhibited relative abundances (24.4% in February and 16.8% in October) similar to that recorded in the Gulf of Mexico (20.1%) by Gasca et al. (2001) and higher than that reported in the Mexican Caribbean (7.8%) by Castellanos and Gasca (2002).
Stylocheiron carinatum, E. americana, and E. tenera comprised 73.5% of the total abundance in February and 77.9% in October, which were similar to the values reported (75%) by Gasca et al. (2001) and Castellanos and Gasca (2002) in the Gulf of Mexico for the same 4 species of euphausiids.
Additionally, in the present study, different developmental stages of euphausiids were identified, ranging from the early stages (e.g., calyptopis and furcillias) to juvenile stages and adults; the former were of euphausiids. the most abundant (88.3%) in February and (72.6%) in October, while the adult were less abundant (i.e., 11.7% developmental stages of euphausiids were identified, in February and 27.4% in October), which agrees with the ranging from the early stages (e.g., calyptopis and results of Rivera-Gómez and Giraldo (2019), who recorded a higher proportion of calyptopis and furcilia stages than adults. In this study, adult euphausiids with abundance of less than 0.2% were also recorded during the night in zones II and III of Campeche Canyon at epipelagic depths in both February and October. This agrees with the diel behavior of these organisms, being mesopelagic during the day and migrating to epipelagic strata between 100 and 200 m at night (Bonden et al., 1955; Brinton, 1962), which represents a strategy for avoiding visual predation (Kinsey & Hopkins, 1994; Mujica & Pavez, 2008).
The high abundance of euphausiids detected in zone I can be attributed to the proximity to the continental slope because areas near the continental shelves are known to be edges where euphausiids can avoid predators (Nicol, 2006; Reid et al., 2004; Trathan et al., 2003). Therefore, shelves and slopes are predictable places where euphausiids can be found, which thus become key habitats where these organisms can develop.
The high euphausiid abundances found in zones II and III may be a consequence of the hydrodynamics in this region, such as the well-known cyclonic and anticyclonic eddies (Aldeco et al., 2009; Durán-Campos et al., 2017; Santiago-Arce & Salas-de-León, 2012). Additionally, it is known that in the Campeche Canyon, food retention is caused by eddies and currents present there (Nicol, 2006; Reid et al., 2004; Thorpe et al., 2007). Furthermore, in this study, high abundances of euphausiids were also associated with thermal fronts in agreement with investigations showing that marine organisms preferably aggregate at thermal fronts due to transport by hydrodynamic processes (Spear et al., 2001; van Franeker et al., 2002). However, our result is different from that reported by Riquelme-Bugueño et al. (2015), who observed high abundances of euphausiids in the center of a cyclonic gyre. This pattern (Spear et al., 2001; van Franeker et al., 2002). However, our result is different from that reported by Riquelme-Bugueño et al. (2015), who observed high abundances of euphausiids in the center of a cyclonic gyre.
The eddies in the Campeche Canyon are hydrodynamic processes that influence the resuspension of organic matter and may lead to increased food availability and, therefore, increased euphausiid abundances. These eddies favor the development of phytoplankton and trophic webs in marine ecosystems (Mann & Lazier, 1991).
In the Campeche Canyon, high concentrations of Chl-a were detected in the areas of fronts between eddies, corroborating the high influence of these hydrodynamic processes on productivity in areas of the open sea. Vertical Chl-a concentration profiles recorded in the present study from February to October indicated that there were mesotrophic and eutrophic zones in the Campeche Canyon, according to the classification presented by Koblentz-Mishke and Vedernikov (1977) who defined these zones as water masses presenting Chl-a concentrations between 0.09 and 0.21 mg m-3 and > 1 mg m-3, respectively. In our study, the water masses in the axis of the canyon and above the head (zone II) met eutrophic situations, with concentrations of up to 2.14 mg m-3 in February and 1.43 mg m-3 in October. The diversity of localized water masses in the Campeche Canyon emphasizes the theory of Fabio et al. (2010). They commented that submarine canyons are places of high productivity despite being oligotrophic in their adjacent areas since productivity is increased in these sites because of the hydrodynamic processes that can increase their productivity by up to 100 times compared to open-sea areas (De Leo et al., 2010; Robert et al., 2015; Santora et al., 2018; Tyler et al., 2009; Vetter et al. 2010). This is what we observed in the present study.
Following the above discussion, zone II at the canyon head presented 3 times higher productivity (abundance of euphausiids) than the rest of the region. Gennin (2004) commented that updrafts were generated in areas of abrupt topography that improved the local production of zooplankton, as was observed in zone II. In addition, water entry through the Yucatán Channel favors fertilization of the euphotic layer (Salas-de-León et al., 2004); this water moves to the Campeche Canyon and provides nutrients to the euphotic layer by Ekman pumping, thus promoting biological production. This indicates that suspended matter concentrations also increase at these sites, which may be due to the transport of organic matter from coastal areas to the deep ocean (Canals et al., 2006; Company et al., 2008), which leads to high abundance of euphausiids, as was observed in the southern part of zone II.
The Campeche Canyon is characterized as a region with heterogeneous habitats. This is due to its hydrodynamic processes and high Chl-a concentrations (Gilinsky, 1984; Vetter, 1998), which favor the abundance and diversity of euphausiids. It is worth mentioning that the highest Chl-a concentrations (2.14 and 1.43 mg m-3) measured in this study were higher than those previously recorded (June 2002) by Durán-Campos et al. (2017) in the Campeche Canyon (0.02 and 0.42 mg m-3) and Signoret et al. (1998) in the Gulf of Mexico and the Caribbean Sea (0.33 mg m-3).
The distribution pattern of euphausiids in the water column showed 2 characteristics. The first property refers to the early stages of development that were mainly distributed from the subsurface and in the first 50 m of depth. This pattern may be due to the small size of the calyptopis, and undeveloped pleopods diminish their ability to migrate vertically (Sutton & Beckley, 2017), thus restraining them to the surface. Both calyptopis and furcilia have low or no vertical migration because they are small organisms and are carried by water masses. Coupled with this, since they are almost imperceptible to predators (Barange, 1990), they can remain in surface waters where they can find their food, in contrast to adults who develop vertical migration according to their food requirements and avoidance of predation. On the other hand, Knight (1984) and Suh et al. (1993) comment that as furcilia grow, they acquire appendages with which they develop a greater swimming capacity and therefore can carry out diurnal migration in the water column.
Mauchline (1980) and Pillar et al. (1989) noted that the vertical distribution could be the result of ontogenetic stratification, where the early stages inhabit shallow waters and the mature stages with greater mobility inhabit deeper strata, particularly during the day (Sutton & Beckley, 2017). Furthermore, the degree of vertical migration of euphausiid species through the water column can be influenced by environmental tolerances (Barange, 1990; Brinton, 1979; Hirota, 1987; Sameoto et al., 1987; Taki, 2008; Werner & Buchholz, 2013), as observed in the February and October samplings.
In this study, no relationship was found between the high abundance of adult euphausiids and Chl-a maxima. This indicates that adult euphausiids can survive under resource pressure (scarce food) and that strategy helps them avoid predation (Ainley et al., 1991, 2006).
Water column conditions play an important role in the distribution of euphausiids because when there is a deep mixed layer (February sampling), the organisms can be distributed along the column. However, in a stratified water column (thin mixed layer; October sampling), the distribution of euphausiids is restricted to places where conditions are favorable. These characteristics influence population factors (e.g., spawning success, mortality, and recruitment) and behavioral factors (e.g., vertical and horizontal migrations) that modify euphausiid distributions (Kinsey & Hopkins, 1994; Siegel, 2000).
Euphausiids are organisms that search for places where the temperature, oxygen concentrations, food, and shelter conditions are adequate. The vertical and horizontal migrations exhibited by euphausiids allow greater independence than other zooplanktons. Greater independence from currents diminishes the effects of physical processes such as upwelling and eddies, except when they benefit from food and water (Marín et al., 2001).
The euphausiid diversity observed in February resulted from the mixing of the water column; this mixing favored the presence of adult organisms from the surface to 200 m depth, whereas in October, high diversity and abundance were found only between 100 and 200 m depth. The diversity index obtained in this study was higher than those determined in the Gulf of Mexico and the Caribbean Sea (Castellanos & Gasca, 2002; Gasca et al., 2001). In February, greater diversity was observed than in October, and this pattern was related to temperature, oxygen, and food conditions. In February, the marked temperature differences led the euphausiids to be located throughout the water column, unlike in October, as stated by Endo and Yamano (2006), Nakagawa et al. (2003), and Werner and Buchholz (2013).
The Campeche Canyon is a region where high biological productivity is induced by hydrodynamic processes. This was evidenced by the number of species found in this study, which was higher than that reported for the Gulf of Mexico. In both samples, the greater abundance of euphausiids was due to individuals in the early stages of development (mainly furciliae) compared to adults and was not distributed in the water column according to the maximum peaks of Chl-a concentrations.
The influence of winter storms decreased water column temperatures, deepened the thermocline (deep mixed layer; February 2011), and favored euphausiids in their abundance and distribution. The different situations in October, where there were no conditions that mixed the water column (a shallow mixed layer), resulted in a stronger thermocline and stratified water column; therefore, euphausiids were distributed only in the lower levels where the temperatures were colder.
The presence of some mesopelagic euphausiid species during the night demonstrated the vertical migration which they exhibited and that this can be observed between hundreds of meters up to the surface. Finally, the diversity recorded in the Campeche Canyon was higher than that in the Gulf of Mexico and the Caribbean Sea; this result, along with the high phytoplankton productivity found in this study, confirmed that underwater canyons are places of high productivity.


 nueva página del texto (beta)


