A recurrent issue in plant ecology is to elucidate the key factors that influence species distribution and assemblages of communities (Tilman, 1982; Huston, 1994; Scott et al. 2002). Previous studies had proposed that plant species distribution within communities is mainly driven by stochastic processes (Brokaw and Busing, 2000; Hubbell, 2001; Tilman, 2002; Huston, 2002; Tuomisto et al. 2003). In contrast, other studies had proposed that plant spatial distribution and assemblages of species within a community are determined by the adaptation of species to the available resources and heterogeneity of the environment (Tilman, 1982; Tokeshi, 1999; Ackerly, 2003; Cavender-Bares et al. 2004; Ackerly et al. 2006; Kelly et al. 2008; Mills, 2009; Pérez-Ramos et al. 2012; de la Riva et al. 2014). However, the analyses of environmental factors determining plant species distribution and plant community composition at different spatial scales are still a recurrent theme in community ecology.
Mexico with the complexity of its orography has promoted habitat partitioning and species diversification (Rzedowski, 1978; Villaseñor, 2003; 2004). Particularly, Mexico is considered the center of diversification of several plant groups including the genus Quercus L. (oaks) (Villaseñor, 2004; Nixon, 2006). Most of oak species are endemic to the country with a particular pattern of distribution (Nixon, 1993; Abrams, 2003; Valencia-A., 2004; Nixon, 2006; Torres-Miranda et al. 2011; Torres-Miranda, 2014). At a continental scale, white oaks (section Quercus) occur in drier and warmer environments than red oaks (section Lobatae), which are distributed in more humid and colder sites (Zavala-Chávez., 1998: Abrams, 2003; Valencia-A., 2004; Mills, 2009; Torres-Miranda, 2009; Torrez-Meza et al. 2009; Rodríguez-Trejo and Myers 2010). Furthermore, closely-related oak species tend to diverge in their habitat preferences to avoid competition, as well as in response to environmental factors (Torrez-Meza et al. 2009; Olvera-Vargas et al. 2010; Pérez-Ramos et al. 2012; de la Riva et al. 2014). Particularly, nutrient availability and fire regime, topography, soil and altitude frequency have influenced oak distribution (Abrams, 1990; 2003; Cavender-Bares et al. 2004; Meave et al. 2006; Olvera-Vargas et al. 2010; Rodríguez-Trejo and Myers 2010; de la Riva et al. 2014). However, it is still unknown if these patterns of oak distribution hold at regional scales.
On the other side within communities, it is thought that species coexistence is promoted if they have a contrasting resource use strategy, are temporally separated at some point of their life stage, (Nakashizuka, 2001; Silvertown, 2004; Cavender-Bares and Pahlich 2009) or develop positive synergic effects between each other (Kaye et al. 2000; Gartner and Cardon 2004; Chávez-Vergara et al. 2014; 2015). Recently, it was detected that the association of two oak species produce higher nutrient availability, which resulted advantageous for one of the species (Chávez-Vergara et al. 2014; 2015). Although, this exhibited the benefits of species coexistence, the evidence supporting the frequency of the associations between oak species is still scant.
In this study, we analyzed the structure of oak communities at a landscape scale in a basin located in Central Mexico. We studied 78 plots distributed in different oak fragments within the Cuitzeo basin (> 4,000 km2) in Michoacán state, Mexico. In the Cuitzeo basin, it has been reported that precipitation increases and temperature decreases from north to south of the basin (Mendoza et al. 2006; Leal-Nares et al. 2010). The aim of the study was to detect whether oak species have a defined pattern of distribution, and if the environment influences such pattern. We were also interested to determine associations between pairs of species based on the oak species environmental affinities. Particularly, the objectives of this study were to: i) know the patterns of spatial distribution of oak species at a landscape scale; ii) determine the environmental factors affecting oak species distribution, and iii) know the degree of association between pairs of oak species.
Methods
Study area. The Cuitzeo basin has 4,026 km2 and it is located at 19º 30’-20º 05’N and 100º 35’-101º 30’W in the Trans-Mexican Volcanic belt between the States of Michoacán and Guanajuato (Figure 1). Climate at the basin is temperate with a marked rainy season during summer months (June to September), but it has been detected that precipitation increases while temperature decreases from south to north and with altitude (Mendoza et al. 2006). The mean annual temperature ranges from 14 to 20 ºC, and the average annual precipitation ranged from 646 to 1,402 mm (Leal-Nares et al. 2010). The soils and the topography of the study area are product of the volcanic activity from Quaternary (Mendoza et al. 2006; Chávez-Vergara et al. 2014). The dominant soils are vertisols, luvisols, leptosols, acrisols and andosols (Mendoza et al. 2006). The oak forests (Quercus) are the predominant vegetation type; however, as a consequence of land-use change, they are very fragmented (Mendoza et al. 2006). The development of urban areas, the expansion of agriculture and the production of oak charcoal are the principal threats for these forests (Mendoza et al. 2006; Aguilar et al. 2012; Herrera-Arroyo et al. 2013).
A total of 78 oak forest fragments were selected within the Cuitzeo basin. A plot of 100 × 20 m (15.6 ha) was established within each forest fragment, in which all oak trees with a ≥ 5 cm of diameter at breast height (dbh) were identified and it height and dbh was measured. For each site, the altitude, inclination and orientation of the slope were obtained with a digital elevation model framed on GIS ArcView ver. 3.3 (ESRI, 1999).
Nutrients and carbon content in litter and soil. Four transects of 1 × 100 m of length were established within each plot to quantify nutrient and carbon contents in both the surface litter and soil beneath it. In each transect, a soil sample was taken from the first 20 cm with a soil-core sampler every 20 m. The 20 soil samples extracted at each plot were evenly mixed and kept in a plastic bag. Five samples of litter were randomly collected at each plot with a polyvinyl chloride (PVC) ring with a diameter of 160 mm. Soil and litter samples were transported into the laboratory in a cooler, and stored in bags and placed in darkness at 4 ºC until analysis (Chavez-Vergara et al. 2014). In the laboratory, total forms of C, N and P were analyzed for both, soil and litter samples. The litter samples were oven-dried at 70 ºC for 72 hours. Thus, samples were grounded with a mill (Retsch MM400) and sieved trough a 40 mesh. Similarly, soil samples were oven-dried and grounded with a pestle and agate mortar. Total N and P were determined following acid digestion in a mixture of concentrate H2SO4 and K2SO4 plus CuSO4, the latter as a catalyst; N was determined by a micro-Kjeldahl method (Bremmer, 1996) and P by the molybdate colorimetric method following ascorbic acid reduction (Murphy and Riley 1962). The extraction was measured by colorimetry in an autoanalyzer (3Bran-Luebbe; Nordestedt, Alemania). Carbon analysis was done in a total carbon analyzer (UIC mod 5012; Chicago, USA) and determined by colorimetric detection (Huffman, 1977).
Climatic variables. First, to characterize the climate of each plot, nineteen bioclimatic variables derived from monthly precipitation and temperature values (period 1910-2009) were extracted at 30 arc seconds and downscaled using a digital elevation model at 30 m of resolution for the study area by Cuervo-Robayo et al. (2014) and Correa-Ayram et al. (in press), respectively. Nineteen climatic variables were finally extracted for each plot, using GIS ArcView ver. 3.3 (ESRI, 1999).
Statistical Analysis. Differences in composition between of oak forest fragments across the landscape were explored with a Non-metric Multidimensional Scaling Analysis (NMDS). For this analysis, we included all the presence data of the nine oak species from the 78 plots. Matrices of dissimilarity between plots were developed with the Bray-Curtis index (Faith et al. 1987). Differences in species composition between sites were evaluated with an analysis of similarities (ANOSIM). The ANOSIM included 999 random permutations to explore if dissimilarities between sites were statistical significant (following Warwick et al. 1990).
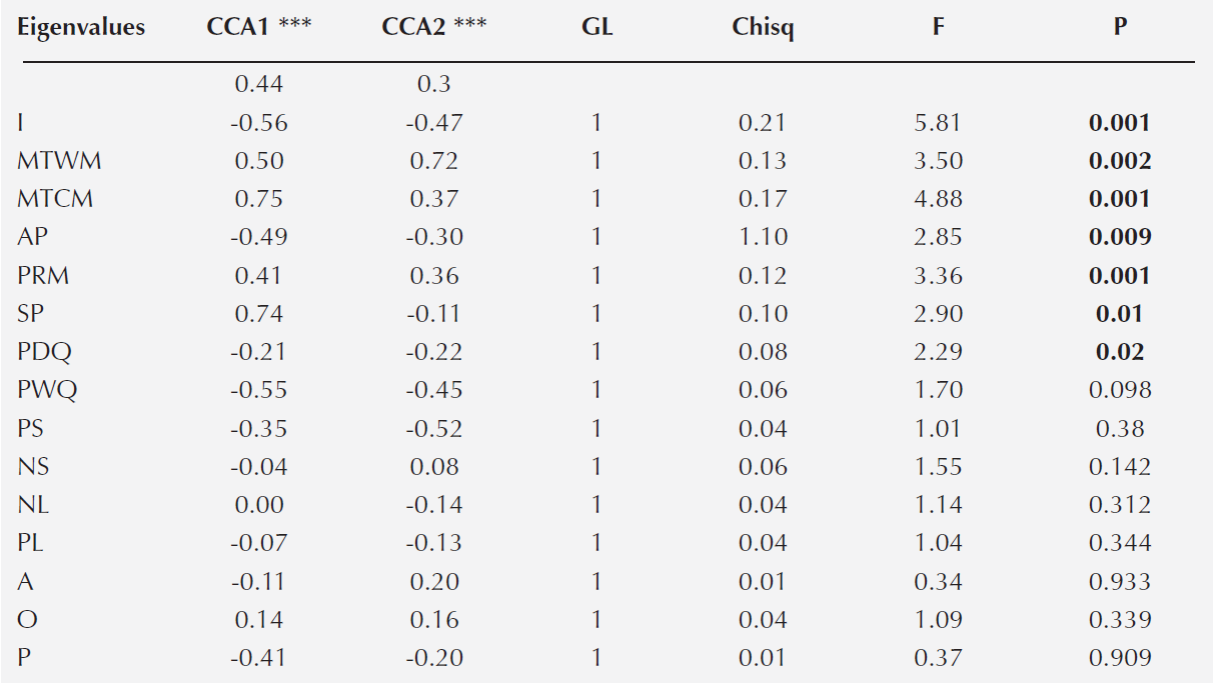
A Canonical Correspondence Analysis (CCA) was conducted to determine the relationship between oak species distribution and the environmental variables. First, the 19 variables extracted for each plot to characterize it climate were used to construct the CCA. However, to avoid errors associated with overrepresentation of the climatic variables, the collinearity between pair of characteristics was explored with Pearson paired-correlations (Marquínez et al. 2003). When a coefficient of determination ≥ 0.90 was detected between pair of variables, the climatic variable that had the least biological meaning was discarded (Thuiller et al. 2003). We only included the following climatic variables in the CCA: maximum temperature in the warmest month (MTWM), maximum temperature in the coldest month (MTCM), annual precipitation (AP), seasonality of the precipitation (SP), and precipitation at the driest quarter of the year (PDQ) (Table 1). At the same time the CCA included the soil and litter nutrient content and the topographic variables (Table 1). Overall, three environmental matrices were included in the CCA analysis; each one included climatic, soil and topographic variables (Table 1), and the species abundance matrix. All the environmental characteristics were log-transformed to satisfy normality. In the CCA analysis, we performed 999 permutations to evaluate the degree of significance of the CCA model, axes and variables (P = 0.001) (Table 3). Both CCA and NMDS were implemented in R with the vegan package (Oksanen et al., 2010).
Table 3 Canonical correspondence analysis. The two axes that explained the highest proportion of the variation (CCA1= 0.44; CCA2 = 0.30), the coefficient of correlation and the statistical analysis for each environmental variable are shown. The asterisk denotes significance (P) of each axis: *** = 0.001. In bold are the variables that were significant. Acronyms follow Table 1.
To detect associations or niche overlap between pair of oak species, we performed a Discriminant Analysis. The analysis included de abundance matrix and the environmental matrices from the CCA. However, to avoid overestimation of species distribution, this analysis included only the plots that had ≥ 10 individuals for each species. We calculated the centroid of each species at the multivariate space, and then we traced an ellipse on the data points representing the distribution of the species. When over positioning between the ellipses of two species was detected, we calculated the area of overlap with the Jaccard index. The index evaluates the degree of similarity between paired of data, and the value oscillates from zero to one (one equals to complete similarity between species niche). Discriminant analysis and species ellipses overlap were implemented in R with the ellipse package (Oksanen et al., 2010).
Results
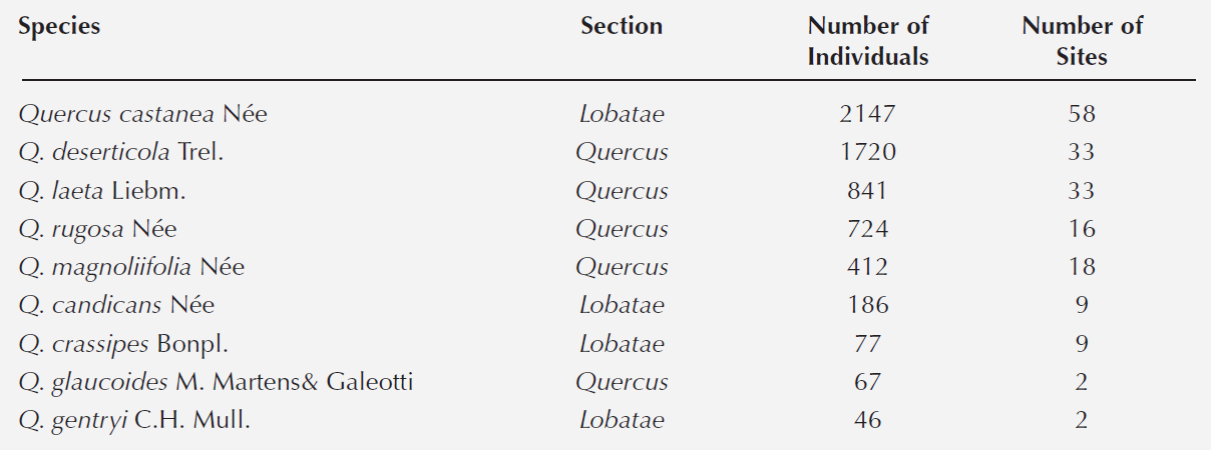
Oak forests community composition. A total of 6, 248 trees (≥5 cm of dbh) belonging to nine species of Quercus were recorded in the 78 fragments (Table 2). The most abundant species were Q. castanea, Q. deserticola, Q. laeta, Q. rugosa and Q. magnoliifolia; Q. gentryi and Q. glaucoides were found only in one and two fragments, respectively.
Table 2 List of species recorded at the 78 plots of the oak forests in the Cuitzeo lake basin, Michoacán, Mexico.
Species distribution at the landscape. The NDMS analysis exhibited that the two axis solution was the most parsimonious solution in explaining the variation of the fragments composition. Overall, the analysis showed variation in the composition between the 78 oak forest fragments, and therefore that Quercus species differed in their distribution pattern within the landscape (P < 0.01; Stress = 0.06; R 2 = 0.98) (Figure 2). At the two dimension-space, we detected three groups (ANOSIM R = 0.83, P < 0.001): Q. rugosa, Q. candicans and Q. crassipes define one group located at the south of the basin; a second group was composed by four species which were more frequent at the center of the basin, Q. castanea, Q. laeta, Q. magnoliifolia and Q. glaucoides; and Q. deserticola and Q. gentryi conformed a third group located in the northern part of the basin.
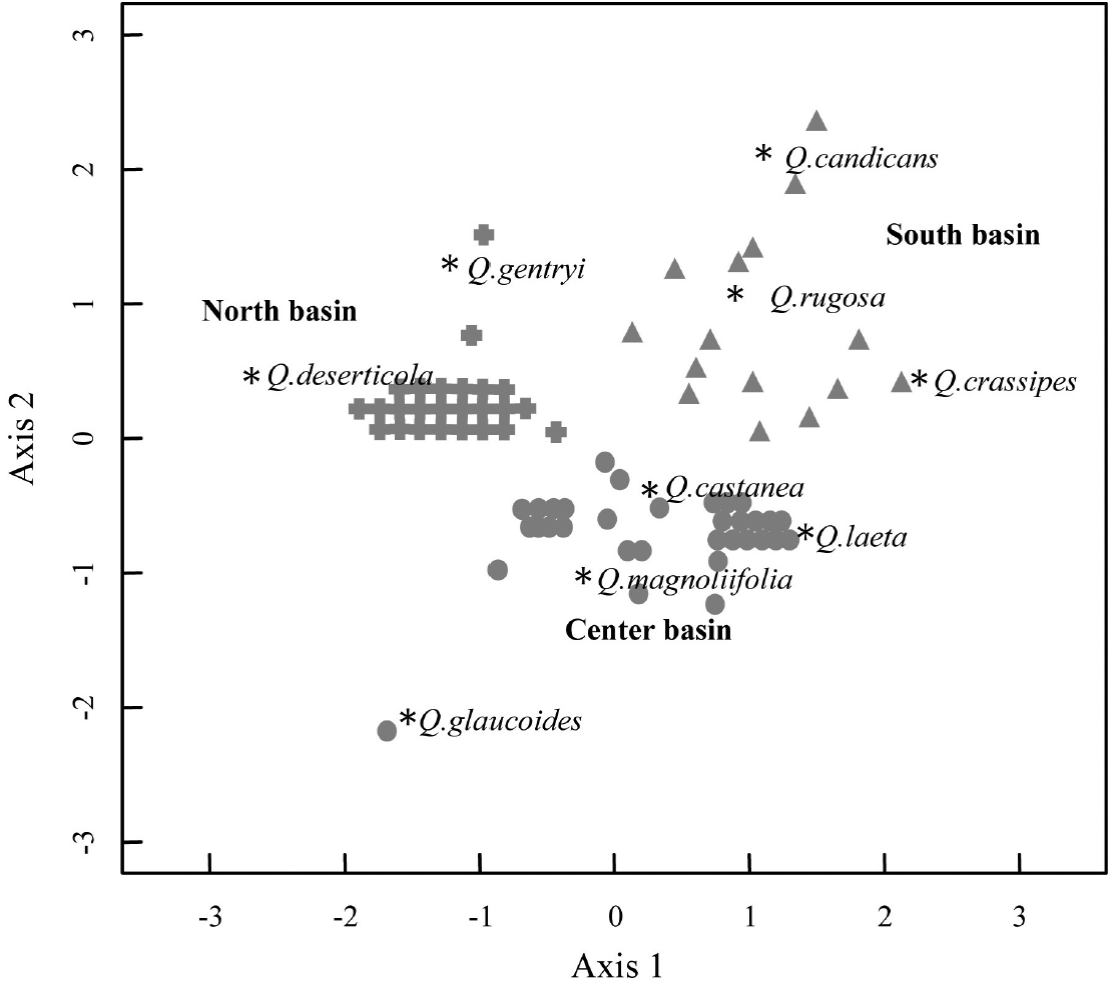
Figure 2 Non-metric multidimensional scaling (NMDS) that includes the species abundance data collected in the 78 plots of oak forests at the Cuitzeo lake basin. (P < 0.01; Stress 0.06, R2 = 0.98). The asterisks, triangles, circles and crossings indicate the relative position of the species and plots at the multivariate space, respectively.
Relationship between species distribution and environmental variability. The canonical correspondence analysis (CCA) explained a total of 35 % of the variation of the plot environmental variables and species distribution data (P < 0.001). The first two principal axes explained 59 % of the total variation (CCA1 = 0.35 and CCA2 = 0.24) (Figure 3). The variables that had a significant correlation with each axis were I, MTWM, MTCM, AP, SP and PDQ (Table 3). In general, the analysis demonstrated that the species distribution was related with a gradient of water availability and with variation in the temperature. Particularly, the sites with higher seasonality in the precipitation and higher temperature during the colder months were at the positive side of the first axis. In contrast, the sites with higher annual precipitation and with larger variation of the daily temperature were found at the other side of the first axis. The second axis was also related with the annual precipitation and with the temperature of the warmest month. The warmest sites were at the positive side of the axis, while the more humid sites were at the negative part of the axis.
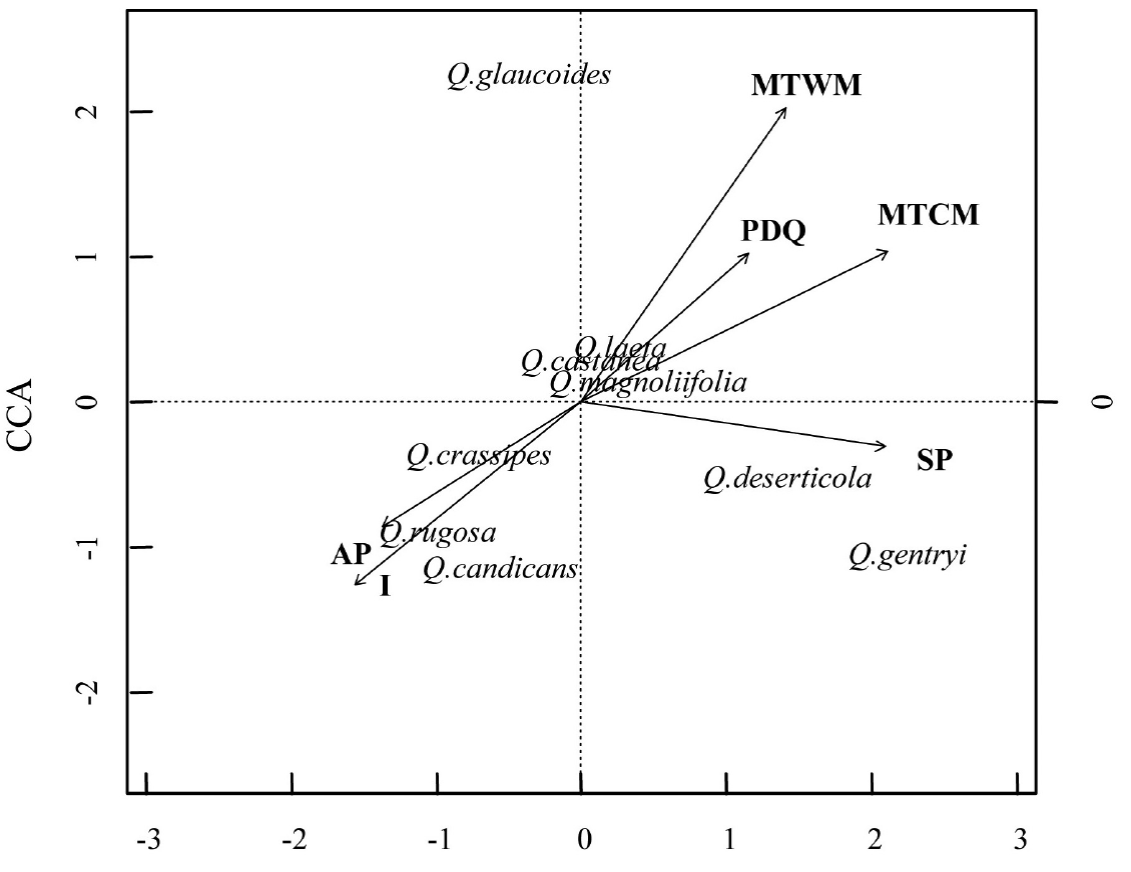
Figure 3 Canonical correspondence analysis. The analysis included presence/abundance, climate, soil and topography matrices for the 78 plots distributed at the oak forests of the Cuitzeo lake basin. The vectors indicate the variables that had a significant correlation with each axis (Table 3). The length and direction of the vectors indicate the strength and sign of the correlation, respectively.
Overall, the CCA showed that Quercus deserticola and Q. gentryi were located at sites with a marked dry season. In contrast, Q. crassipes, Q. candicans and Q. rugosa were placed at sites with higher daily variation in the temperature and with higher annual precipitation, while Q. glaucoides was located at sites with higher maximum temperatures during the warmest moths. Interestingly, Q. castanea, Q. magnoliifolia and Q. laeta were located at the center of the CCA space, which suggests that the environmental characteristics evaluated in this analysis were not related with their distribution.
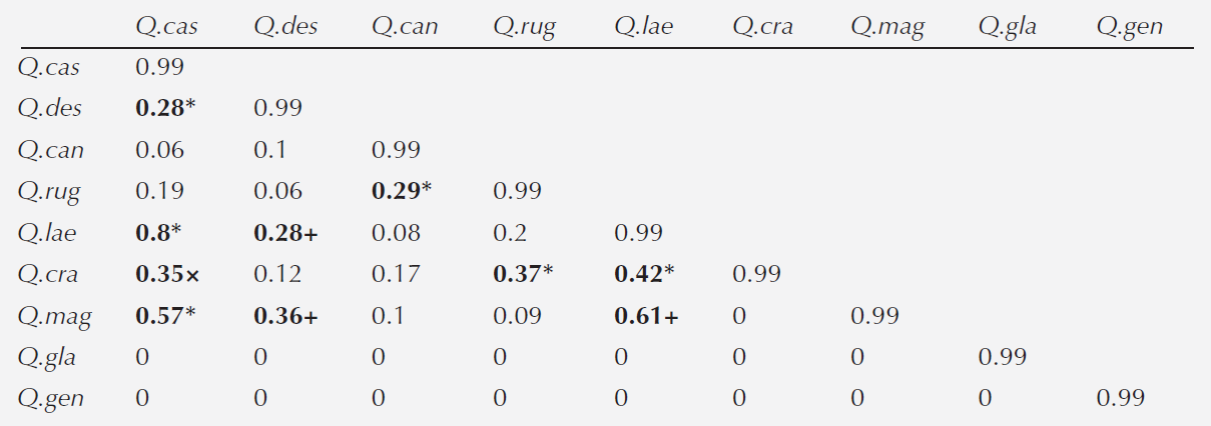
Association between species. The first two axes of the discriminant analysis explained 68 % of the variation (LD1 = 0.42 and LD2 = 0.26). The variables that defined the species niche were MTWM and MTCM for each axis, respectively (Table 4). In general, we detected six associations between species belonging to different sections (Lobatae and Quercus): Quercus castanea - Q.deserticola, Q. castanea - Q.laeta, Q. castanea - Q. magnoliifolia, Q. candicasns - Q.rugosa, Q.crassipes - Q. rugosa and Q.crassipes - Q. laeta. We also detected three associations between species within the Quercus section (Q.deserticola - Q.laeta, Q.deserticola - Q. magnoliifolia and Q.laeta - Q.magnoliifolia) and one association between species from the Lobatae section (Q.castanea - Q.crassipes) (Table 5).
Table 4 Discriminant Analysis. The table shows the two axes that explained the highest proportion of the variation (LD1= 0.42; LD2 = 0.26) and coefficients of linear discrimination for each variable. In bold are the variables with the higher coefficient of discrimination. Acronyms follow Table 1.
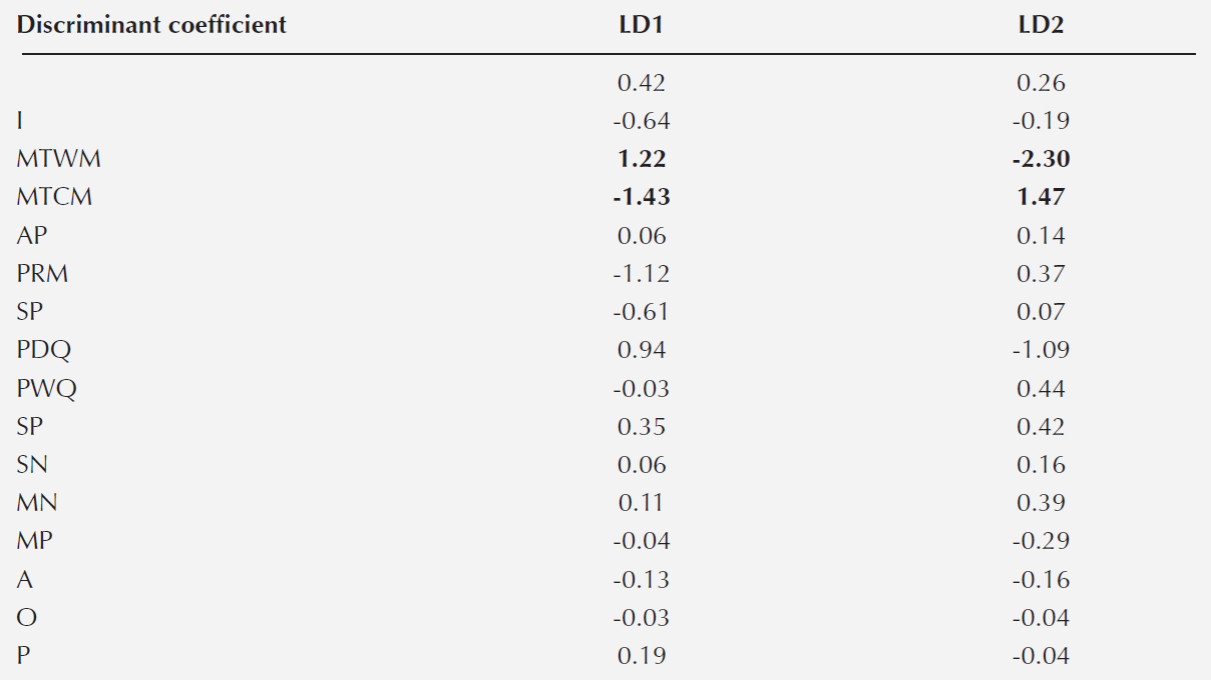
Table 5 Niche climatic overlap index between pair of oak species. The symbols denote associations between sections: *: Lobatae-Quercus; +: Quercus-Quercus; and ×: Lobatae-Lobatae. Species acronyms: Q. cas: Q.castanea; Q. des: Q.deserticola; Q. can: Q.candicans; Q. rug: Q.rugosa; Q. lae: Q.laeta; Q. cra: Q.crassipes; Q. mag: Q.magnoliifolia; Q. gla: Q.glaucoides; Q. gen: Q.gentryi.
Discussion
In this study, we detected that oak species distribution differs at the landscape level. Particularly, water availability and both rain and temperature seasonality were the most determining factors for the distribution pattern of oak species. However, the distribution of some oak species was not related neither with climatic nor edaphic factors. Overall, this suggests that at the study area oak species are segregated along the landscape, which might limit competition between them and therefore, facilitating their coexistence. Nevertheless, not all the variation was explained by the environmental gradients, implying that other factors, such as species interactions, might be influencing their distribution. However, we observed that some species are frequently associated between them, and this pattern of coexistence is more common between the more distantly related species.
Previous studies have established the climatic affinity of oak species (Kappelle and Van-Uffelen 2006; Nixon, 2006); for example Quercus glaucoides and Q. magnoliifolia in Mexico are more frequently observed at warmer and drier sites (Rzedowski, 1978; Fernández-Nava et al., 1998). Cuitzeo basin has a very complex topography, nevertheless, we observed that temperature and precipitation were guiding the species distribution, both factors vary strongly from north to south of the basin. In particular, we detected that the northern part of the basin has a marked dry season, receive less amount of precipitation and is warmer. In contrast, the southern part has a higher precipitation and lower temperature. This gradient of temperature and precipitation plays an important role determining oak species distribution at the landscape scale. Particularly, Q. deserticola, Q. glaucoides and Q. gentryi are more frequent at warmer and drier sites. In contrast, Q. candicans, Q. rugosa, Q. crassipes occur at sites that receive a higher amount of precipitation and lower temperatures. Interestingly, Q. castanea, Q. magnoliifolia and Q. laeta were located at the center of the CCA analysis, suggesting a clear relationship between the environmental variables included in the analysis and its distribution. Our study supports the findings from previous works where it has been reported that oak species distribution are affected by the variation of precipitation or soil moisture gradients (Cavender-Bares et al., 2004; Olvera-Vargas et al., 2010; de la Riva et al., 2014). Overall, this suggests that the pattern of distribution of the oak species might reflect functional adaptations to survive under water stress or to efficiently exploit high levels of water availability. However, the CCA analysis was only able to explain a fraction of the variation indicating that other factors might influence the species distribution.
The niche overlap analysis also confirmed the oak species partitioning of the environmental gradient and that the pattern of distribution was independent of the taxonomic section. We also detected associations between pair of species; the most frequent association occurred between distantly related species belonging to Quercus and Lobatae sections. The finding that two species share the same climatic niche suggests that they are functional equivalent. Nevertheless, a recent study had detected strong functional differentiation among these nine oak species (Aguilar-Romero personal communication). Two hypotheses could explain the association among oak species. The first one indicates that coexistence could be promoted by being temporally separated in their growth stages (i.e. acorn maturity and seedling establishment at different moments of the year) (Cavender-Bares and Pahlich 2009; Olvera-Vargas et al. 2010; Pérez-López et al. 2013) or by exploiting different areas of the soil water-table depth (López-Barrera et al. 2006; Pérez-López et al. 2013). Another hypothesis is that one of the species could get advantage from the presence of the other by positive synergic effects, which could promote the establishment and survival of both species in the same site (Chávez-Vergara and García-Oliva 2013). It has been shown that when more than two species inhabit the same area, the community of microorganisms increments its abundance and activity promoting higher soil nutrient availability (Gartner and Cardon, 2004). Therein, a recent study found that Quercus deserticola benefits Q. castanea by incorporating nutrients to the soil and facilitating the decomposition of litter (Chávez-Vergara and García-Oliva 2013; Chávez-Vergara et al. 2014; 2015). Overall, this complementarity effects might promote coexistence. Nonetheless, further research needs to be conducted to determine the generality of this mechanism among oak species.
Conclusions
Our study exhibits a non-random pattern of oak species distribution at the landscape level. The species distribution was mainly determined by the environmental heterogeneity within the basin. Particularly, we detected that species restricted to the south of the basin experience higher water availability and lower temperatures, at the other extreme species at the north, receive lower precipitation with a marked dry season and higher temperatures. Overall, the study suggests that oak species differ in their resource use strategy and in their tolerance to water stress, and that species segregate along the environmental gradient to avoid competition among them. However, part of the variation in the pattern of oak species distribution was not explained by the environmental heterogeneity. At the same time, we detected associations of species, being the most recurrent between species from different taxonomic sections, which suggests positive synergic interactions allowing coexistence of species.


 nueva página del texto (beta)


