Introduction
In the current public perception, 19 September is the date when large, destructive earthquakes occur in Mexico. The Michoacán earthquake of 1985 (M w8.0), which caused un-precedented deaths and damage in Mexico City, occurred on this date. The Puebla-Morelos earthquake of 2017 (M w7.1), which may have been the deadliest intraslab event in the history of Mexico City, also occurred on the same date. So, when on 19 September 2022 a subduction thrust earthquake (M w7.6) broke the Cocos-North American plate interface along the coast of Michoacán-Colima, there was general consternation and disbelief. The earthquake caused severe damage to many towns and cities in the states of Michoacán and Colima (EERI Preliminary Virtual Reconnaissance Report, 2022). The largest aftershock (M w6.7) that occurred on 22 September caused further damage and panic. Both of these events were felt strongly in the lake-bed zone of Mexico City, about 450 km away. The Mexican Seismic Alert System (SASMEX) performed well; the lead time for the arrival of strong motion in Mexico City was about 2 minutes (https://www.youtube.com/watch?v=NCjVeiIZADw).
The tectonic setting of the area of where the 2022 earth-quake occurred is shown in Figure 1. In the region, the oceanic Rivera (RIVE) and Cocos (COCOS) plates subduct below Mexico which forms part of the North American (NOAM) plate. The boundary between the RIVE and COCOS plates, as well as the relative convergence speed between the two plates, are controversial. Bandy et al. (1995) suggest that the subducted RIVE-COCOS boundary lies directly beneath the southern Colima Rift (SCR) and is parallel to it (Figure 1). The SCR extends from the city of Colima to the Middle America Trench and forms a part of the Colima rift. CO-COS-NOAM relative convergence rate at 17.9°N, 104.0°W is ~ 6.0 cm/yr in the direction 32.3ºN (DeMets et al., 2010).
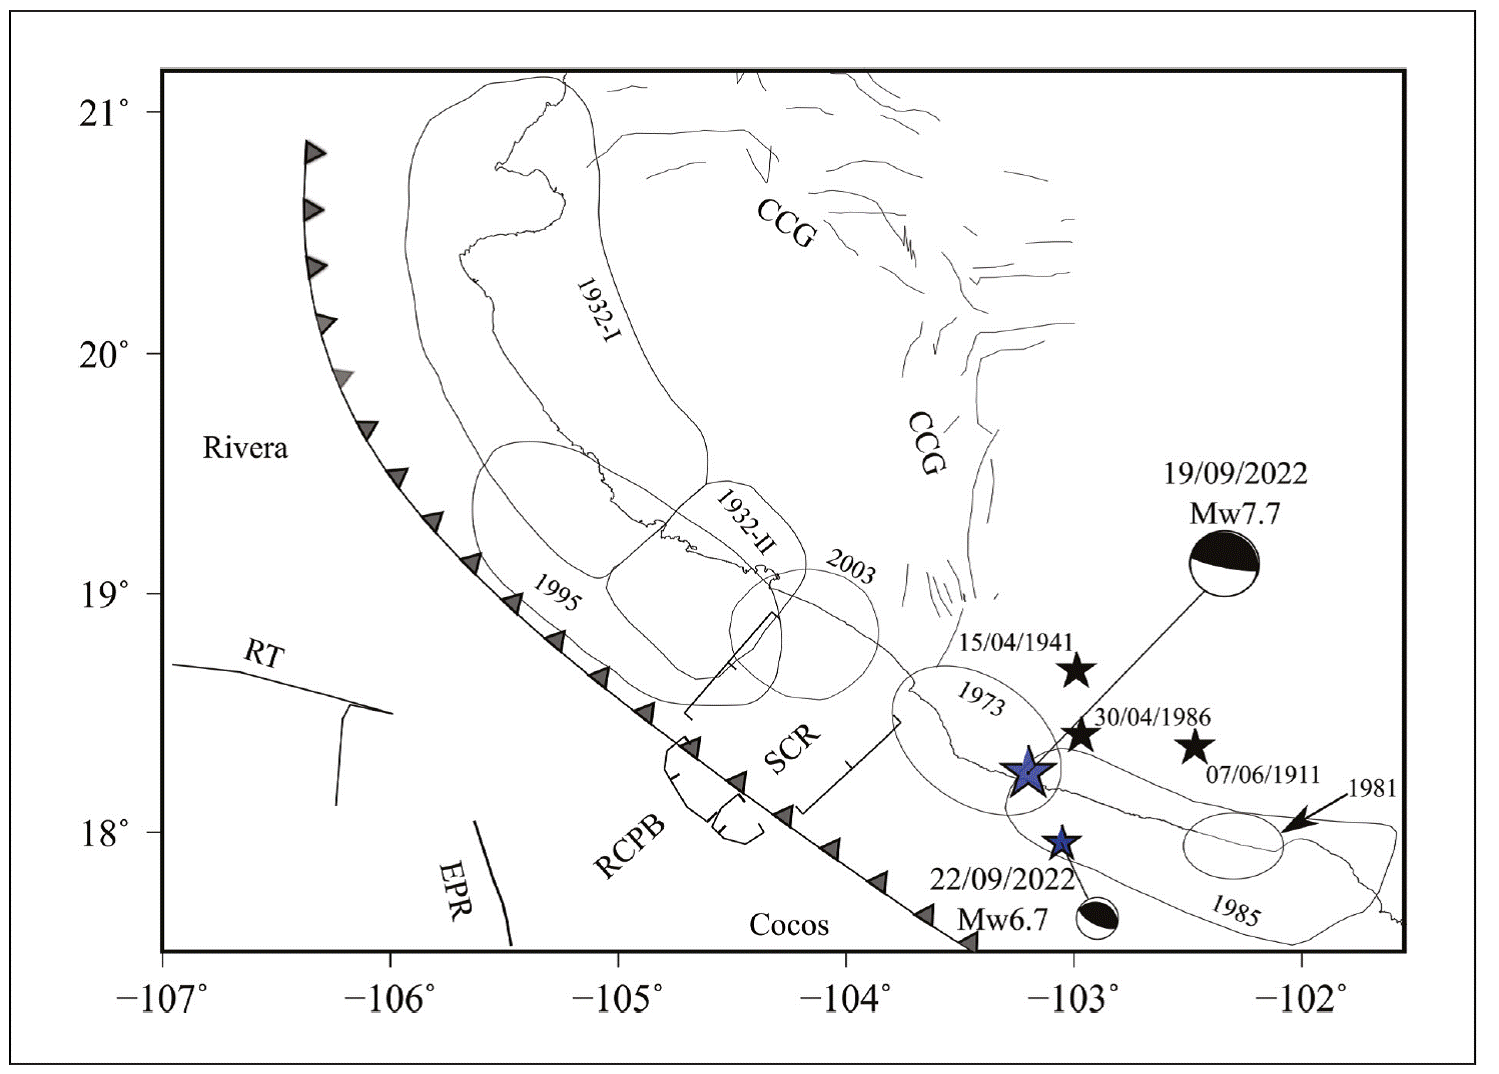
Figure 1 Tectonic map of the region (modified from Bandy et al., 1995; Singh et al., 2003). RT: Rivera Transform, EPR: East Pacific Rise, RCPB: Rivera Cocos Plate Boundary, SCR: Southern Colima Rift, CCG: Colima Central Graben. Ticked lines indicate areal extent of SCR rift. The contours outline aftershock areas of large and great earthquakes. Black stars depict epicenters of the earthquakes whose aftershock areas are not known. Blue stars with focal mechanism: 2022 mainshock (M w7.6) and the major aftershock (M w6.7). Note that the mainshock epicenter falls in the elliptical aftershock area of the 1973 earthquake.
Subduction of RIVE and COCOS plates below NOAM gives rise to large, shallow thrust earthquakes. Large earthquakes that have occurred in the region since 1910 are listed in Table 1. The aftershock areas of the events, if known, are shown in Figure 1. The locations of the 2022 mainshock and its largest M w6.7 aftershock are also given in the figure. We note that the epicenter of the mainshock falls within the aftershock area of the 1973 earthquake (M w 7.6) outlined by Reyes et al. (1979) based on seismograms recorded on a portable network deployed in the field.
Table 1 Large subduction thrust earthquakes since 1910 in the region of interest
| No. | Date | Lat0N | Long0W | Magnitude |
|---|---|---|---|---|
| 1 | 7 June 1911 | 18.36 | 102.47 | 7.7(M s) |
| 2 | 3 June 1932 | 19.80 | 103.93 | 8.2(M s), 7.9(M w) |
| 3 | 18 June 1932 | 19.09 | 103.55 | 7.8(M s), 7.8(M w) |
| 4 | 15 April 1941 | 18.68 | 102.99 | 7.8(M s) |
| 5 | 30 January 1973 | 18.49 | 102.89 | 7.5(M s), 7.6(M w) |
| 6 | 25 October 1981 | 17.75 | 102.25 | 7.3(M s), 7.2(M w) |
| 7 | 19 September 1985 | 18.14 | 102.71 | 8.1(M s), 8.0(M w) |
| 8 | 30 April 1986 | 18.41 | 102.97 | 7.0(M s), 6.9(M w) |
| 9 | 9 October 1995 | 18.85 | 104.50 | 7.3(M s), 8.0(M w) |
| 10 | 22 January 2003 | 18.60 | 104.22 | 7.6(M s), 7.5(M w) |
| 11 | 19 September 2022 | 18.22 | 103.33 | 7.6(M s), 7.6(M w) |
References and notes keyed to event number in Table 1
1. Location from ISC-GEM catalog; Ms from Abe (1981)
2. Location from ISC-GEM catalog; aftershock area from Singh et al. (1985) ; M s from Abe (1981) ; M w from Wang et al. (1982)
3. Location from ISC-GEM catalog; aftershock area from Singh et al. (1985) ; M s from Abe (1981) ; M w from Wang et al. (1982)
4. Location from ISC-GEM catalog; M s from Abe (1981) . Location given by Kelleher et al. (1973) is: 18.850N, 102.940W
5. Location from ISC-GEM catalog; aftershock area, Ms and M w from Reyes et al. (1979)
6. Location and aftershock area from Havskov et al. (1983); M s and M w from Global CMT catalog
7. Location and aftershock area from UNAM Seismology Group (1986); M s and M w from Global CMT catalog
8. Location from ISC-GEM catalog; M s and M w from Global CMT catalog
9. Location and aftershock area from Pacheco et al. (1997) ; M s and M w from Global CMT catalog
10. Location and aftershock area from Singh et al. (2003) ; M s and M w from Global CMT catalog
11. Location and M w from this study; M s from Global CMT catalog
The three largest subduction thrust earthquakes in Mexico since 1900 have occurred along the Michoacán-Colima-Jalisco segment of the Mexican subduction zone. The earthquakes of 3 June 1932 (M s8.2) and 9 October 1995 ( M w 8.0) ruptured the RIVE-NOAM plate interface, whereas the 19 September 1985 (M w8.0) event broke the COCOS-NOAM interface. The earthquakes listed in Table 1 caused damage to towns and cities in the vicinity of their rupture areas but two of them were also destructive to Mexico City. The earthquake of 7 June 1911 (M s7.7) destroyed the town of Ciudad Guzmán in the state of Jalisco. It also caused considerable damage in Mexico City (Miranda y Marron, 1911-1912). As mentioned earlier, the 1985 Michoacán earthquake caused unprecedented damage and deaths in Mexico City.
In this paper, we present a source study of the 2022 earthquake and its major M w6.7 aftershock in the context of previous large earthquakes in the vicinity, and discuss the characteristics of the ground motion at regional distances.
Our analysis is based on local and regional data as well as teleseismic P-wave data. We also discuss the probability of having observed three major earthquakes on the same day.
Epicentral recording
Maruata station (MMIG), located on the coast of Michoacán and nearly above the hypocenter [(S-P) time 2.8 s], is equipped with a broadband seismograph, an accelerograph, and a GPS receiver. The broadband seismograms were saturated on the S-wave arrival. The acceleration traces were integrated to obtain velocity and displacement. Because of the baseline shift in the acceleration, the velocity often does not approach the expected zero level at the end of the recording; instead records often show a residual velocity. Integration of these velocity recordings without a shift correction leads to unrealistic displacements. To correct the shift, we selected a time, T 1 , after the end of the intense part of motion and fit, in the least-square sense, a straight line to the velocity data between T 1 and the end of the record. The line at T 1 is then connected to time T 0 which we choose at the P-wave arrival. These two-line segments are used to correct the velocity record, which are then integrated to obtain the displacement (see, Singh et al., 2020 for more details). We followed this procedure in the integration. The traces are shown in Figure 2. The PGA and PGV on the NS component are 1090 gal and 28.3 cm/s, respectively.
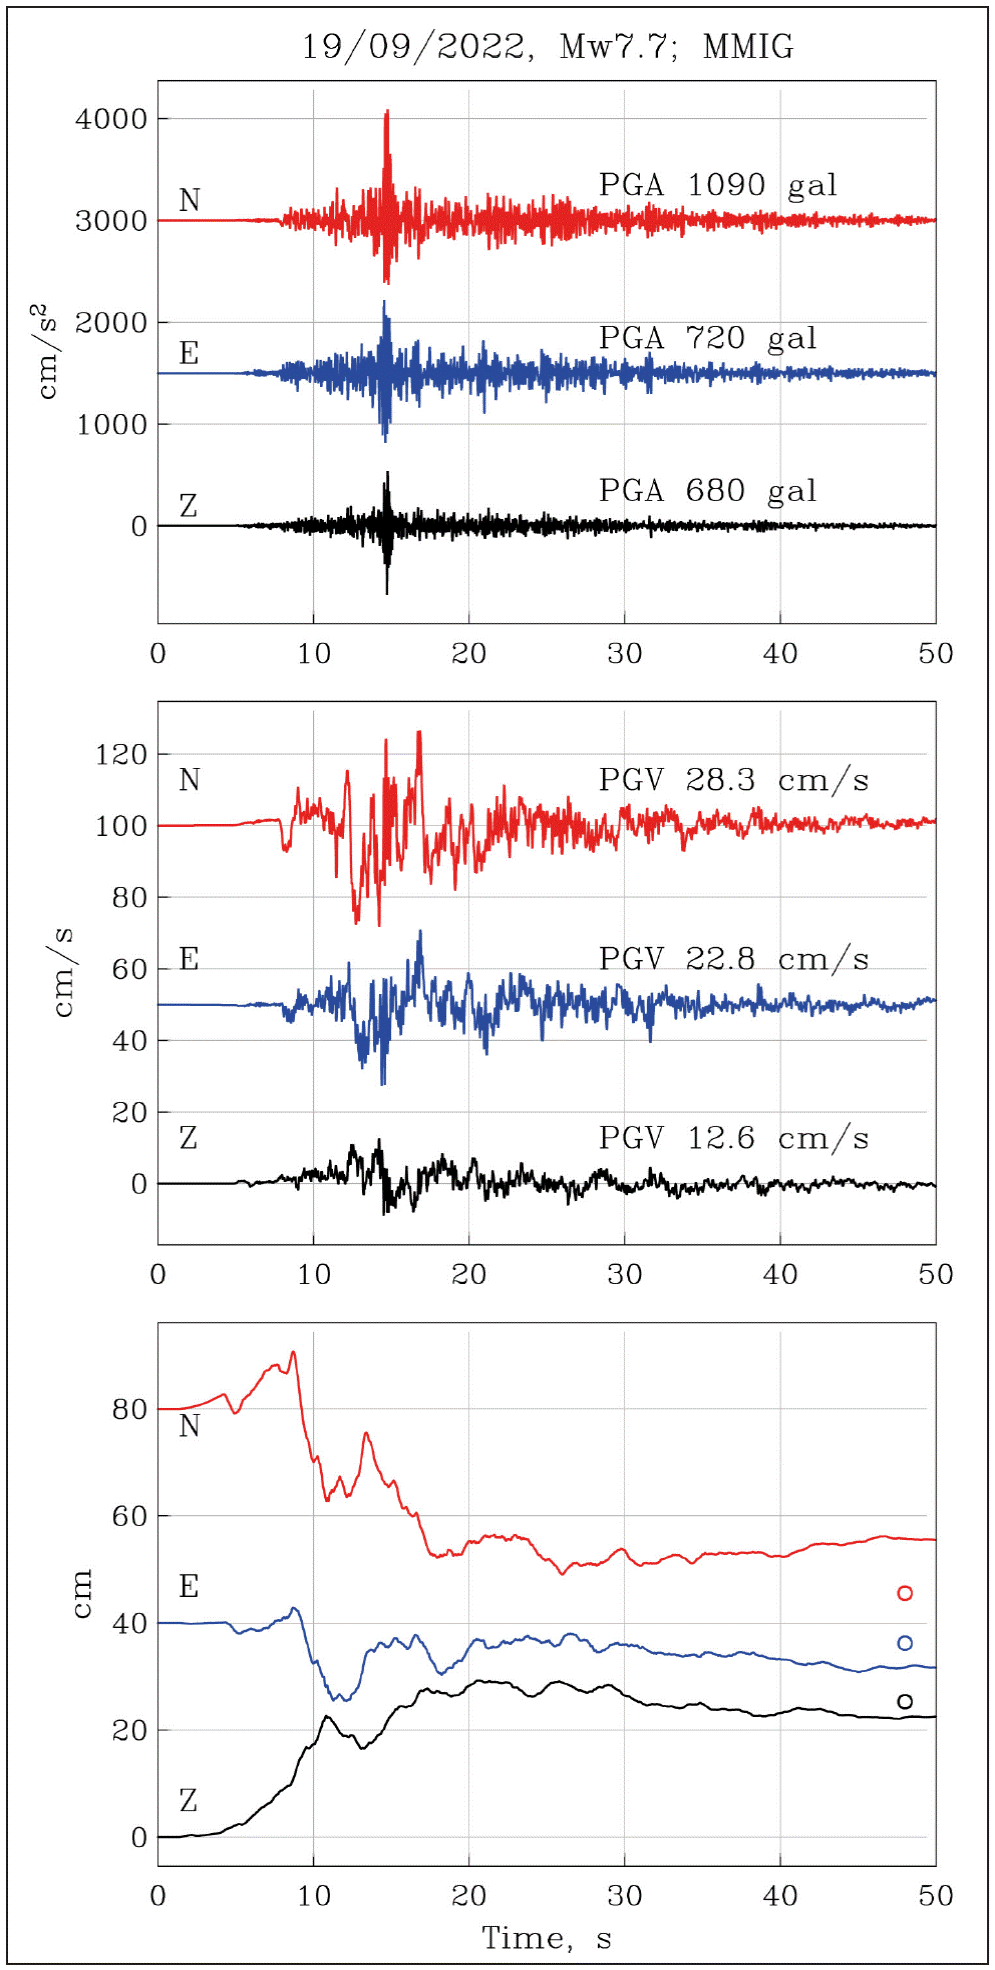
Figure 2 Acceleration, velocity, and displacement at the epicentral station of Maruata (MMIG) during the mainshock. Circles in the bottom frame show coseismic static displacement retrieved from GPS station TNMR collocated with MMIG (Z: +25.3 cm; EW: -3.8 cm; NS: -34.4 cm)
The GPS receiver at MMIG had stopped working 20 days before the mainshock due to a problem with the solar panel. The station was reestablished 4 days after the event. Successive measurements show post-seismic creep. Correcting for the lost time series before the 2022 earthquake by extrapolation and for the post-seismic creep, the estimated coseismic static NS, EW, and vertical, Z displacements from GPS are -34.4 cm, -3.8 cm, and +25.3 cm, respectively. These values are marked in the bottom frame of Figure 2, which shows the displacement seismograms. Not surprisingly, the static displacement from GPS differs from that estimated from integration. The MMIG traces are reminiscent of the epicentral recording at Caleta de Campo (CALE) during the 19 September 1985, Michoacán earthquake (M w8.0) (Anderson et al., 1986) with some differences: PGA at CALE during the 1985 earthquake was much smaller (141 cm/s2; NS and EW), PGV was about the same (24.7 cm/s; NS), and PGD was greater (78 cm; NS).
Basic source parameters of the mainshock and the major aftershock
Since 2014, the Servicio Sismológico Nacional (SSN, Mexican National Seismological Service) routinely calculates and publishes M w through W-phase inversion (Kanamori and Rivera, 2008) using an algorithm modified by Hayes et al. (2011) and revised by Duputel et al. (2012) . For M ≥ 5.2 earthquakes, the algorithm automatically gets triggered 10 minutes after the origin time and uses broadband data of the SSN stations (Pérez-Campos et al., 2019). It starts with the preliminary, automatically obtained, SSN location and magnitude, and looks for the best half duration and then the best location. For the 19 September 2022 mainshock and its major aftershock of 22 September we revised the routine near-realtime W-phase solution by checking and, if required, updating the response files and eliminating data with obvious problems. The revised solutions of the mainshock and the major aftershock are listed in Tables 2 and 3, respectively. The tables also give the source parameters reported by the United States Geological Survey (USGS) and the Global Centroid Moment Tensor (GCMT) project.
Table 2 Source parameters of the 19 September 2022, Michoacán-Colima earthquake
| Timing | Lat °N | Long °W | Depth, km | Strike ° | Dip,° | Rake ° | M 0, Nm |
|---|---|---|---|---|---|---|---|
| SSN
18:05:09.0 |
18.220 | 103.290 | 15.0* | - | - | - | - |
| SSN W-phase CMT+
18:05:29.0 |
18.420 | 103.395 | 15.5 | 293 | 18 | 83 | 2.71×10²⁰ (M w7.56) |
| USGS, W-phase CMT | 18.267 | 103.185 | 23.5 | 287 | 18 | 86 | 2.67×10²⁰ (M w7.55) |
| Global CMT
18:05:29.5 |
18.590 | 103.430 | 16.9 | 306 | 11 | 107 | 4.49×10²⁰ (M w7.70) |
* Depth fixed.
+Based on an algorithm implemented at Institute of Geophysics, UNAM, which uses regional waveforms recorded on SSN broadband stations. A grid search was performed for the depth and the centroid location.
Table 3 Source parameters of the major aftershock of 22 September 2022
| Timing | Lat °N | Long °W | Depth, km | ϕ | δ | λ | M 0, Nm |
|---|---|---|---|---|---|---|---|
| SSN 06:16:07.0 |
18.050 | 103.120 | 12.0* | - | - | - | - |
| SSN
W-phase CMT+ 06:16:13.0 |
18.050 | 103.120 | 11.5 | 293 | 17 | 86 | 1.56×10¹⁹ (M w6.73) |
| USGS/NEICx | 18.263 | 102.955 | 20.0 | - | - | - | - |
| 06:16:09.0 | |||||||
| USGS/NEIC,
W-phase CMTx 06:16:15.6 |
17.821 | 102.978 | 19.5 | 297 | 17 | 105 | 1.90×10¹⁹ (M w6.79) |
| Global
CMTX 06:16:16.2 |
18.270 | 103.080 | 24.0 | 289 | 25 | 83 | 1.50×10¹⁹ (M w6.72) |
*Depth fixed.
+ A grid search was performed for the depth and the centroid location.
x Global CMT and USGS/NEIC source parameters last accessed on 06/12/2022.
There are some differences in the focal mechanism and seismic moment (M 0) given by the three sources. For example, M 0 of the mainshock estimated in this study and by the USGS are nearly the same, 2.7x10²⁰ N-m (M w7.55) but the value listed in the GCMT catalog is 1.7 times greater. Henceforth, we shall take M 0 of the mainshock and the major aftershock as 2.7×10²⁰ N-m (M w7.6) and 1.6×10¹⁹ N-m (M w 6.7), respectively. We note that, with respect to the SSN epicenter, the USGS epicenter is shifted by 44 km towards N53°E for the mainshock and 29 km towards N36°E for the aftershock. A consistent NE shift of the epicenters of Mexican subduction zone earthquakes reported by international agencies has been documented earlier (Singh and Lermo, 1985; Hjörleifsdóttir et al., 2016).
Aftershock distribution
Aftershocks that occurred in the first 30 days (805 events with coda-wave magnitude Mc ≥ 3.5) are shown in Figure 3. We determined CMT solutions of seven significant aftershocks in addition to the major aftershock (Table 4). Focal mechanisms of the mainshock and the eight aftershocks (thrust: five; normal: two; strike slip: one) are displayed in Figure 3.
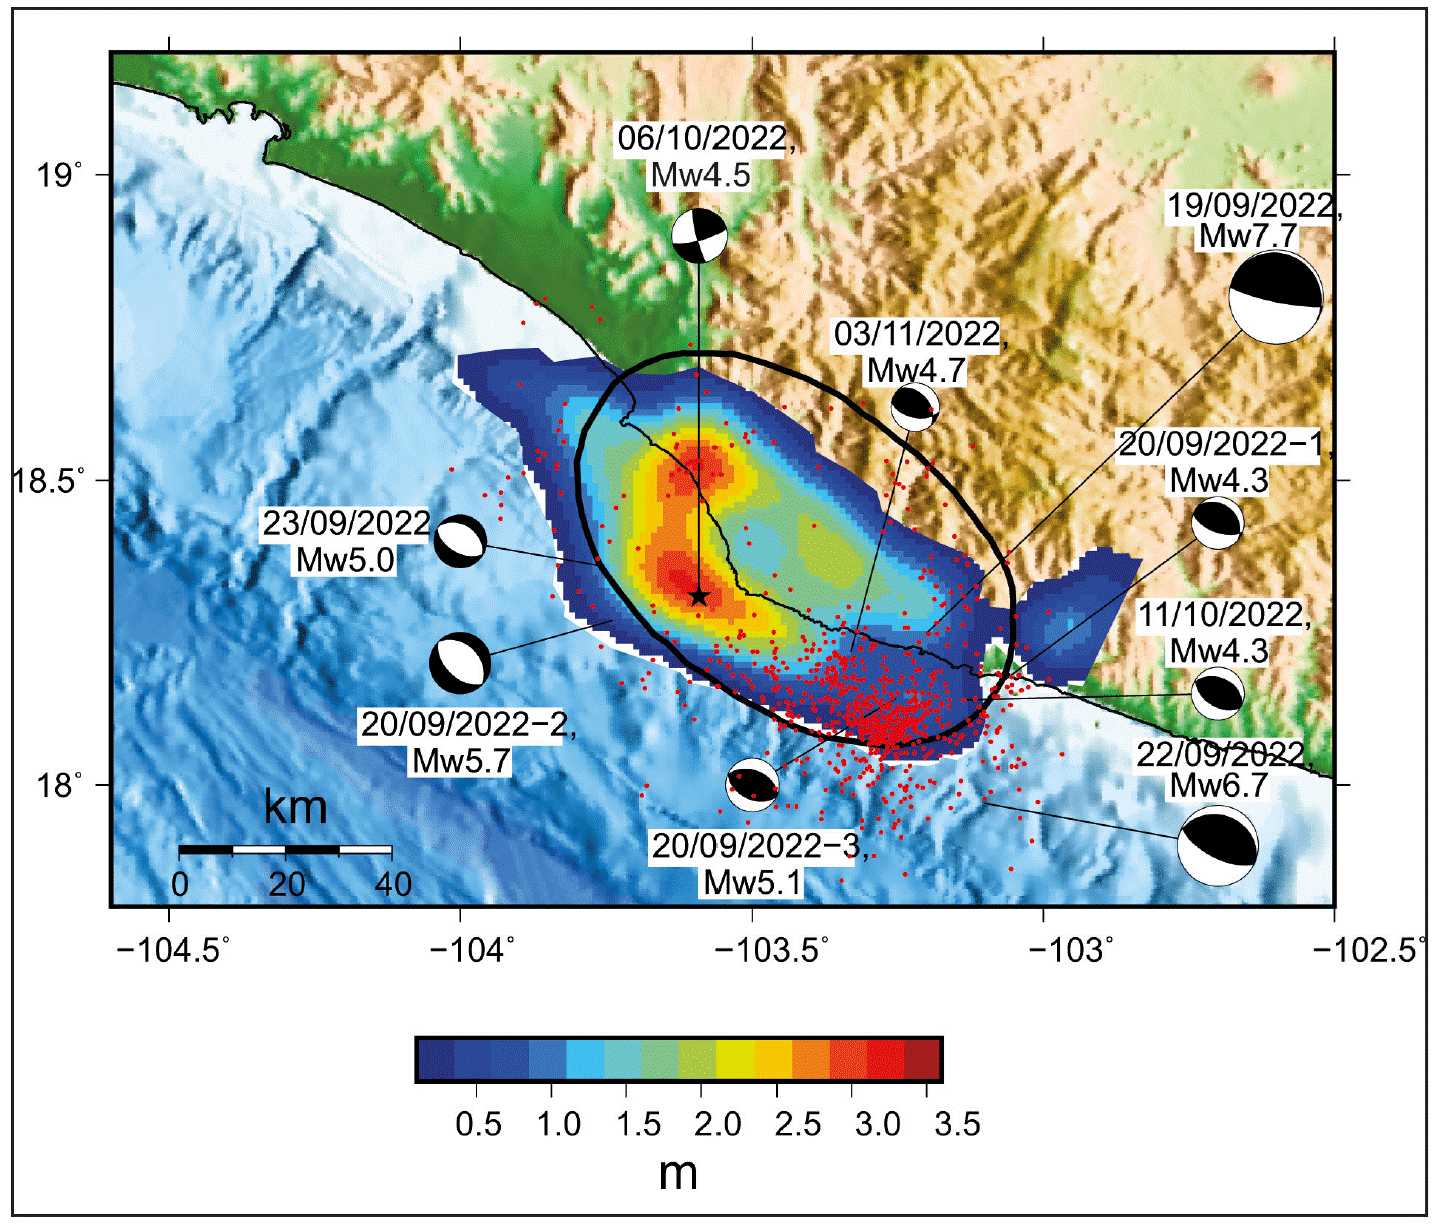
Figure 3 Coseismic slip distribution for the mainshock, taken from the U.S. Geological Survey finite fault model (https://earthquake.usgs.gov/earthquakes/eventpage/us7000i9bw/finite-fault). Epicenters and focal mechanisms of the mainshock and significant aftershocks are shown in the Figure. Red dots: relocated aftershocks which occurred in first 30 days. Ellipse: aftershock area of the 1973 Colima earthquake (Reyes et al., 1979). Aftershocks overlap the elliptical area. Note the concentration of the aftershocks to the SW of the epicenter.
Table 4 Source parameters of seven additional, significant aftershocks
| Date, Time | Lat. | Lon. | M 0, N-m | M w | ϕ | δ | λ |
|---|---|---|---|---|---|---|---|
| 20/09/2022-1, 06:19:08 | 18.30 | -103.04 | 3.36×10¹⁵ | 4.3 | 311 | 30 | 108 |
| 20/09/2022-2, 08:17:13 | 18.27 | -103.74 | 4.30×10¹⁷ | 5.7 | 315 | 38 | -90 |
| 20/09/2022-3, 19:04:29 | 18.14 | -103.25 | 4.54×10¹⁶ | 5.1 | 291 | 44 | 86 |
| 23/09/2022, 18:25:56 | 18.36 | -103.76 | 3.69×10¹⁶ | 5.0 | 304 | 37 | -86 |
| 06/10/2022, 07:03:42 | 18.31 | -103.59 | 6.82×10¹⁵ | 4.5 | 166 | 83 | 14 |
| 11/10/2022, 09:43:31 | 18.14 | -103.13 | 3.74×10¹⁵ | 4.3 | 294 | 40 | 83 |
| 03/11/2022, 07:44:51 | 18.31 | -103.28 | 9.89×10¹⁵ | 4.6 | 319 | 43 | 117 |
Several features of the aftershocks are worth noting in Figure 3. They overlap the elliptical 1973 aftershock area outlined by Reyes et al. (1979) . Relatively few aftershocks occurred within the large coseismic slip area of the 2022 earthquake (see next section). Relative lack of aftershocks over the areas of large slip has been reported for many earthquakes (see Das and Henry, 2003 for a review). Most of the aftershocks of the 2022 earthquakes were concentrated to the south of the mainshock epicenter and in the SE part of the 1973 aftershock area. A similar concentration was observed in the aftershock distribution in 1973 which led Reyes et al. (1979) to suggest that the rupture initiated to the SE and propagated to the NW.
Finite fault model of the mainshock and the major aftershock
We determined slip models for the earthquakes of 19 and 22 September 2022 using the rapid finite-fault inversion methodology described by Mendoza and Martínez-Lopez (2022) .
The method automatically assigns fault parameters based on the earthquake size and derives a coseismic slip model using teleseismic P waveforms obtained in near-realtime from the Incorporated Research Institutes for Seismology Data Management Center (https://ds.iris.edu/).
For the 19 September M w7.6 earthquake, we used the hypocenter and moment-tensor source mechanism reported by the USGS following the event (Table 2; https://earthquake.usgs.gov/earthquakes/search/). The slip model for the shallow, northeast-dipping plane shows two separate zones of high slip: one downdip of the hypocenter with a peak slip of 1 m and a second zone about 40 km to the northwest with a maximum slip of 1.3 m (Figure 4). This result was obtained within three hours of the occurrence of the event. The rapid P-wave inversion methodology was also applied following the M w 6.7 aftershock of 22 September. We used fault dimensions of 80 km by 80 km, the minimum size allowed in the rapid P-waveinversion procedure designed to analyze earthquakes of magnitude M w7 or greater (Mendoza and Martinez-Lo-pez, 2022). For this event, we used the epicenter calculated by the SSN (Table 3; http://www2.ssn.unam.mx:8080/sismos-fuertes/) and the focal depth obtained by the USGS. The distribution of coseismic slip for the shallow-dipping plane (Figure 5) shows a single 20 km by 20 km rupture area with a peak of 1.1 m extending primarily downdip from the hypocenter. Although the results obtained for both events are preliminary, they provide a general overview of the locations of high slip and the possible direction of coseismic rupture.
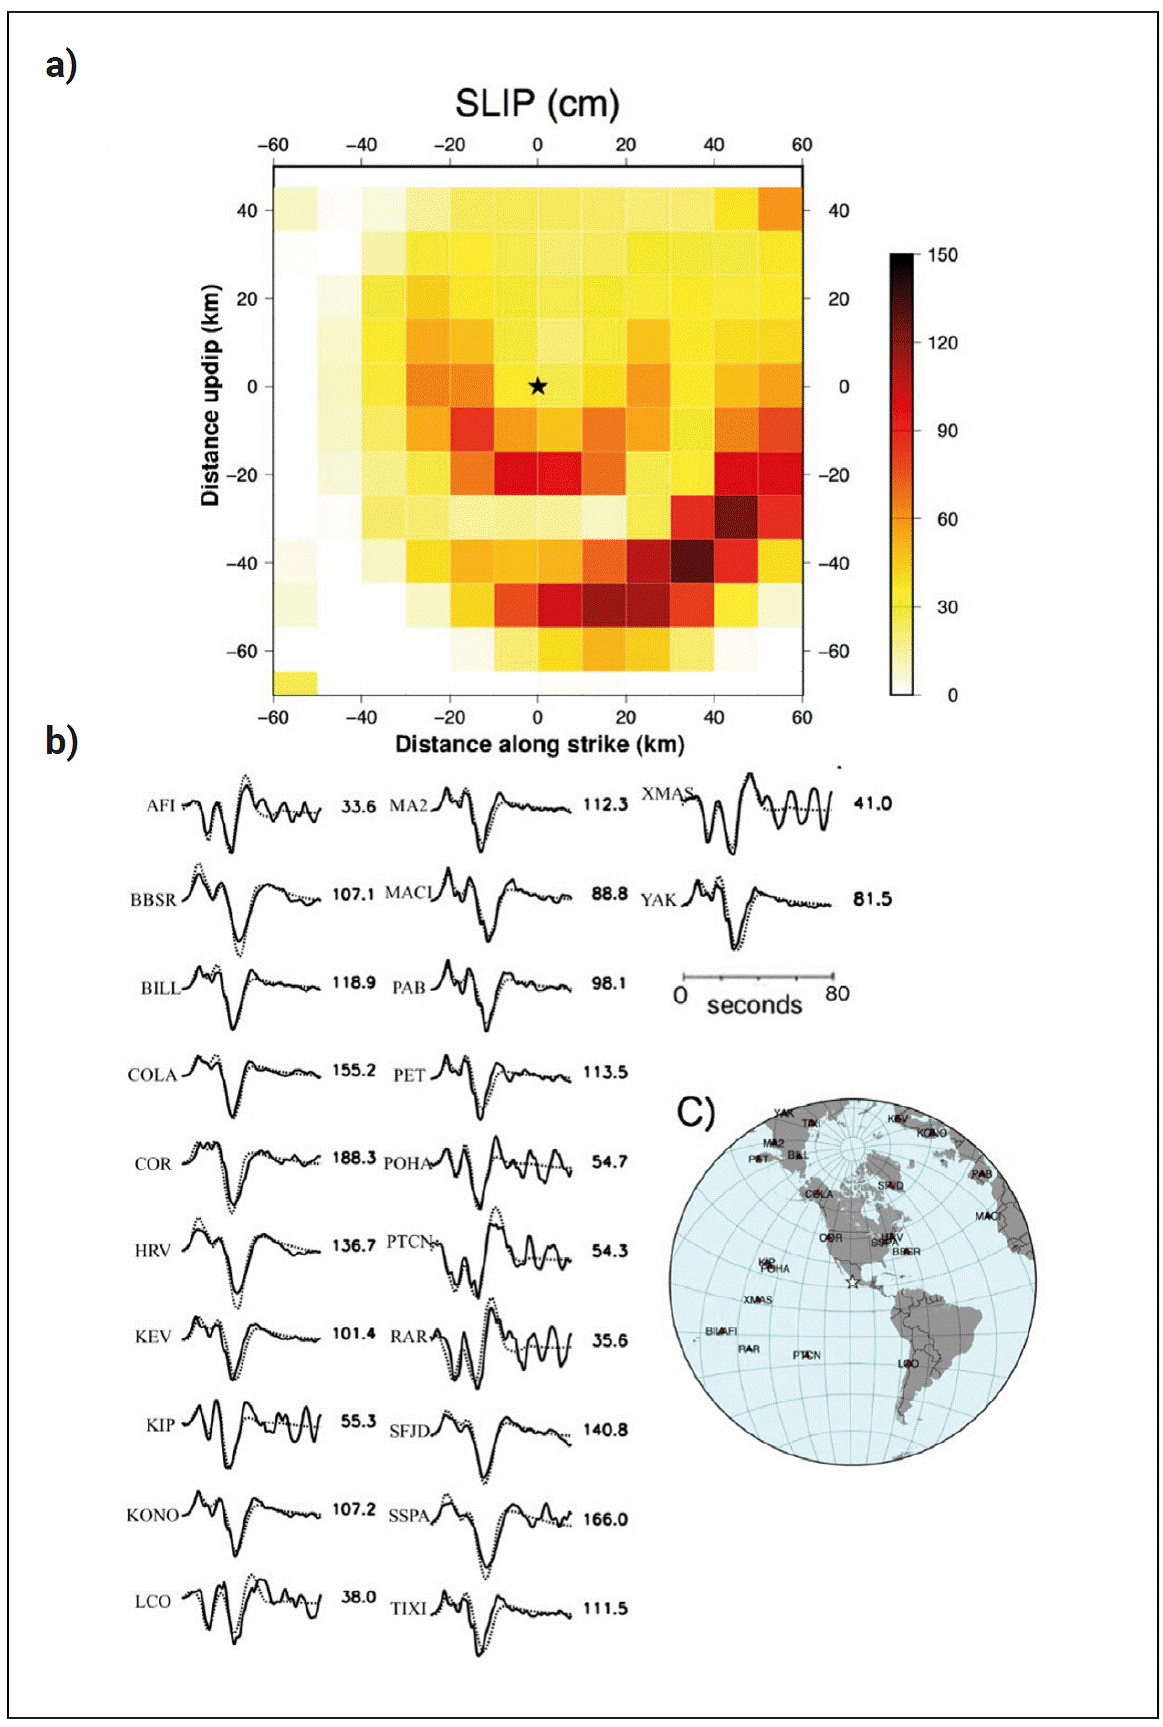
Figure 4 a) Coseismic slip (in cm) obtained for the 19 September 2022 earthquake from the rapid inversion of teleseismic P waves. The view is from the top of a 120-km by 120-km fault divided into 144 square subfaults. The fault strike, dip and rake are 287°, 18°, and 86°, respectively. The star shows the hypocenter location. b) Fits between observed (solid) and theoretical (dotted) P waveforms for an inferred seismic moment of 1.9 × 1027 dyne-cm (M w7.5). Numbers to the right are the peak amplitudes of the observed records (in microns). C) Az-imuthal distribution of stations used in the inversion.
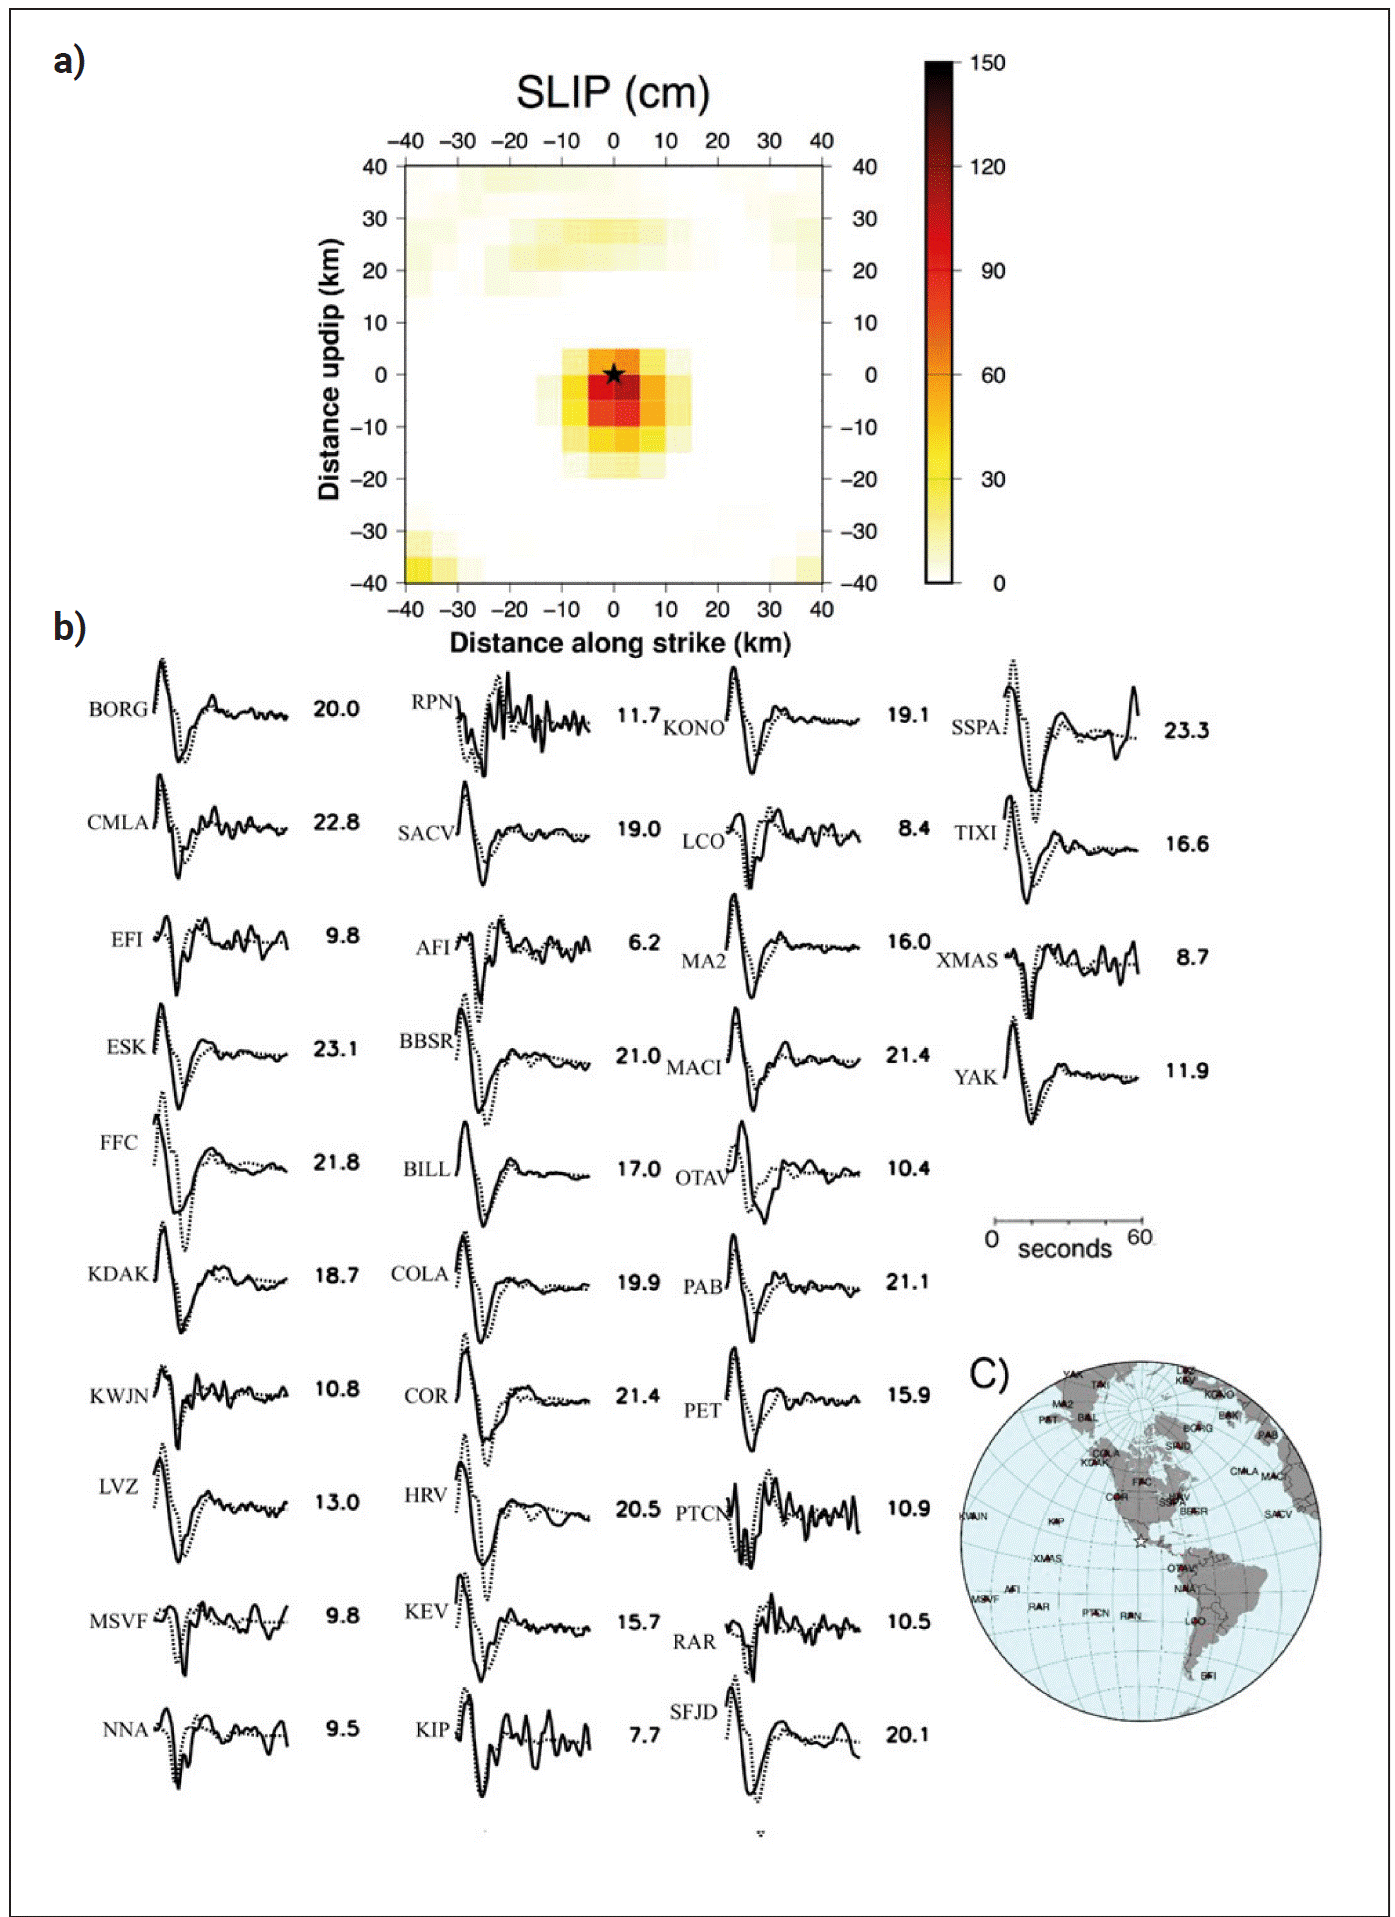
Figure 5 a) Coseismic slip (in cm) obtained for the 22 September 2022 aftershock from the rapid inversion of teleseismic P waves. The view is from the top of an 80-km by 80-km fault divided into 256 square subfaults. The fault strike, dip and rake are 291°, 18°, and 90°, respectively. The star shows the hypocenter location. b) Fits between observed (solid) and theoretical (dotted) P waveforms for an inferred seismic moment of 1.4 × 1026 dyne-cm (M w6.7). Numbers to the right are the peak amplitudes of the observed records (in microns). C) Az-imuthal distribution of stations used in the inversion.
Both inversions use five 1 s time windows to parameterize the slip duration on the fault.
On 7 October 2022, USGS updated its previously published finite fault model of the mainshock (http://earthquake.usgs.gov/earthquakes/eventpage/us7000i9bw/finite-fault). The new fault model is based on the analysis of a more extensive dataset: 41 teleseismic P waves, 23 teleseismic SH waves and 55 long-period surface waves, and observations from 7 high-rate GNSS stations and 11 static GNSS sites. The model also uses the hypocenter reported by the SSN (Table 2) to correct for the location bias. Figure 3 reproduces the USGS finite fault model. As this model is based on a more extensive dataset, we shall use it in our further analysis. In this model, M 0 and maximum slip (D max) are 2.73 ⋅ 1020 Nm and 3.2 m, respectively. Following Ye et al. (2016) and Lay et al. (2016), we ignore subfaults with slip D < 0.15D max as the low slip areas are likely to be poorly resolved. The trimmed area, A, enclosing D ≥ 0.15D max, is 3600 km2. M 0 released over this area is 2.52 ⋅ 1020 Nm and the average slip, <D>, is 1.48 m. The relation Δσs = (7π3/2/16) (M 0 /A3/2), where Δσs is the static stress drop (Kanamori and Anderson, 1975), yields Δσs of 3.7 MPa.
Moment-scaled radiated seismic energy, REEF, and number of aftershocks
Radiated seismic energy, E R, for the mainshock, from teleseismic data, is 3.44 ± 0.13 ⋅ 1015 J (Me = 7.46). In the estimation of E R, we followed the methodology of Boatwright and Choy (1986) , and included a stronger attenuation correction for subduction earthquakes discussed by Pérez-Campos and Beroza (2001) and Pérez-Campos et al. (2003). Following Boore and Joyner (1997) we applied a correction for generic hard site. E R estimation shows a strong azimuthal dependence that can also be appreciated from the moment rate spectrum (MRS) at each station (Figure 6). The larger values are obtained at stations to the north, while the smaller once occur to the south. We build the source spectrum by patching, at low frequencies (< 0.2 Hz), the moment rate function obtained from the source time function reported by the USGS (http://earthquake.usgs.gov/earthquakes/eventpage/us7000i9bw/finite-fault), and, at high frequencies (≥ 0.2 Hz), the source spectrum obtained from teleseismic data. The resulting MRS fits the theoretical spectrum from the Brune source model (Brune, 1970) with a stress drop of 1 MPa (Figure 6c). The moment-scaled radiated energy, E R / M 0, is 1.27 ⋅ 10-5, a value similar to those reported for other large Mexican thrust earthquakes, which range between 1.0 and 3.3 ⋅ 10-5 with the exception of earthquakes whose rupture areas extend up to the trench, e.g., Colima- Jalisco earthquake of 9 October 1995 (E R / M 0 = 5.6 ⋅ 10-6) (Table 5). E R / M 0 of the 2022 mainshock is close to the world-wide average of ~ 1 ⋅ 10-5 (e.g., Ye et al., 2016a).
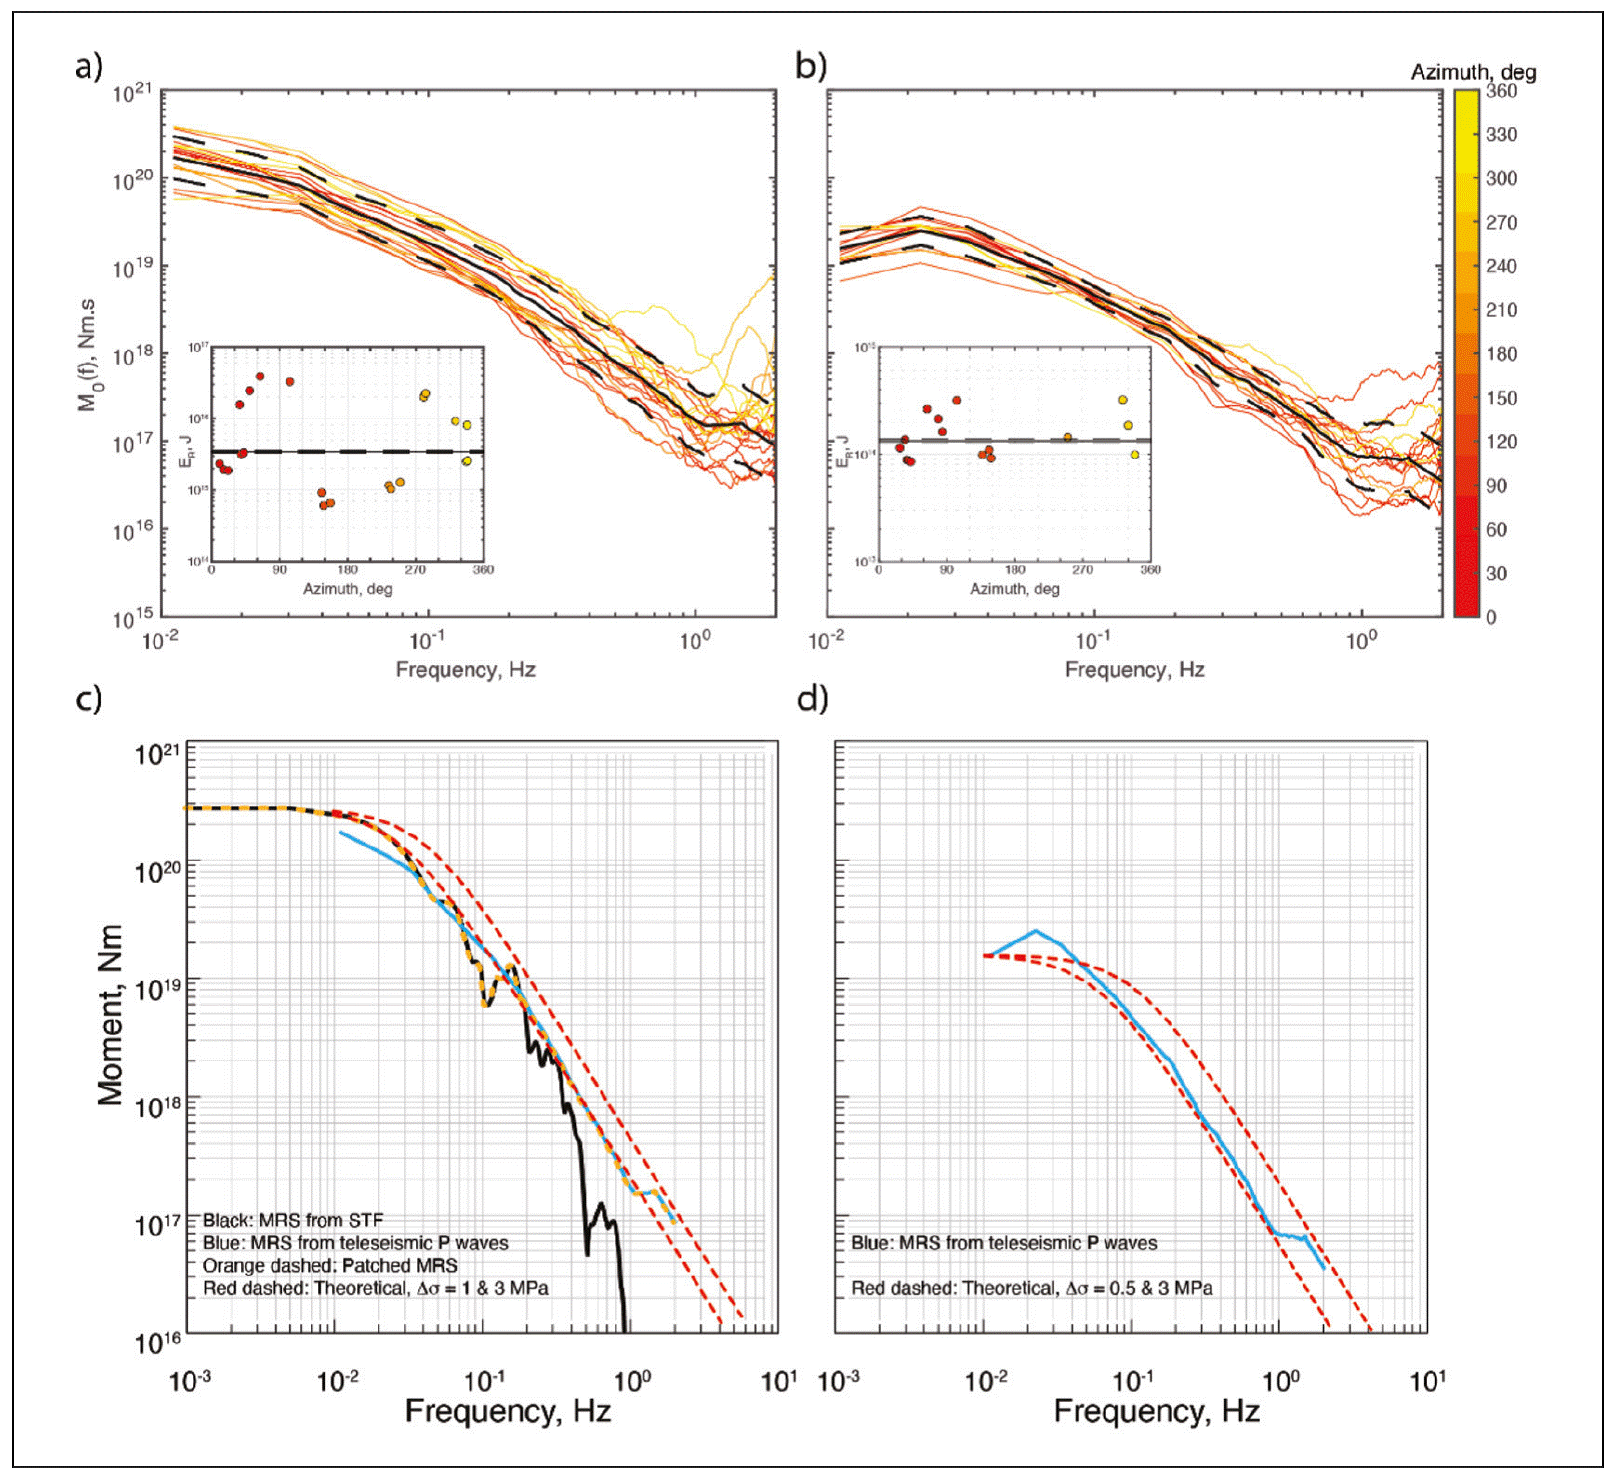
Figure 6 Radiated seismic energy and source spectra for the mainshock and the largest aftershock. a) Source spectra for the mainshock, obtained at each station, color coded by azimuth. The black solid line shows the geometric mean, and the black dashed lines, its confidence interval. The inset shows the values of radiated seismic energy estimated at each station, color coded by azimuth. b) Same as a) but for the largest aftershock. c) Source spectrum from the mainshock. The source spectrum from the source time function reported by the USGS (https://earthquake.usgs.gov/earthquakes/eventpage/us7000i9bw/finite-fault) is shown in black; the one obtained from teleseismic data (this study), in blue; the patched source spectrum, as an orange dashed line; and theoretical source spectra with 1 and 3 MPa, as red dashed lines. d) Source spectrum of the aftershock. The source spectrum obtained from teleseismic data (this study) is shown in blue; and theoretical source spectra with 0.5 and 3 MPa, as red dashed lines.
Table 5 Moment-scaled radiated seismic energy, REEF, and number of m b ≥ 5 aftershocks in one-month period of large Mexican subduction thrust earthquakes (Modified from Iglesias et al., 2022)
| Date Location |
M 0, Nm | M w | E R/M 0 | REEF* | N(mb ≥ 5)# | log(N/Ne)+ | ||
|---|---|---|---|---|---|---|---|---|
| 14/09/1995 Copala |
1.28 | ⋅ 1020 | 7.3 | 1.83 | ⋅ 10-5 | 4.5 | 2 | -0.659 |
| 09/10/1995 Colima-Jalisco |
1.15 | ⋅ 1021 | 8.0 | 5.60 | ⋅ 10-6 | 13.8 | 5 | -0.961 |
| 25/02/1996 Offshore Pinotepa |
5.55 | ⋅ 1019 | 7.1 | 3.34 ⋅ 10-6 | 1.8 | 7 | 0.085 | |
| 20/03/2012 Pinotepa | 1.88 | ⋅ 1020 | 7.5 | 2.96 | ⋅ 10-5 | 4.4 | 14 | -0.014 |
| 18/04/2014 Papanoa | 9.41 | ⋅ 1019 | 7.3 | 1.03 | ⋅ 10-5 | 10.1 | 4 | -0.358 |
| 16/02/2018 Pinotepa | 7.04 ⋅ 1019 | 7.2 | 1.04 | ⋅ 10-5 | 25.2 | 7 | -0.015 | |
| 23/06/2020 Huatulco | 1.64 ⋅ 1020 | 7.4 | 2.39 | ⋅ 10-5 | 6.1 | 4 | -0.458 | |
| 08/09/2021 Acapulco | 3.64 ⋅ 1019 | 7.0 | 2.10 | ⋅ 10-5 | 5.8 | 1 | -0.660 | |
| 19/09/2022 Michoacán-Jalisco | 2.73×10²⁰ | 7.6 | 1.27×10⁻⁵ | 8.5 | 5 | -0.561 | ||
*REEF: Radiated energy enhancement factor (Ye et al., 2018)
#N count includes mainshock as one event
+logNe = M w - 6.34 (Singh and Suárez, 1988)
For the major M w6.7 aftershock of 22 September, E R is 1.33 ± 0. 06 ⋅ 1014 J (M e = 6.51) so that E R / M 0 = 8.31 ⋅ 10-6; in this case, E R and source spectrum at individual station do not show any azimuthal dependence (Figure 6b). MRS of the earthquake is well fit by a Brune source model with a stress drop of 0.5 MPa (Figure 6d).
We computed radiated energy enhancement factor, REEF, for the 2022 mainshock. REEF, a measure of rupture complexity, recently introduced by Ye et al. (2018) . It is the ratio of measured radiated energy, E R, to the calculated minimum energy for a source of the same M 0 and duration, E R/ E R-min. A smaller REEF value corresponds to a simpler source and vice versa. The duration, T, of the moment rate function (MRF) of the 2022 earthquake from the USGS finite-fault modeling is 32 s. E R-min, corresponding to M 0 = 2.73 ⋅ 1020 Nm and T of 32 s, is 4.1 ⋅ 1014 J (Equation 1 of Ye et al., 2018), which gives a relatively low REEF value of 8.5. REEF values are consistently low for southern Mexico to Middle America subduction thrust earthquakes (Table 5; Ye et al., 2018), reflecting the simplicity of the MRF of the earthquakes along this segment of the subduction zone.
The relatively small number of m b ≥ 5 aftershocks is also a characteristic of large Mexican subduction thrust earthquakes (Singh and Suárez, 1988). For the 2022 earthquake there were four aftershocks with m b ≥ 5 in 30-day period. Table 5 gives the number of aftershocks, N, in a 30-day period with m b ≥ 5 and log (N / Ne), where Ne is the expected number of aftershocks derived from regression analysis of worldwide data: log Ne = M w - 6.34 (Singh and Suárez, 1988). Log (N/Ne) is negative for six earthquakes including the 2022 earthquake and close to zero for the remaining three. Thus, along the Mexican subduction zone both low REEF and relative lack of aftershocks prevail. Similarly to Iglesias et al. (2022) , we envision a plate interface that is relatively smooth, containing discrete, compact asperities. Asperities rupture smoothly, generating relatively simple moment rate functions and low values of REEF. As the rupture area and adjacent plate interface is also smooth and homogeneous, there is a relative lack of aftershocks at m b ≥ 5 level.
Comparison with earthquakes of 30 January 1973 (M S 7.5, M w 7.6) and 15 April 1941 (M S 7.7)
From the aftershock locations, and the relative locations of the main shock and aftershocks, Reyes et al. (1979) suggested that the rupture during the 1973 earthquake began to the SE, near the region of high aftershock activity, and propagated to the NW. For the 2022 earthquake, the unilateral rupture propagation to the NW is, of course, well established. In as much as the aftershock areas of the 2022 and 1973 earthquakes overlap (Figure 3), and their magnitudes are similar (Table 1), it is possible that the two events broke roughly the same area, had similar gross source characteristics perhaps even with similar source directivity.
We note, however, that the finite fault model of the 1973 earthquake constructed by Santoyo et al. (2006) using teleseismic P waves does not show a NW directivity. This may be due to poorer quality and limited quantity of data (8 stations) used in the inversion for the 1973 earthquake. Even with far more data of better quality (20 stations) for the 2022 earthquake, the inversion of teleseismic P waves yields a solution that is only a rough approximation of the one obtained by the USGS finite fault modelling based on a more extensive dataset (compare Figures 4 and 3).
For the 1973 earthquake, Reyes et al. (1979) noted that M 0 increased by a factor of about 2 as the period increased from 100 to 300 s. They attributed this increase to possible slow slip before or after the main slip or to unknown errors in the estimation of M 0 at lower periods. For the 2022 earthquake, we computed M 0 from W-phase CMT inversion of the regional broadband seismograms with different band-pass filters and found negligible change in M 0 (M w) with period (Table 6). Thus, either the source processes of the 1973 and 2022 earthquakes differed or else the dependence of M 0 on period for the 1973 earthquake was due to unknown errors.
Table 6 Sensitivity of W-phase solution of the 2022 mainshock to the band-pass filter setting. Centroid depth and epicenter fixed to that reported by the SSN (Table 2). Dip is fixed at 150. Note that M w is nearly independent of the band-pass (BP) filter setting
| Band pass (mhz) | Azimuthal gap | Stations/channels | M w |
|---|---|---|---|
| 2.0- 4.0 | 2130 | 11/12 | 7.58 |
| 2.5- 5.0 | 2080 | 27/45 | 7.58 |
| 3.0- 6.0 | 2080 | 27/59 | 7.60 |
| 3.5- 7.0 | 2080 | 28/64 | 7.59 |
| 4.0- 8.0 | 2080 | 29/70 | 7.58 |
| 4.5- 9.0 | 2080 | 28/70 | 7.58 |
| 5.0- 10.0 | 2080 | 29/69 | 7.58 |
Much less is known about the 1941 earthquake. Kelleher et al. (1973) relocated the mainshock and two of its after-shocks. This area roughly coincides with the aftershock areas of the 1973 and 2022 earthquakes.
To test whether the 1941, 1973, and 2022 earthquakes ruptured roughly the same area, we compared their Galitzin seismograms (Z component) at DBN. We note that repeating events have the same rupture area and slip and give rise to identical seismograms.
The 1941 and 1973 analog records were vectorized and the time series was sampled at an evenly time interval using TIITBA-GUI (Corona-Fernández and Santoyo, 2022). Galitzin record of the 2022 earthquake was synthesized from broadband DBN seismogram as the operation of the Galitzin seismograph was discontinued in December 1994 (Dost and Haak, 2006). We first note that the three events have complex P waves that bear some resemblance (Figure 7).
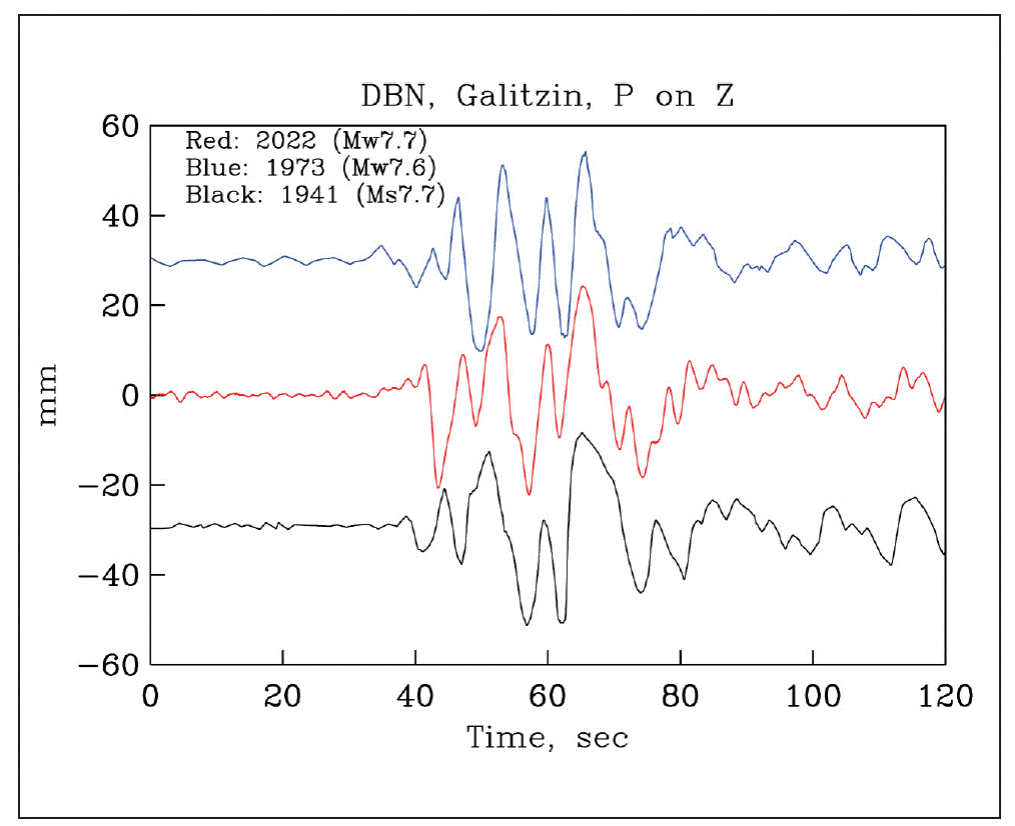
Figure 7 P wave on the DeBilt (DBN) Galitzin seismogram (Z-component) of the Michoacán-Colima earthquakes of 2022, 1973, and 1941. Complexity of the P wave is similar for the three earthquakes.
In Figure 8, the seismograms of 2022 and 1973 are com-pared over three different time windows. The waveforms are clearly not identical. Our tests, however, show that the surface waves on the Galitzin seismograms at DBN of events along the Mexican subduction zone which are 20 to 30 km apart greatly differ from each other (Singh et al., 2022). In as much as the character of the surface waves from the 1973 and 2022 earthquakes are similar (bottom frame, Figure 8), we surmise that the rupture areas of the two events were less than 30 km apart. From the similarity of the aftershock areas, the waveforms at DBN, and the magnitudes of the 2022 and 1973 earthquakes, we conclude that they were quasi-repeated events. In other words, these two events may have ruptured roughly the same area. If so, the return period was 50 years. We recall that the finite fault modeling yields an average slip of about 1.48 m for the 2022 earthquake. As the plate convergence rate is 6.0 cm/yr (DeMets et al., 2010), this gives a coupling ratio of 0.49.
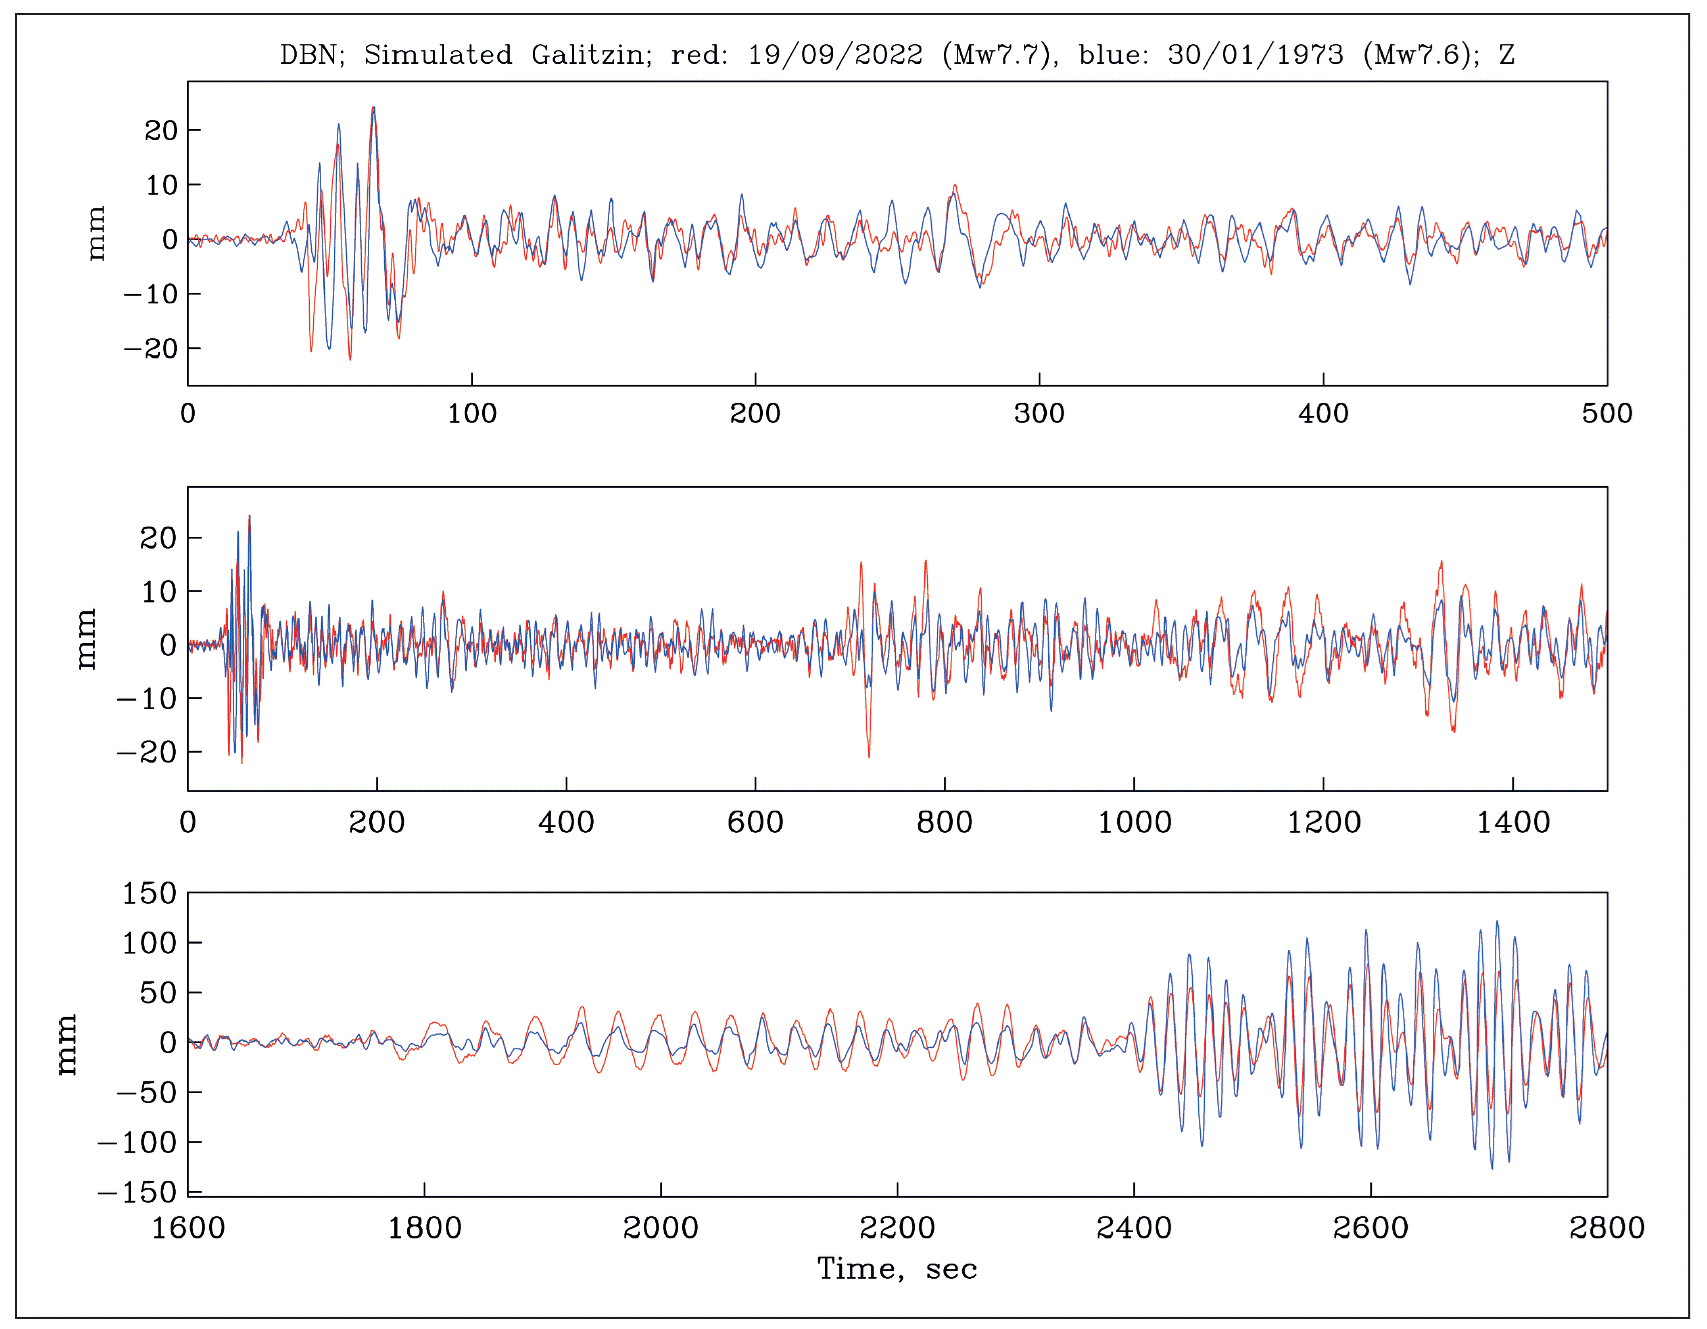
Figure 8 DBN Galitzin seismograms (Z-component) of the Michoacán-Colima earthquakes of 2022 and 1973. The seismograms, displayed in three time windows, are similar though not identical. The events may be classified as quasi-repeated earthquakes.
The Galitzin seismograms of 2022 and 1941, shown in Figure 9, exhibit little resemblance. The difference is marked in the character of the surface waves (bottom frame). Since the waveform of the 1941 earthquake differs significantly from those of the 2022 and 1973 events, it most likely did not rupture the same area as the other two.
Directivity and azimuthal dependence of ground motion
As discussed above, a source directivity towards NW during the mainshock is clearly seen in the results of inversion of slip on the fault as well as in plots of MRS and E R as a function of azimuth. A downdip directivity is also visible, albeit weakly, in the slip inversion of the M w6.7 aftershock. In this section, we examine, in detail, the effect of the source directivity on the ground motion at regional distances. The stations whose recordings are used in the analysis are shown in Figure 10.
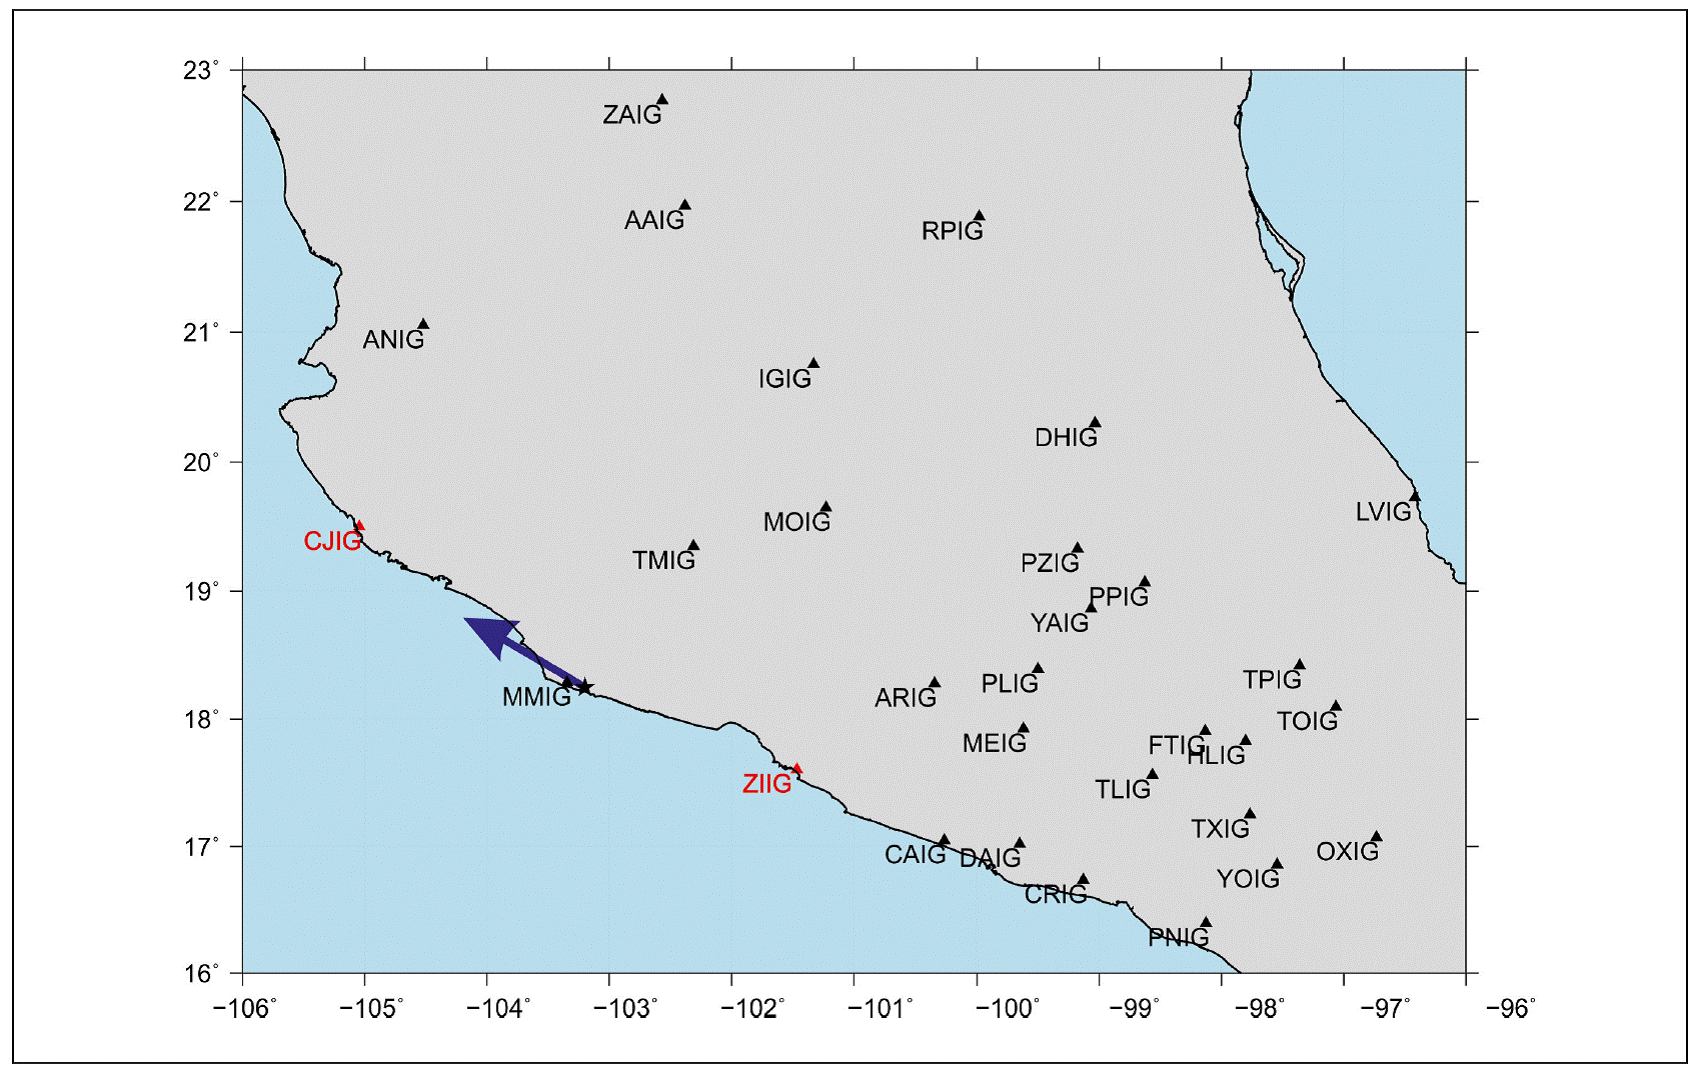
Figure 10 Some of the regional SSN stations whose recordings are analyzed in this study. PZIG is located in CU, Mexico City. Blue arrow near the station MMIG indicates the direction of rupture propagation during the 2022 mainshock.
(a) Visual examination of the recordings
Figure 11a compares mainshock waveforms at stations CJIG (azimuth ϕ = 3080) and ZIIG (ϕ = 1090). The stations are located at nearly the same distance but in opposite directions (Figure 10). The shorter duration and higher amplitude of the intense part of the motion at CJIG compared with ZIIG strongly suggests a rupture propagation towards the NW. The waveforms during the aftershock at the same two stations are shown in Figure 11b. The accelerations, in this case, are higher at ZIIG (which may be due to site effect) than at CJIG, while velocities and displacements are about the same. These waveforms do not support along strike directivity during the major aftershock; rupture propagation to the east is certainly viable.
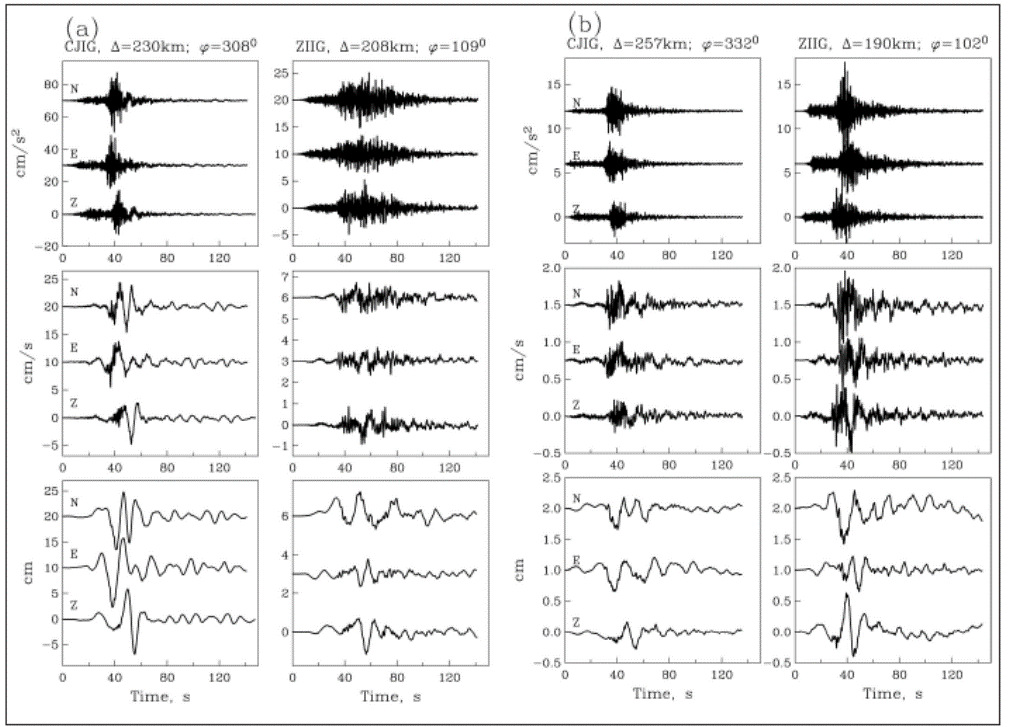
Figure 11 (a) Comparison of mainshock waveforms at stations CJIG (azimuth ϕ = 3080) and ZIIG (ϕ = 1090). The stations are located at nearly the same epicentral distance but in the opposite direction (Figure 10). (b) Same as (a) but for the M w 6.7 aftershock.
(b) Spectral ratios of the mainshock to the aftershock ground motions
Under the assumption that the mainshock and the after-shock are collocated and have similar focal mechanisms, the spectral ratio of the ground motion at a given station provides the ratio of their moment rate spectrum, MRS. In the absence of directivity, the MRS is expected to be independent of azimuth. Figures 12a,b,c,d illustrate the spectral ratios at selected stations, each frame comprising stations in a range of azimuth with respect to the mainshock directivity. Frame (a): rupture propagating towards the stations; frame (b): station perpendicular to the rupture propagation; frame (c) and (d): rupture propagating away from the station. The spectral ratios were computed for each of the three components of the ground motion. The figures also show the geometric mean of the ratios in each frame. For reference, the theoretical spectral ratio corresponding to Brune ω2 source model (Brune, 1970) with constant stress drop of 3 MPa is included in each frame.
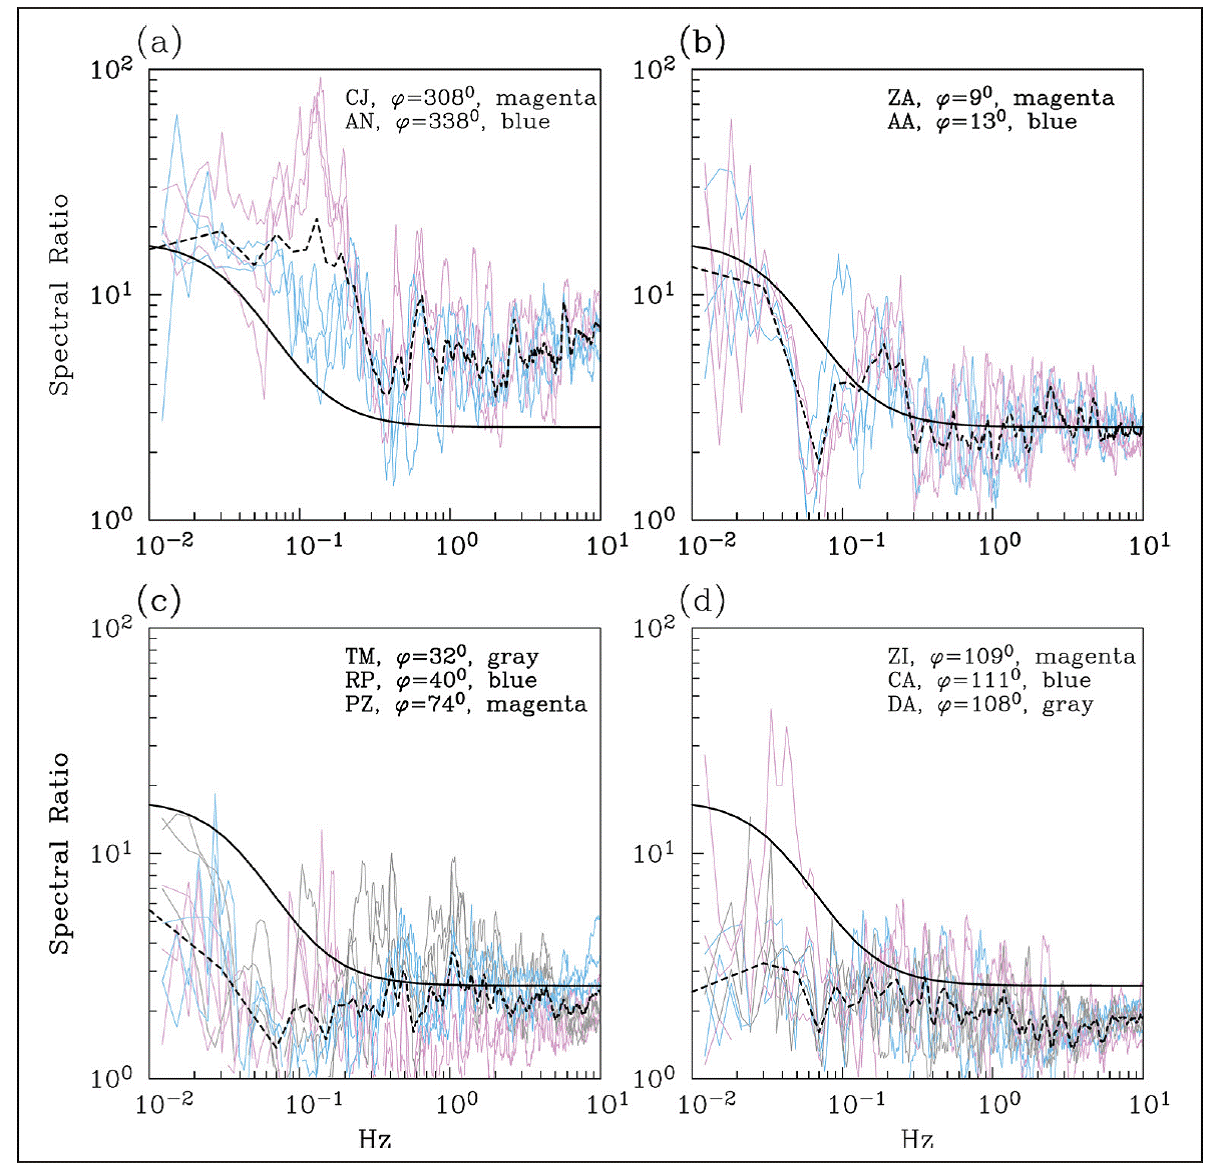
Figure 12 Spectral ratio of ground motion at selected stations during the mainshock to the M w6.7 aftershock. Frames (a) to (d) show the ratios at stations grouped in azimuthal range. The Figures also show geometric mean of the ratios in each frame. For reference, theoretical spectral ratio corresponding to Brune ω2 source model are included (see text).
A strong dependence of the ratios on azimuth is immediately obvious. With respect to the theoretical spectral ratio, the observed ratios are higher in frame (a), about the same in frame (b), but lower in both frames (c) and (d). Directivity towards NW during the mainshock and an absence of ESE directivity during the aftershock are consistent with the observations.
(c) PGA and PGV ratios of mainshock to aftershock
The directivity effect should also be reflected in the azimuthal dependence of PGA and PGV ratios of the mainshock to the aftershock. Horizontal and vertical PGA ratios, plotted in Figure 13a, are a strong function of station azimuth φ but not of distance R. Here, horizontal PGA = [(AN2 + AE2) / 2]1/2, where A N and A E are maximum accelerations on NS and EW components. The ratios rapidly decrease from about 12 to 3 at stations in the azimuthal range 300° < φ < 360°. These stations are in the forward direction for the mainshock and, possibly, in the backward direction for the aftershock. The ratio slowly decreases from about 3 to 1 in the range 0° < φ < 115°. Stations in this azimuthal range are in the backward direction for the mainshock and, probably, in the forward direction for the aftershock. Again, the ratios in the figure are in agreement with the directivity of the two earthquakes. The effect of the directivity on the PGA ratios is better appreciated by comparing them with the horizontal PGA ratio of 2.5 expected from the ground motion prediction equation (GMPE) for Mexican subduction thrust earthquakes of M w7.6 and M w6.7 (Arroyo et al. 2010).
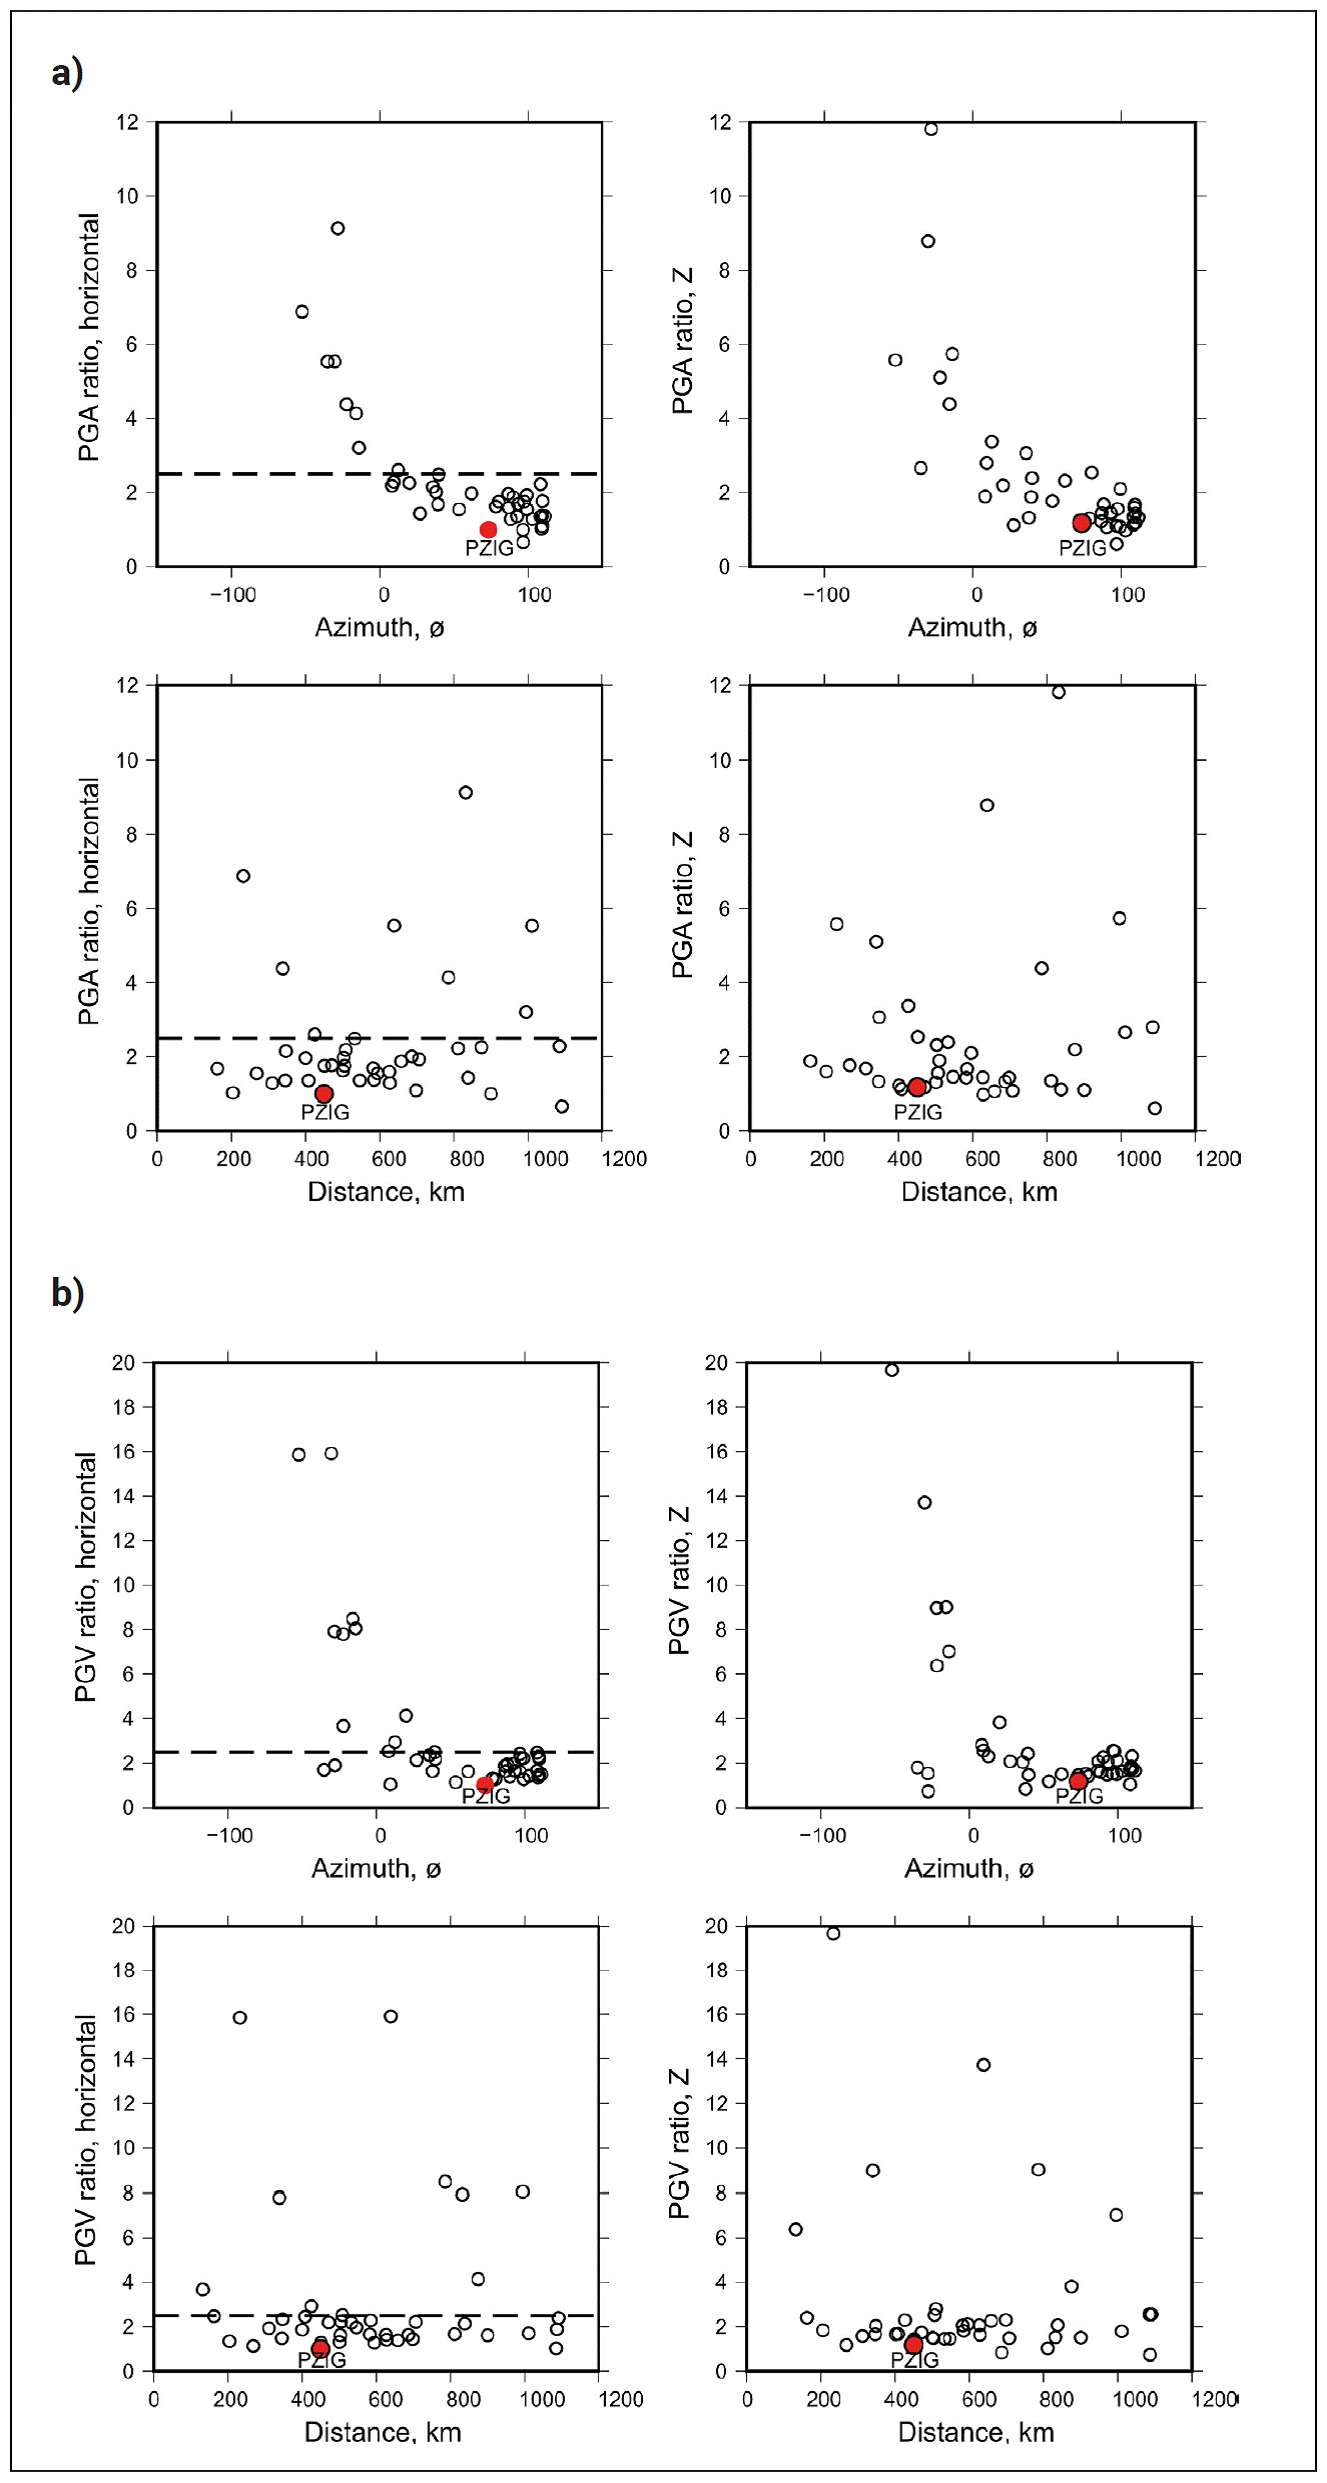
Figure 13 Peak ground motion ratios of the mainshock to the M w 6.7 aftershock as a function of azimuth and distance. (a) PGA ratios. Dashed horizontal line shows the predicted ratio of 2.5 for the horizontal component by the GMPE of Arroyo et al. (2010). Station PZIG, shown by a red dot, refers to a station in CU, Mexico City. (b) PGV ratios. The ratios are strongly dependent on azimuth and are independent of distance.
PGV ratios, shown in Figure 13b, follow the same trend as the PGA ratios. However, the maximum PGV ratios in the azimuthal range 300° < φ < 360° exceed 20.
(d) PGA and response spectral amplitudes as function of azimuth and distance
PGA and Sa (T=2 s) for the mainshock and the aftershock are plotted in Figure 14 as a function of the closest distance from the fault surface, Rrup. Only stations with Rrup < 600 km are included in the figure. The stations are grouped in 3 bins as a function of their azimuth: bin 1: 3300 ≤ φ ≤ 300; bin 2: 300 < φ ≤ 900; bin 3: 900 < φ ≤ 1200. All data, except one, are contributed by stations at Rrup > 120 km. Superimposed on the data are the predicted curves from the GMPE of Arroyo et al. (2010). We note that: (i) In general, PGA values are above the predicted curves for both events irrespective of the bin. (ii) Sa (T=2 s) values for the aftershock in all bins are greater than the predicted curve. The values are smaller than predicted in bin 3 for the mainshock, consistent with its NW source directivity.
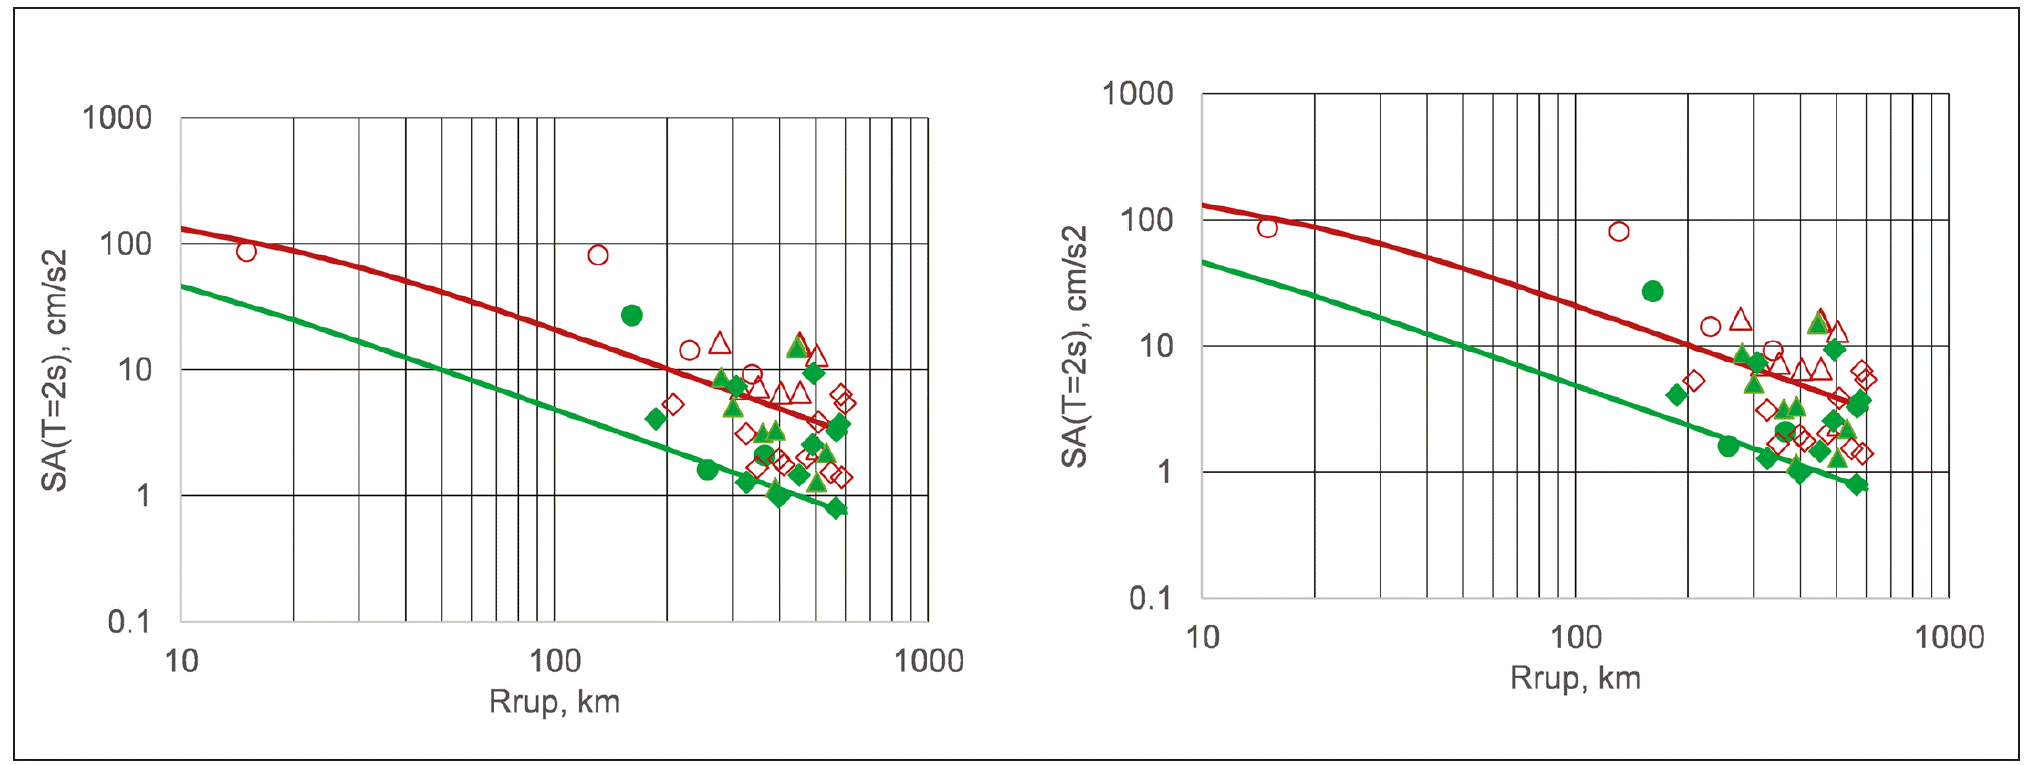
Figure 14 PGA and Sa (T=2 s) during the M w 7.6 mainshock (red symbols) and the M w 6.7 aftershock (green symbols) as a function of the closest distance from the fault surface, Rrup. Circles: bin 1 (3300 ≤ φ ≤ 300), triangles: bin 2 (300 < φ ≤ 900), diamonds: bin 3 (900 < φ ≤ 1200). Continuous lines are median predictions from the GMPE of Arroyo et al. (2010) .
Ground motion in the Valley of Mexico
Since there was a difference of 0.9 in the magnitude of the mainshock and the major, M w6.7 aftershock, it was surprising that they were felt with nearly equal intensity in the Valley of Mexico. At CU, a hill-zone reference site in Mexico City, the PGA on the NS, EW, and Z components during the mainshock and the aftershock were (5.5, 4.5, 2.9 gal) and (6.3, 4.2, 2.5 gal), respectively. Was the source directivity the cause of the similarity of the PGAs?
A site-specific GMPE for CU from subduction thrust earthquakes has been recently developed by Arroyo et al. (2022) . Figure 15 compares the observed Sa with the predicted ones for M w7.6 and M w6.7 earthquakes. As expected, the observed Sa curves are similar. Predicted Sa for an M w 7.6 earthquake, on the other hand, is significantly higher than the observed one. The converse is true for the M w6.7 aftershock: the observed Sa is much greater than expected. The source directivity away from CU during the mainshock explains the smaller Sa. Greater Sa during the aftershock may be attributed to rupture towards CU.
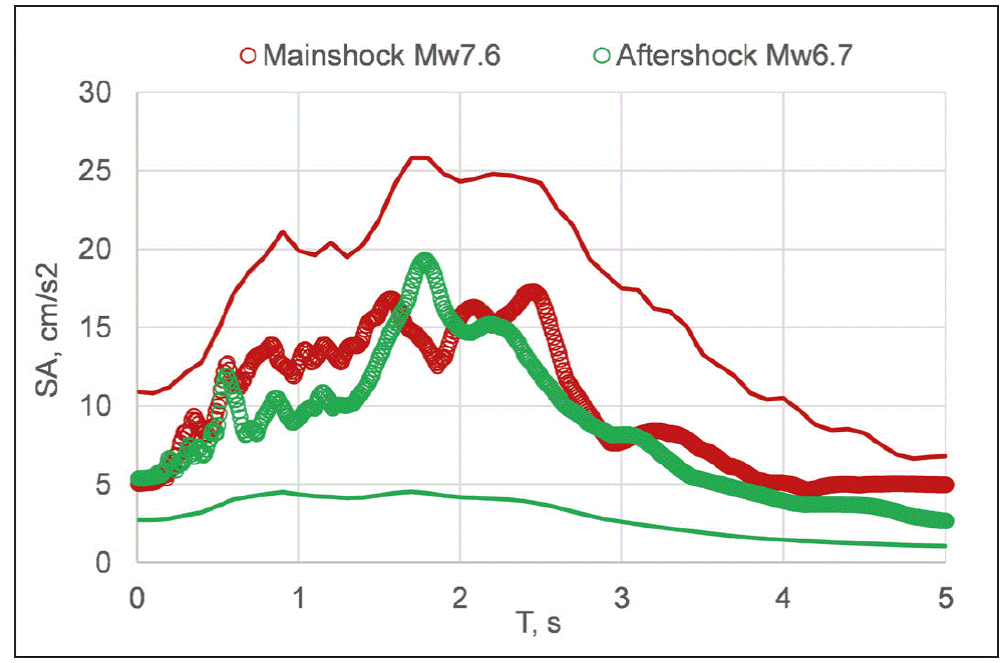

Figure 15 Observed Sa at CU, Mexico City, during the M w7.6 mainshock (red circles) and the M w6.7 aftershock (green circles). Continuous lines are median predictions (red: M w 7.6, green: M w 6.7) from the GMPE of Arroyo et al. (2022) . The trends are consistent with rupture directivity away from CU during the mainshock and towards CU during the aftershock.
To further appreciate the role played by directivity, we used the CU recording of the M w6.7 aftershock as an empirical Green´s function (EGF) and synthesized ground motion from a target M w7.6 earthquake. A meth-od developed by Ordaz et al. (1995) was followed in the synthesis. The stress drop, Δσ, was assumed to be the same for both events and taken as 3 MPa. The median of Sa simulations for the postulated M w7.6 event as well as the observed Sa during the mainshock are shown in Figure 16. We find that an M w7.6 earthquake with directivity similar to the aftershock would have produced Sa at CU about 2.5 times greater than the observed one.
Probability of having observed three major earth-quakes on the same day
Let us estimate the probability of having observed what we observed: three major earthquakes (M ≥ 7) that occur on exactly the same day in the last 120 years. Let's start with basic data and an assumption:
(1) In central Mexico, an average of 0.46 earthquakes occur with M ≥ 7 per year; that is, on average one every 2 years, more or less.
(2) We assume that, in time, earthquakes occur as a Poisson process; this is relevant in order to know the probability distribution of the number of events that we would observe in any given year
It is not difficult to calculate the probability that, in the span of 120 years, we would have observed 2 or 3 earth-quakes occurring on the same day. On September 19, let's say, but the probability would be the same if we chose another date. Although the calculation is not difficult, it is easier to calculate the probabilities by simulation.
Using a sample of 10 million possible realizations from those 120 years, we obtained that the probability of having observed 2 events on September 19 is 0.0103 and the probability of having observed 3 is 0.0005154.They seem improbable events. But, in reality, this is not the probability that interests us. Deep down, it strikes us that we have had 3 major earthquakes on the same date, not specifically on 19 September. Indeed, if we had observed 3 major earthquakes on, say, 24 May, we would be just as surprised.
So, the probability we are interested in is the probability of having observed 3 major earthquakes on the same date, not necessarily September 19. This is more difficult to calculate with combinatorial analysis (there is a closed formula, but complicated to apply), although just as easy to calculate with simulations. We obtain that the probability of having observed 2 earthquakes on the same date, whatever it may be, is 0.98 and the probability of having observed 3 earthquakes is 0.18.
This is amazing. According to this analysis, it is extremely likely to have two large earthquakes on the same date if we look at 120 years at a rate of 0.46 earthquakes/year. And on the other hand, the probability of observing 3 is low, but not astronomically low. If the probabilities are that big, both events should have already happened. Well, yes: before 19 September 2022 there were already 6 pairs of large events that had occurred on the same dates and another triad of events that occurred on 7 June (7 June 1911, M s 7.7; 7 June 1982, 06:52, M s 6.9; 7 June 1982, 10.59, M s 7.0). We just didn't remember.
Why choose an observation period of 120 years? We chose 120 years because, on the one hand, it is the period (1900-2022) in which we consider that the earthquake catalog is complete for M ≥ 7. On the other hand, we chose it because it seems that we would be equally surprised if the first event of the sequence of 3 on the same date had occurred in 1910, let's say, and not in 1985; but maybe we wouldn't be so surprised, so we calculated the probabilities for other lapses (Table 7). We confirm that, in reality, what we observed was not so improbable.
Discussion and conclusion
There is evidence suggesting that the 2022 earthquake (M s 7.6, M w7.6) is a quasi-repeat of the 1973 event (M s 7.5, M w7.6): their aftershock areas approximately coincide, the Galitzin seismograms of the two events at DBN are reasonably similar, and the magnitudes are the same. Curiously, the aftershocks of both earthquakes were also concentrated at the SE end of the rupture area. This distribution of the 1973 aftershocks led Reyes et al. (1979) to suggest that the rupture during 1973 propagated towards the NW. This directivity is certainly true for the 2022 earthquake. However, finite fault modelling of the 1973 earthquake by Santoyo et al. (2006) , using teleseismic P waves recorded at 8 stations, does not show the NW directivity. Also, an increase in the seismic moment by a factor of about 2 for the 1973 earthquake as the period increased from 100 to 300 s, noted by Reyes et al. (1979), is entirely absent from the 2022 earthquake (Table 6) . These differences could be a consequence of increase in the quality and quantity of data and improvement in the analysis technique since 1973. It is also possible that the differences are real and the details of the rupture process of the two events differed even if their source areas were roughly the same.
Reyes et al. (1979) suggested that the 1973 earthquake may have been a repeat of the 1941 event (M s7.8). Galitzin seismogram of the 1941 earthquake at DBN, however, bears little resemblance with those of the 1973 and 2022 events (Figures 8 and 9) which suggests that the source region of the 1941 earthquake was different from those of the other two events.
A unilateral rupture propagation, along the strike towards the NW, during the 2022 mainshock is a robust feature of the finite-fault models. Azimuthal variation of moment rate spectrum and radiated seismic energy estimated from tele-seismic P waves also support the NW directivity. According to the USGS finite fault model, the rupture area over which the slip is greater than 15% of its maximum value (3.2 m) is 3600 km2 (90 km × 40 km). The average slip over this area is 1.48 m, which yields a static stress drop of 3.8 MPa.
If we accept that the 1973 and 2022 earthquakes ruptured the same area, then the recurrence period is 50 years. For a plate convergence rate of 6.0 cm/yr and perfect coupling, the accumulated slip deficit in 50 years would have been 3.0 m.
If we ignore post-seismic slip, then the estimated coupling ratio on this segment of the plate boundary, corresponding to a coseismic slip of 1.48 m, is 0.49. This estimate agrees surprisingly well with the GPS -derived coupling ratio for this segment (Cosenza-Muralles et al., 2022a) and is slightly smaller than the coupling of about 0.6 estimated from InSAR and GNSS data (Maubant et al., 2022). The post-seismic slip, however, may not be negligible. Similar or larger seismic moments than the coseismic moments were released in the post-seismic slip following the earthquakes of 2003 Tecomán (M w7.5) and 1995 Colima-Jalisco (M w8.0) (Cosenza -Muralles et al., 2022b). The areas of post-seismic slip of these two earthquakes partly overlap their rupture areas and, in both cases, extend further downdip. These earthquakes, however, occurred on the RIVE-COCOS plate boundary (Figure 1). Characteristics of post-seismic slip on the COCOS-NOAM plate interface, where the 2022 earthquake occurred (Figures 1 and 3), might be different, an issue that future studies will, no doubt, address.
Our analysis of ground motions at regional distances confirm the mainshock directivity to the NW. In our study, we focused on the ratio of ground motions during the main-shock and the major M w6.7 aftershock, thus minimizing the site effect. These results can be interpreted by a strong NW directivity during the mainshock and an ENE or negligible directivity during the M w6.7 aftershock. Because of the directivity, the ground motions in the Valley of Mexico during the 2022 mainshock and the M w6.7 aftershock were about the same in spite of 0.9 difference in their magnitudes.
It is well known that the source directivity has a profound effect on the azimuthal variation of ground motion and, hence, in the damage distribution (e.g., Somerville et al., 1997; Koketsu et al., 2016). Directivity has been reported even during small earthquakes (Boatwright, 2007; Calderoni et al., 2013; Seo et al., 2022). Strong directivity was reported during two moderate earthquakes in the Guerrero seismic gap (8 May 2014, M w6.5; 11 May 2014, M w6.1) (Singh et al., 2019). The recent Acapulco earthquake of 8 September 2021 ( M w7.0) had a strong NE directivity (Iglesias et al., 2022). Directivity, almost certainly, played a major role in causing damage to Mexico City during the1985, Michoacán earthquake (e.g., Anderson et al. , 1986; Kanamori et al., 1993). Similar to the 2022 event, the great Colima-Jalisco earthquake of 1995 (M w 8.0) had a NW directivity (e.g., Courboulex et al., 1997; Hjörleifsdóttir et al. , 2018) . Miranda y Marron (1911-1912) mentions that the 7 June 1911 earthquake (M s 7.7), whose location is poorly known but was in the Michoacán - Colima region, was very strongly felt in Mexico City, causing considerable damage and leaving 40 persons dead. The intensity of the earthquake in the city was much stronger than for earthquakes of similar magnitude that occurred along the coast of Guerrero between 1907 and 1911. Isoseismic contours of the 1911 earthquake are elongated towards the east. Eastward directivity towards Mexico City provides a plausible explanation for the intensity with which it was felt in the city. The earthquakes of 2022 and others events mentioned above once again bring into focus the importance of source directivity in the recorded and simulated ground motion in Mexico.
Finally, we find that observing three major earthquakes (M≥ 7) on the same day in central Mexico is not so improbable.


 text new page (beta)


