


 text new page (beta)
 English (pdf)
 Article in xml format
 Article references
 Send this article by e-mail
 Cited by SciELO
  Similars in
SciELO
Similars in
SciELO 
 Permalink
Introduction
PM2.5 emission is known as a major challenge to environmental health and is the cause of approximately 7 million deaths annually (Alikhani et al. 2021). Epidemiological research has shown that PM2.5 will be a serious threat to human health (Ortega-Rosas et al. 2021; Thangavel et al. 2022). Based on this research, PM2.5 has been shown to dam age the cardiovascular system, nervous system, respiratory system and immune system and so on (Du et al. 2016; Yang et al. 2020). This can seriously affect long-term economic, social, welfare and national health development (Ranft et al. 2009; Lim et al. 2011; Meza-Figueroa et al. 2022). PM is one of the primary air pollutants that pose a constant threat to health, well-being and quality of life. These compounds are composed of a complex mixture of chemical, physical and biological components (Schneider et al. 2015; Schneider et al. 2016; Ramirez et al. 2020; Rojas et al. 2019; Hu et al. 2020; Mellouki et al. 2020; Silva et al. 2020a; Silva et al. 2020b; Zamberlan et al. 2020; Schiavo et al. 2021). The fine particles stay in the atmosphere longer than coarse particles, so these can enter the respiratory system very quickly (Juginović et al. 2021). Due to their aerodynamic properties, these particles can be easily removed during the wet and dry deposition process. The fine particles are also able to be easily transported through the respiratory system by penetrating the pulmonary alveoli and thus lead to pulmonary deposition and systemic displacement (Schiavo et al. 2021).
The results of studies in this field have shown that long-time exposure to atmospheric particles leads to complications and various respiratory and lung diseases (Xiao et al. 2016; Bourdrel et al. 2017; Liu et al. 2020; Moller et al. 2020; Gao and Sang 2020; Nho 2020; Schiavo et al. 2021; Zhao et al. 2022; Voss et al. 2022). Also, recent studies show that fine particles (diameter less than 2.5 µm) and ultrafine particles (diameter less than 0.1 µm) are the most toxic airborne particles (Xiao et al. 2016; Soppa et al. 2019). Depending on the source of the contamination, the PM varies in size and composition. Major sources of primary particles are industrial processes, traffic characteristics (i.e. traffic volume and percentage of gasoline and diesel vehicles) and topography, biomass burning (as agricultural products incineration, forest and range fires and Garbage disposal), road traffic, power plants, domestic burning (coal, wood, etc.), incineration, and resuspension of road and construction dust. (Dias et al. 2014; Goel and Kumar 2015; Dalmora et al. 2016; Kecorius et al. 2016; Abramesko and Tartakovsky 2017; Chen et al. 2017; Habre et al. 2018; Islam et al. 2019; Stacey 2019; Moller et al. 2020; Agudelo-Castaneda et al. 2019; Li et al. 2021). Due to the differences in air quality in different regions (like some cities in Europe, North America and China), many studies inside and outside the country have examined factors that are closely related to changes in air quality, such as meteorological conditions, changes in surface coverage,urbanization and economic development, transportation methods and urbanization (Oroji et al. 2018b; Oroji et al. 2019; Zhao et al. 2020; Isaev et al. 2022; Domhagan et al. 2022). Therefore, further investigations into the impacts on health effects of short-term and long-term exposures to urban air pollution are warranted. One of the indicators which are widely used for evaluating the impacts of indoor pollution resulting from outdoor pollution is the ratio of indoor to outdoor (I/O ratio) air pollution (I/O ratio) (Meng et al. 2005; Brunekreef et al. 2005).
Some factors, such as distance from polluting resources, smoking, cooking, climate, the life of the building, and its architectural characteristics can affect indoor air pollution which is resulted from outdoor air pollution (Ji et al. 2015; Parajuli et al. 2016; Zhou et al. 2018). Several studies have been conducted to measure the PM concentration and levels of exposure to particle in indoor air. Branis and Šafránek (2005), investigated the mass concentration, mineral composition, and morphology of suspended particles re-emitted by children during scheduled physical exercise in urban, suburban, and rural elementary school gymnasiums in Prague (Czech Republic). Oroji et al. (2021) investigated the penetration and deposition of indoor particles and found that the penetration of indoor particles is determined by particle size and air tightness. Bhangar et al. (2011) investigated the sources of and daily exposure to indoor and outdoor particle by measuring ultrafine particles in houses in California. This research revealed that residential exposure to particle was determined by indoor sources and the infiltration factor. Mullen et al. (2011) measured the ultrafine particles in elementary schools in California and found that the main cause of particle exposure was outdoor sources.
The metropolis of Tehran, the capital of Iran, is one of the most polluted cities in the region and the world, and increasing the concentration of PM is one of the biggest challenges for its inhabitants. A significant volume of atmospheric particle concentrations in Tehran is related to human resources, which are produced by motor vehicles, industrial factories, and home heating systems. Another part of the source of atmospheric particles in Tehran is local storms (Heger and Sarraf 2018). In recent years increased personal vehicle traffic in the city and the construction of high-rise buildings have raised the concentration of atmospheric particles in the area to dangerous levels and drastically reduced the air quality (Oroji 2018a; Oroji 2021). In this study, we intend to determine the I/O ratio in residential houses by examining the concentration of particles inside and outside. Because so far, the amount of exposure of people living in homes in Tehran with suspended particles has not been calculated. Study and research in the field of physical and chemical properties of suspended particles, identifying their behavior in different climatic conditions and recognizing the sources that produce them can improve decisions about air pollution control and management.
Methods and Materials
Area of study
The city of Teheran (capital of Iran), located on the southern slops of the Alborz Mountains with and area of about 73 km2, is one of the most populous metropolises in the world with a population of about 15 million people (Arhami et al. 2018). The geographical location of the study area is shown in Figure 1. Population growth, land cover, land-use change and, most importantly, a significant increase in the number of moving pollutants (motor vehicles) have led to an increase in air pollution, which has posed significant risks to the ecosystem and human health and safety (Alizadeh Choobari et al. 2016). In the last decade, air pollution, including the presence of PM, are recognized as the most important environmental problem in Tehran. Local storms, industries (such as manufacturing industries, electricity generation with fossil fuels and sand mines), urban transport (such as motor vehicle) and soil erosion are the most are the most important sources of pollution in Tehran. The geographic location and prevailing wind direction (specify wind direction in Teheran) limits natural ventilation, increase Temperature inversions in wet seasons and the effects of local dust storms (Halek et al. 2010a; Halek et al. 2010b).

Sampling method
Atmospheric PM sampling was performed in four seasons from August 2020 to July 2021. Due to the area, four fixed sampling station were used. Sampling time varied from 6 to 12 hours. The sampling process was performed to determine the concentration of particles inside while people were at home. Sampling stations were between 250 and 600 meters from the first huge traffic street. Also, the age of the buildings at the sampling stations was between 12 and 19 years. More than 98% of the particles are less than 1 µm. They can advance far more deeply into the human organism and even pass alveoli and cellular membranes. In this way, they reach the blood circulation directly, where they are frequently triggering cardiovascular illnesses. They arise mostly in the case of combustion processes (e.g., traffic, heating systems) and with industrial processes (e.g., production, power generation) and are not visible to the human eye (Juginović et al. 2021). Due to the risk of fine particles and the possibility of their impact on human health, in this study, PM0.4 and PM2.5 were examined. A multi-stage virtual shock absorber that traps particles on steel plates with a constant airflow was used for sampling. The sampling airflow in this collector was 28.3 liters per minute. The fiberglass filters were used to collect suspended particles. The collected samples were prepared for chemical analysis. Also, the Scanning Electron Microscope (SEM) method was used to study the size and morphology of suspended particles. In this method, particle surfaces with magnifications of 5000x, 10000x, 20000x and 50000x were studied. The particles were imaged a Zeiss EV050XP SEM, and also, X-ray energy spectra were measured using a Bruker Quantax 200 EDS system with a Peltier-cooled X Flash silicon detector. The Inductively coupled plasma-mass spectrometry (ICP-MS) method was used to study the chemical composition of PM.
Results and Discussion
Outdoor Particle Concentration
Table 1 shows the monthly report of PM concentrations in stations in the study area. According to the measurement results in the Velenjak station, the highest concentration of PM2.5 was 161±24.6 µg/m3 that recorded in October. Also, the lowest concentration was recorded at 25±4.3 µg/m3, in November. The average of PM2.5 in this area was 75±11.1 and 69.9±12.6 µg/m3 for the dry months (June to November) and wet months (December to May), respectively. The results of the aerodynamic distribution of particles in this area showed that in hot and dry months (such as August and September), the highest and lowest average concentrations of PM0.4 in this area were recorded at 11.2±1.3 and 10.1±1.1 µg/ m3, respectively. For cold and wet months (such as December and January), the highest and lowest average concentrations of PM0.4 in this area were recorded at 16.3±2.6 and 8.4±1 µg/m3, respectively. The average concentration of PM2.5 and smaller for the whole sampling period in this area was 72.74±15.4 µg/m3. The results of measurement at the Azadi square station showed that the highest concentration of PM2.5 was 187±25.6 µg/m3 that recorded in November. Also, the lowest concentration was recorded at 55±14.5 µg/m3, in February. The average concentration of PM2.5 was 109.5±17.4 and 127.27±21.7 µg/m3 for the dry months and wet months, respectively. The results of the aerodynamic distribution of particles in this area showed that in hot and dry months, the highest and lowest average concentrations of PM0.4 in this area were recorded at 26.6±4.4 and 13.2±2.1 µg/m3, respectively. Also, for cold and wet months, the highest and lowest average concentrations of PM0.4 in this area were recorded at 18.1±2.3 and 9.1±1.2 µg/m3, respectively. The results showed that the average concentration of PM2.5 was 117.4±19.5 µg/m3. In the South station, the highest and lowest concentration of PM2.5 was 160±18.6 and 41±6.8 µg/m3, which were recorded in December and January, respectively. Also, the average concentration of PM2.5 was 90.4±16.7 and 85.1±15.2 µg/m3 for the dry months and wet months, respectively. The results showed that in hot and dry months, the highest and lowest average concentrations of PM0.4 in this area were recorded at 19.2±3.6 and 14.6±3.3 µg/m3, respectively. Also, the highest and lowest average concentration of PM0.4 for cold and wet months, were recorded at 17.8±2.2 and 10.3±2.1 µg/m3, respectively. The average concentration of PM2.5 was 87.9±19.4 µg/m3. Based on the sampling results in the Hakimiyeh station, the highest concentration of PM2.5 was 153±18.4 µg/m3 that recorded in December. While the lowest concentration was recorded at 28±4.4 µg/m3, in November. Also, the average concentration of PM2.5 in this area was 79.81±12.6 and 70.62±14.8 µg/m3 for the dry months and wet months, respectively. The results of the aerodynamic distribution of particles in this area showed that in hot and dry months, the highest and lowest average concentrations of PM0.4 in this area were recorded at 13.4±1.6 and 11.6±2.4 µg/m3, respectively. Also, for cold and wet months, the highest and lowest average concentrations of PM0.4 in this area were recorded at 16.8±2.3 and 11.4±1.2 µg/m3, respectively. The average concentration of PM2.5 for the whole sampling period in this area was 76.5±18.5 µg/m3.
Table 1 Monthly report of particle concentrations Outdoor in the study area (µg/m3).
| Date | Velenjak | Hakimiyeh | Azadi squar | South | ||||
|---|---|---|---|---|---|---|---|---|
| PM0.4 | PM2.5 | PM0.4 | PM2.5 | PM0.4 | PM2.5 | PM0.4 | PM2.5 | |
| April 2021 | 13.5 | 73.87 | 12.2 | 67.1 | 13.2 | 97.77 | 11.8 | 85.58 |
| May 2021 | 13.3 | 67.71 | 11.6 | 54.96 | 13.1 | 96.67 | 12.3 | 77.22 |
| June 2021 | 14.8 | 69.4 | 12.8 | 68.56 | 12.4 | 106.51 | 13.5 | 78.78 |
| July 2021 | 15.7 | 83.9 | 14.1 | 79.75 | 15.7 | 123.46 | 14.7 | 93.41 |
| August 2020 | 14.3 | 72.41 | 15.3 | 66.21 | 17.6 | 107.11 | 16.3 | 70.96 |
| September 2020 | 14.6 | 84.5 | 17.8 | 77.54 | 17.2 | 122.8 | 17.2 | 84.71 |
| October 2020 | 11.2 | 73.46 | 10 | 81.63 | 13.4 | 121.16 | 11.1 | 90.6 |
| November 2020 | 11.5 | 61.83 | 10.7 | 67.92 | 12.2 | 119.61 | 11.5 | 82.56 |
| December 2020 | 10.4 | 84.93 | 9.5 | 105.1 | 11.8 | 153.13 | 10.4 | 119.48 |
| January 2020 | 8.2 | 67.65 | 7.2 | 85.66 | 11.7 | 124 | 10.2 | 97.1 |
| February 2020 | 8.7 | 59.6 | 7.6 | 78.96 | 9.3 | 117.4 | 8.7 | 86.92 |
| March 2020 | 9.3 | 58.7 | 7.4 | 77.56 | 9.2 | 102.47 | 8.5 | 86.64 |
Indoor Particle Concentration
The results of indoor particle concentration are showed in Table 2. In residential houses in the northern areas of the city, due to excessive use of natural ventilation in the cold months, smoking, and cooking, see a significant increase in indoor suspended particles. Meanwhile, the houses in this area are equipped with modern cooling, heating, and air conditioning systems. At Velenjek station, the average concentration of fine particles (PM2.5) for spring was 48.74±9.4 µg/m3. The concentration was higher than other stations. The highest concentration was recorded in the spring for Azadi station with a value of 68.21±7.5 µg/m3. This value was 10.65±2.35 µg/m3 for PM0.4. According to the results, the increasing trend in the concentration of indoor particles in the warm months of the year was more than in the cold months of the year. These changes were significant in residential homes that an adequate ventilation. In residential houses that did not have proper cooling and ventilation systems, the I/O value was close to 1. This increase in concentration in 22.5% of residential homes was due to the type of cooking in the kitchen as well as smoking. In the Hakimiyeh station, the concentration of indoor particles was not much different from the concentration of outdoor particles in the building. The mean Pearson correlation coefficient (r) was 0.785. Also, in the northern areas (such as Velenjak station), due to the difference in temperature and relative humidity, the lowest difference between the concentration of outdoor and indoor particles was observed. The concentration of indoor particles in South station was less different from the concentration of outdoor particles. At this station, the average I/OPM2.5 was 0.732. While this value was about 0.788 for PM0.4.
Table 2 Average Concentration of the size distribution of the indoor.
| Stations | Diameter Particle (µm) | Concentration (µg/m3) | |||
|---|---|---|---|---|---|
| Spring | Summer | Autumn | Winter | ||
| Hakimiyeh | PM0.4 | 8.22 | 9.2 | 10.34 | 6.25 |
| PM2.5 | 52.15 | 49.54 | 55.61 | 50.45 | |
| South | PM0.4 | 9.13 | 10.22 | 12.45 | 8.64 |
| PM2.5 | 53.17 | 60.55 | 60.16 | 55.34 | |
| Velenjak | PM0.4 | 7.56 | 8.32 | 9.22 | 5.76 |
| PM2.5 | 48.74 | 45.24 | 50.46 | 45.62 | |
| Azadi square | PM0.4 | 8.82 | 9.73 | 10.31 | 7.14 |
| PM2.5 | 52.63 | 58.56 | 58.25 | 50.42 | |
Indoor/Outdoor Particle Concentration
The results indoor/outdoor particle concentration ratio are shown in Table 3. The results showed that the indoor/outdoor particles concentration ratio is high (~1) in the study area. This rate (I/O) was higher in the cold and wet months of the year in northern areas. Also, in the southern area (Southern station) concentration of the indoor/outdoor particles was high in most months of the year. Using natural ventilation instead of mechanical ventilation is the main factor for the high indoor/outdoor particle concentration ratio. Field research in these areas showed that many residential houses use natural systems for air conditioning. Also, the life of the building, long life of doors and windows, cooking and cigarette smoke are the factors that cause high indoor/outdoor particles concentration ratio in these areas. The eastern regions of the study area, due to being in the direction of the prevailing wind direction, are more affected by atmospheric PM. Based on these results, the concentration of PM with a diameter of less than 0.4 µm in these areas was higher than in other stations. Accordingly, the ratio of I/O was higher in the eastern area than in other areas. Due to the concentration of PM produced by pollutant sources in the western parts of the study area, the ratio of I/O was at a high level. The I/O ratio in spring was close to 1 in all stations. This ratio was higher for particles with a diameter of 0.4 µm (more than 2.5 µm). Also, the results showed that the penetration of particles produced from external pollutants into residential houses is high. So, people living in the area are likely to be exposed to PM for a long time. These conditions can cause respiratory and cardiovascular diseases.
Table 3 Monthly reporting indoor/outdoor particle concentration ratio in the study area.
| Date | Velenjak | Hakimiyeh | Azadi square | South | ||||
|---|---|---|---|---|---|---|---|---|
| I/OPM0.4 | I/OPM2.5 | I/OPM0.4 | I/OPM2.5 | I/OPM0.4 | I/OPM2.5 | I/OPM0.4 | I/OPM2.5 | |
| April 2021 | 0.78 | 0.62 | 0.87 | 0.72 | 0.83 | 0.77 | 0.87 | 0.72 |
| May 2021 | 0.81 | 0.64 | 0.82 | 0.64 | 0.84 | 0.78 | 0.85 | 0.76 |
| June 2021 | 0.82 | 0.68 | 0.75 | 0.68 | 0.81 | 0.68 | 0.82 | 0.78 |
| July 2021 | 0.72 | 0.64 | 0.71 | 0.67 | 0.8 | 0.58 | 0.84 | 0.71 |
| August 2020 | 0.71 | 0.58 | 0.68 | 0.65 | 0.82 | 0.72 | 0.77 | 0.68 |
| September 2020 | 0.68 | 0.55 | 0.66 | 0.76 | 0.75 | 0.67 | 0.76 | 0.67 |
| October 2020 | 0.67 | 0.43 | 0.71 | 0.67 | 0.74 | 0.71 | 0.72 | 0.72 |
| November 2020 | 0.65 | 0.47 | 0.7 | 0.66 | 0.73 | 0.7 | 0.74 | 0.77 |
| December 2020 | 0.55 | 0.57 | 0.65 | 0.68 | 0.72 | 0.72 | 0.67 | 0.71 |
| January 2020 | 0.74 | 0.58 | 0.66 | 0.72 | 0.76 | 0.68 | 0.67 | 0.77 |
| February 2020 | 0.75 | 0.63 | 0.72 | 0.73 | 0.68 | 0.8 | 0.88 | 0.87 |
| March 2020 | 0.8 | 0.7 | 0.8 | 0.77 | 0.78 | 0.83 | 0.87 | 0.85 |
Morphology and Chemical Composition of Particles
Figure 3 shows the SEM image of indoor/outdoor particles collected in the study area. The results of SEM analysis of the samples showed that most of the particles are irregular, fibrous and spherical in shape as well as crystalline shapes. Most of the elements in the samples taken in this area include Chlorine (Cl), Calcium (Ca), Iron (Fe), and Potassium (K), which are found in combination with Zinc (Zn). In the samples of these areas, crystalline, spherical and amorphous shapes are seen in particles with diameter less than 2 µm with compounds rich in Oxygen (O), Fe, Silicon (Si) and Titanium (Ti) along with Magnesium (Mg) and Aluminum (Al). The Si ratio of these compounds with Sodium (Na) and Al indicates feldspar and clay mineral compounds (Shao et al. 2007). These results were similar to the findings of the research of Bhardwaj et al. (2017) in urban and rural areas of Delhi, India; Kushwaha et al. (2013) in the Allahabad region of India. PM with a diameter of 0.4 microns had irregular, spherical, rod and crystalline shapes. These particles are observed in the samples collected in the wet season. These samples contain compounds rich in Ca, and Zn along with Al, Ti and O. This result indicates the origin of construction and urban transportation (Tiwari et al. 2014; Tiwari et al. 2015). The results of SEM analysis showed that the chemical composition of the indoor particles was similar to the outdoor particles. In some cases, there was a difference in the chemical composition of the indoor particles. This difference was related to the origin of the indoor particles produced (such as cooking and cigarette smoke).
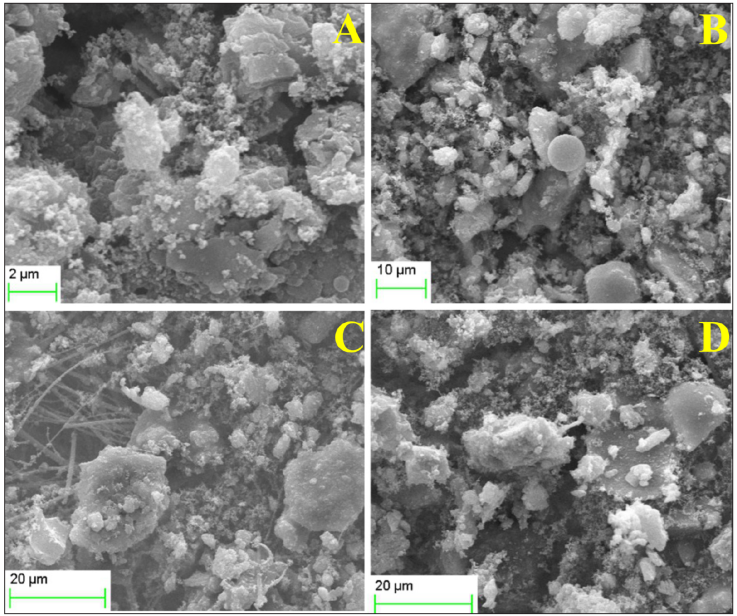
Figure 2 Image of PM collected by SEM method in the study area (A and B outdoor particles, C and D indoor particles).
The results of SEM analysis of the samples taken from the Southern areas in the study area show that most of the particles are spherical and fibrous. Most of the elements in the samples taken in this area include Ca, Fe and K, which are found in combination with Ti. Amorphous structures rich in Si and Fe, Mg and Na, were observed in PM smaller than 2.5 µm. In the samples of these areas, spherical and amorphous particles are seen in particles with a diameter greater than 0.4 micrometers with compounds rich in K, Mg, Zn and Ti along with Si and Al. The ratio of Al and Na of these compounds with Si indicates feldspar and clay mineral compounds (Shao et al. 2007). PM with irregular, rod-shaped and crystalline shapes was characteristic of particles smaller than 0.4 µm collected from the characteristics of samples taken in the dry season. The size of the collected particles also varied and ranged from nanometers to several tens of micrometers. Smaller particles accumulate in the atmosphere due to collisions with other particles, forming larger particles (Papastefanou 2008). As the particle dimensions grow, their deposition and removal conditions are provided (Schiavo et al. 2022). Particles with irregular and amorphous shapes are of internal origin and these particles mainly include particles produced from mobile sources (Transportation), industry and fossil fuel consumption. After suspension in the atmosphere, these particles collide with surfaces form larger dimensions and precipitate cumulatively (Geng et al. 2011; Zhai et al. 2012). While particles with regular and mostly spherical shapes are of organic origin and are caused by biomass burning in the environment (Campos-Ramos et al. 2009; Geng et al. 2011). According to the results of other studies, fine particles are emitted during fuel combustion processes by industry and urban transportation, and larger particles during human activities such as dust emitted on roads by vehicles, construction and Industries are produced and disseminated (Adachi and Tainosho 2004; Viana et al. 2006; Oroji et al. 2019).
The Factors Affecting Indoor Pollution
The monthly average contribution of the factors affecting the increase in the concentration of indoor particles showed in Table 4. These results showed that natural ventilation is the most important factor in increasing the concentration of indoor particles. During the year, the average share of natural ventilation in increasing the concentration of indoor particles was more than 39%. Also, the daily activities of people living in the building play a role in increasing the concentration of indoor particles by about 12%. On average, about 19% of the indoor particle was related to cooking. The life of the building was very different in different areas of Tehran. In some areas, the difference can be as long as 40 years. Studies have shown that this factor is 23% involved in the penetration of external particles into the building. This amount was higher for older buildings. Also, in most stations, the penetration of outdoor particles into the building in the cold season was more than in the hot season. Due to the use of natural ventilation in most residential buildings in the study area, the I/O ratio of PM2.5 and PM 0.4 was on average more than 0.752. At some stations in March, April and May the I/O ratio was over 0.965.
Table 4 Monthly average contribution of the factors affecting the increase in the concentration of indoor particle.
| Factors | |||||
|---|---|---|---|---|---|
| Date | Ventilation (%) | Cooking (%) | Activity (%) | Smoking (%) | Building age (%) |
| April 2021 | 45 | 15 | 12 | 8 | 20 |
| May 2021 | 57 | 12 | 10 | 5 | 16 |
| June 2021 | 36 | 25 | 10 | 7 | 22 |
| July 2021 | 29 | 27 | 12 | 7 | 25 |
| August 2020 | 31 | 17 | 17 | 8 | 27 |
| September 2020 | 30 | 23 | 15 | 6 | 26 |
| October 2020 | 32 | 21 | 14 | 5 | 28 |
| November 2020 | 35 | 17 | 13 | 10 | 25 |
| December 2020 | 32 | 22 | 12 | 9 | 25 |
| January 2020 | 37 | 20 | 15 | 11 | 17 |
| February 2020 | 42 | 18 | 16 | 10 | 14 |
| March 2020 | 54 | 15 | 10 | 6 | 15 |
Conclusions
The results showed that internal resources are related to human activities and the intended use of space. In living environments, an important role is played by smoking and cooking, followed by heating, cleaning, and suspension systems due to human presence. In hot months like August and September, most indoor particles are brought in from outside with naturally ventilated buildings. These results showed that mechanical ventilation can reduce exposure to outdoor particles in residential buildings. This crisis will be seen in the future with the development of common diseases among the persons. Prolonged exposure to atmospheric particles inside and outside the workplace and living environment can lead to respiratory and heart disease. Creating awareness and education among the people, renovating places, and using modern mechanical heating, cooling, and air conditioning systems can control the occurrence of health problems to some extent.

