


 text new page (beta)
 English (pdf)
 Article in xml format
 Article references
 Send this article by e-mail
 Cited by SciELO
  Similars in
SciELO
Similars in
SciELO 
 Permalink
INTRODUCTION
Focal segmental glomerulosclerosis (FSGS) is a histologic pattern of renal injury that initially affects the glomeruli (i.e., segmental scar, which involves some but not all glomeruli) and the tubulointerstitium1,2. The numerous causes of kidney injury in FSGS include gene mutations, circulating permeability factors, toxins, drugs, and infections3,4. The idiopathic type of FSGS is diagnosed after ruling out these mentioned causes; otherwise, it is diagnosed as secondary type2. Clinically, FSGS is often associated with nephrotic syndrome, which is characterized by proteinuria of > 1 g/m2/24 h, hypoalbuminemia, generalized edema, and hyperlipidemia5,6. The other clinical presentations of FSGS are hypertension, microscopic hematuria, renal failure, and serum creatinine increment7. The first-line treatment strategy for FSGS is oral corticosteroids, although it still seems to be far from satisfactory and remains a challenge for nephrologists7. The rate of spontaneous remission in this glomerular disease is <5%, whereas a complete or partial remission with steroid therapy occurs in 4060% of cases7,8. Other immunosuppressive drugs such as calcineurin inhibitors and cytotoxic agents (e.g., cyclophosphamide or chlorambucil) are also frequently used9,10.
The main problem in FSGS is that a population of patients who are unlikely to respond to steroids could not be predicted in advance, and hence, they are unnecessarily exposed to steroids and their potential side effects11. In addition, the alternative treatments that may be more effective are postponed in these steroid-resistant (SR), non-responder cases. Therefore, non-invasive predictive biomarkers are essential to make appropriate clinical decisions.
Urinary biomarkers have been a promising tool for non-invasive diagnosis of kidney diseases and to elucidate the mechanisms of molecular alterations that lead to renal pathology. Metabolomics is one of the powerful platforms for discovering novel non-invasive metabolite biomarkers and biochemical pathways aimed at improving diagnosis since it is concerned with the identification of small molecules (i.e., metabolites) that are influenced by tissue metabolism and function12-14.
We previously published our experience with urine protein biomarkers of responsiveness to steroid therapy in patients with FSGS15. We now present our novel experience in urine metabolite biomarkers as an alternative to urine protein biomarkers from our previous study to improve the diagnosis and understanding of disease pathways. In this pilot study, we enrolled patients diagnosed with primary FSGS and compared the urine metabolome of responder and non-responder patients to steroid therapy.
METHODS
Patient population and sample collection
Patients were enrolled from Labbafinejad Medical Center. Histopathologic diagnosis of primary FSGS was performed on biopsy samples. The patients who had active or recurrent urinary tract infection, secondary segmental glomerular sclerosis, systemic disease, or other diseases associated with glomerulopathy and drug abuse were excluded from the study. All patients signed a written consent that was confirmed by the Medical Ethics Committee of the Shahid Beheshti University of Medical Sciences, and their samples were coded to protect confidentiality. The patients were treated with prednisolone 1 mg/kg and followed up for 6-8 weeks. According to the policy of our center, the immunosuppressive therapy protocol was changed in patients who were not responsive to steroids in 6-8 weeks to avoid the side effects of high-dose steroids. Urine protein excretion in 24 h was measured and evaluated for the response to steroid therapy. Patients were categorized in the steroid-sensitive (SS) group if their proteinuria after treatment and follow-up was <200 mg/day (complete remission) or had a 50% reduction in proteinuria. Patients with increased or persistent proteinuria after treatment were referred to as SR group. Based on these criteria, we identified a total of 17 adult patients with primary FSGS, of whom 10 were SS and 7 were SR. Demographic and clinical data are shown in Table 1. Urine samples were collected on biopsy day and before the initiation of treatment, centrifuged at 3000 rcf for 20 min at 4°C to pellet the cell debris, aliquoted, and stored at −80°C.
Table 1 Demographic and clinical information of patients.
| SS | SR | p value | |
|---|---|---|---|
| Age (Y) | 41 ± 19 | 41 ± 10 | 0.89 |
| Men (%) | 7 (70) | 4 (57) | 0.22 |
| eGFR (ml/min/1.73 m2) | 58 (42-84) | 52 (39-70) | 0.32 |
| Proteinuria (mg/24 h) | 2650 (1460-1418) | 3649 (1817-4686) | 0.75 |
| BUN (mg/dl) | 21 ± 11.6 | 19.4 ± 3.7 | 0.73 |
| SCr (mg/dl) | 1.4 ± 0.6 | 1.6 ± 0.5 | 0.66 |
| Chol (mg/dL) | 208 ± 60 | 198 ± 20 | 0.69 |
| TG (mg/dL) | 153 (123-169) | 156 (109-404) | 0.31 |
| HDL (mg/dL) | 48 ± 10.5 | 40 ± 20 | 0.62 |
| LDL (mg/dL) | 123 ± 48 | 96 ± 28 | 0.36 |
Data presented as mean ± standard. Percentage of men in each group was presented in parenthesis. Data presented for eGFR, proteinuria, and TG as median and interquartiles (percentile 25 and 75), SS: steroid sensitive; SR: steroid resistant; eGFR: estimated glomerular filtration rate; BUN: blood urea nitrogen; SCr: serum creatinine; Chol: cholesterol; TG: triglyceride; HDL: high-density lipoprotein cholesterol; LDL: low-density lipoprotein cholesterol.
Estimated glomerular filtration rate was calculated from serum creatinine using chronic kidney disease (CKD-EPI) equation.
Metabolomics analysis
Preparation of urine samples for metabolomics analysis using 1H nuclear magnetic resonance (1HNMR) was performed according to Kalantari et al.16 In brief, 450 µl of urine thawed at room temperature was mixed with 60 µl of buffer containing 300 mM potassium phosphate buffer (KH2PO4), 20% deuterium oxide, and 0.2% of 3-(trimethylsilyl) propionic acid-d4 sodium salt at pH 7.4. Subsequently, 510 µl of the mixture of samples and buffer were transferred to separate 5 mm tubes and subjected to NMR spectroscopy.
One-dimensional 1H-NMR spectra were achieved by Bruker DRX spectrometer operating at a proton frequency of 500.13 MHz using CarrPurcellMeiboomGill (CPMG) spin echo pulse sequence to prevent the disturbance of high-molecular-weight molecules. The parameters for CPMG were as follows: a spin-spin relaxation delay of 2.5 s, spectral width 8389.26 Hz, a spectrum size of 32 K, number of scans 154, a 1.95 s acquisition time, time domain points 32 K, and a line broadening factor of 0.3 Hz.
Using PROMETAB software (version prometab_v3_3)17 and MATLAB (version 6.5.1, The Math Works, Cambridge, UK), phase correction, water region deletion, baseline correction, and other preprocessing, including binning into 0.02-ppm segments between 0.2 and 10.0 ppm, were performed. The significant bins after statistical analyses were then identified using databases (e.g., human metabolome database, HMDB, and Biological Magnetic Resonance Bank, BMRB) and literature search.
Statistical analysis
The univariate statistics was calculated using the MannWhitney U-test to estimate the significance of group differences. p < 0.05 was considered statistically significant.
Receiver operating characteristic (ROC) curves were performed for each candidate biomarker to evaluate further their prediction performance judging by sensitivity and specificity and area under the curve (AUC). A correlation analysis was further applied using SPSS (version 22) to display the relationships between these suggested biomarkers and clinical parameters (i.e., proteinuria and estimated glomerular filtration rate [eGFR]) and histological features (i.e., interstitial fibrosis/tubular atrophy [IFTA]).
Pathway analysis
The web-based Integrated Molecular Pathway-Level Analysis (IMPaLA) (http://impala.molgen.mpg.de) was applied for the pathway analysis of differential metabolites18. IMPaLA is a tool designed to perform enrichment and pathway analysis on both metabolomic and proteomic or transcriptomic datasets simultaneously19. It has the potential to perform overrepresentation or enrichment analysis of metabolites and genes using over 3000 pre-annotated pathways from 11 databases18. The result pathways are identified that may be dysregulated on the transcriptional level, the metabolic level, or both. After removing the redundant hits, pathways with adjusted p < 0.05 were considered statistically significant.
Bioinformatic analysis of common targets
Common targets in terms of proteins, cell processes and functional classes of statistically significant candidates, and prednisolone were identified using Pathway Studio® 11.0 (Ariadne Genomics, Rockville, MD, USA). Subsequently, DAVID tool20 was applied to determine most relevant pathways and biological processes corresponding with identified common targets. p < 0.05 was considered statistically significant in Pathway Studio and DAVID analyses.
RESULTS
Ten urine samples from SS and seven samples from SR FSGS patients were analyzed by 1H-NMR. For comparison, spectra were divided into buckets (spectral regions of 0.02 p.p.m. width), and a bucket table was created for every sample. A matrix of 408 variables (chemical shifts) was subjected to statistical analysis [Table S1]. According to U-test, four variables were significant that after identification corresponded with three metabolites including homovanillic acid, 4-methylcatechol, and tyrosine. After ROC analysis, three other metabolites were found with good AUC value that was also reasonably relevant to disease according to the literature and were considered important as potential biomarkers; however, they were not significant in the U-test. These predictive biomarkers were L-3,4-dihydroxyphenylalanine (L-DOPA), norepinephrine, and gentisic acid. Details of the fold changes between two groups, AUCs, sensitivity, and specificity of each candidate are shown in Table 2. The ROC curves of each candidate metabolite are summarized in figure 1.
Table 2 The predictive candidate metabolites and their diagnostic evaluation details.
| Metabolite Name | Chemical shift | HMDB ID | Fold change | Direction of changes | P value | Sensitivity (%) | Specificity (%) | AUC |
|---|---|---|---|---|---|---|---|---|
| SS/SR | ||||||||
| Homovanillic acid | 6.93, 6.87 | HMDB0000118 | 1.4 | ↓ | 0.038 | 71 | 90 | 0.81 |
| 4-methylcatechol | 6.67 | HMDB0000873 | 1.3 | ↓ | 0.043 | 71 | 100 | 0.8 |
| tyrosine | 6.89 | HMDB0000158 | 1.4 | ↓ | 0.043 | 71 | 90 | 0.8 |
| L-DOPA | 6.73,6.69 | HMDB0000181 | 1.3 | ↓ | 0.05 | 71 | 100 | 0.81 |
| Norepinephrine | 6.95 | HMDB0000216 | 1.4 | ↓ | 0.05 | 71 | 80 | 0.78 |
| Gentisic acid | 6.99 | HMDB0000152 | 1.2 | ↓ | 0.05 | 71 | 90 | 0.78 |
*Significant p-value by U-test. SS: steroid sensitive; SR: steroid resistant.
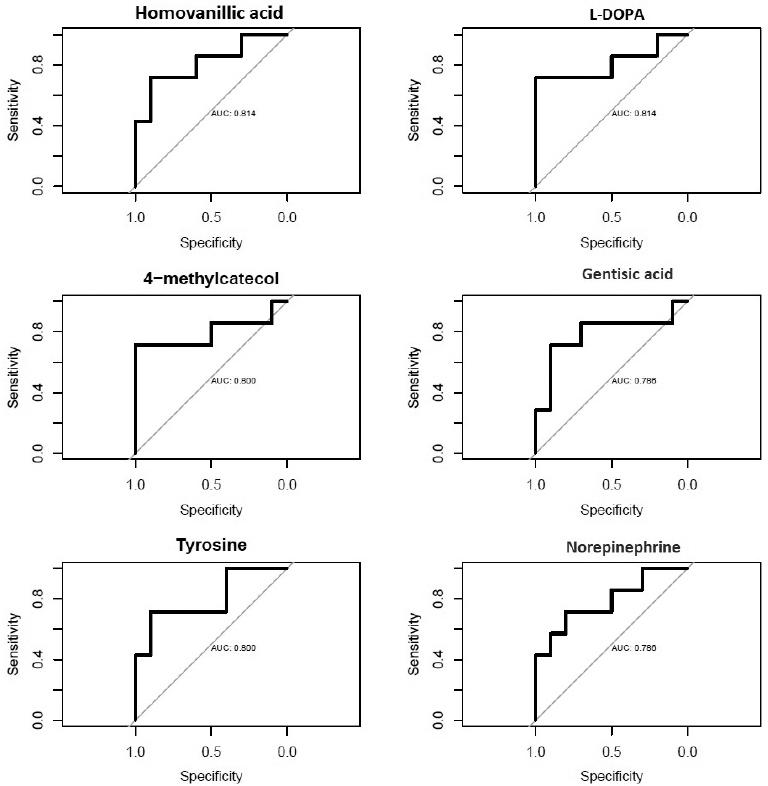
Figure 1 Receiver operating characteristic curves of suggested candidates for prediction of responsiveness to steroid therapy.
Correlation analysis of candidates with clinical and histopathologic features showed that homovanillic acid and tyrosine are the most important metabolites in the pathogenesis of responsiveness as they have strong correlation with proteinuria, eGFR, and IFTA in the non-responder group. Details of the correlation analysis are shown in table 3.
Table 3 Correlation analysis of candidate biomarkers with clinical (i.e., proteinuria and eGFR) and pathological (i.e., IFTA) features.
| SS | SR | |||||
|---|---|---|---|---|---|---|
| Proteinuria | eGFR | IFTA | Proteinuria | eGFR | IFTA | |
| Homovanillic acid | 0.18 | −0.006 | 0.49* | 0.8* | −0.4* | 0.49 |
| 4-methylcatechol | 0.1 | −0.04 | 0.34 | −0.2 | −0.1 | 0.35 |
| Tyrosine | 0.32 | −0.1 | 0.44* | 0.8* | −0.4* | 0.49 |
| L-DOPA | 0.03 | −0.05 | 0.25 | −0.2 | −0.1 | 0.44* |
| Norepinephrine | 0.15 | 0.28 | 0.59* | 0.4* | −0.3 | 0.55* |
| Gentisic acid | 0.03 | −0.006 | 0.46* | 0.4* | −0.3 | 0.5* |
SS: steroid sensitive, SR: steroid resistant; eGFR: estimated glomerular filtration rate; IFTA: interstitial fibrosis/tubular atrophy.
Pathway analysis indicated that 16 pathways were impaired in non-responder patients, of which tyrosine metabolism is the most significant. Five of six candidate metabolites enriched in tyrosine metabolism. The other top significant pathways that are involved in the pathogenesis of resistance to steroid therapy were as follows: dopaminergic synapse, disulfiram action pathway, catecholamine biosynthesis, and biogenic amine synthesis. Table 4 shows the significance level and the encompassing metabolites for each pathway.
Table 4 List of significant pathways that are different between steroid-sensitive and steroid-resistant (SR) patients.
| Pathway name | Pathway source | Overlapping metabolites | P metabolites | Q metabolites |
|---|---|---|---|---|
| Tyrosine metabolism | KEGG | Norepinephrine; homovanillic acid; L-DOPA; tyrosine; gentisic acid | 5.85E-10 | 2.33E-06 |
| Dopaminergic synapse | KEGG | Homovanillic acid; L-DOPA; tyrosine | 8.65E-08 | 4.47E-05 |
| Disulfiram action pathway | SMPDE | Norepinephrine; homovanillic acid; L-DOPA; tyrosine | 1.9SE-07 | 7.17E-05 |
| Catecholamine biosynthesis | HumanCyc | Norepinephrine; L-DOPA; tyrosine | 2.20E-07 | 7.31E-05 |
| Biogenic amine synthesis | WikiPathways | Norepinephrine; L-DOPA; tyrosine | 2.57E-07 | 7.51E-Q5 |
| Dopamine metabolism | WikiPathways | Homovanillic acid; L-DOPA; tyrosine | 1.94E-06 | 0.000407 |
| Amine-derived hormones | Reactome | Norepinephrine; L-DOPA; tyrosine | 3.29E-06 | 0.000625 |
| Amine ligand-binding receptors | Reactome | Norepinephrine; L-DOPA | 1.96E-05 | 0.00313 |
| L-dopachrome biosynthesis | HumanCyc | L-DOPA; tyrosine | 1.96E-05 | 0.00313 |
| Nicotine activity on dopaminergic neurons | WikiPathways | L-DOPA; tyrosine | 2.52E-05 | 0.00386 |
| Prolactin signaling pathway | KEGG | L-DOPA; tyrosine | 3.85E-05 | 0.00529 |
| L-dopa degradation | HumanCyc | Homovanillic acid; L-DOPA | 4.61E-05 | 0.00613 |
| (S)-Reticuline biosynthesis | HumanCyc | L-DOPA; tyrosine | 8.37E-05 | 0.0101 |
| Melanin biosynthesis | WikiPathways | L-DOPA; tyrosine | 0.000161 | 0.0189 |
| Na±CI-dependent neurotransmitter transporters | Reactome | Norepinephrine; tyrosine | 0.000323 | 0.0357 |
| Amine compound SLC transporters | Reactome | Norepinephrine; tyrosine | 0.000412 | 0.0444 |
P metabolites represent unadjusted p-value and Q metabolites represent p value after adjustment (i.e., false discovery rate).
A bioinformatics analysis was performed for the identification of the common targets of our most important candidates with the significant p-value (i.e., homovanillic acid, tyrosine, and 4-methylcatechol) in the statistical test and of prednisolone to understand better the pathophysiology of drug resistance using Pathway Studio platform. The results indicated that 4-methylcatechol and prednisolone have 12 target proteins in common (Fig. 2). Further, analysis of these common target proteins by David tool revealed that five targets are involved in the apoptosis pathway (p = 2.2 × 10⁻⁵), including BCL2, BCL2 associated X (BAX), caspase 3, nerve growth factor (NGF), and tumor necrosis factor (TNF). The most significant biological process was response to glucocorticoid (p = 6.9 × 10⁻⁴) that was quite relevant to our study concept, and the encompassing proteins were BCL2, CASP3, TNF, and prostaglandin-endoperoxide synthase 2.
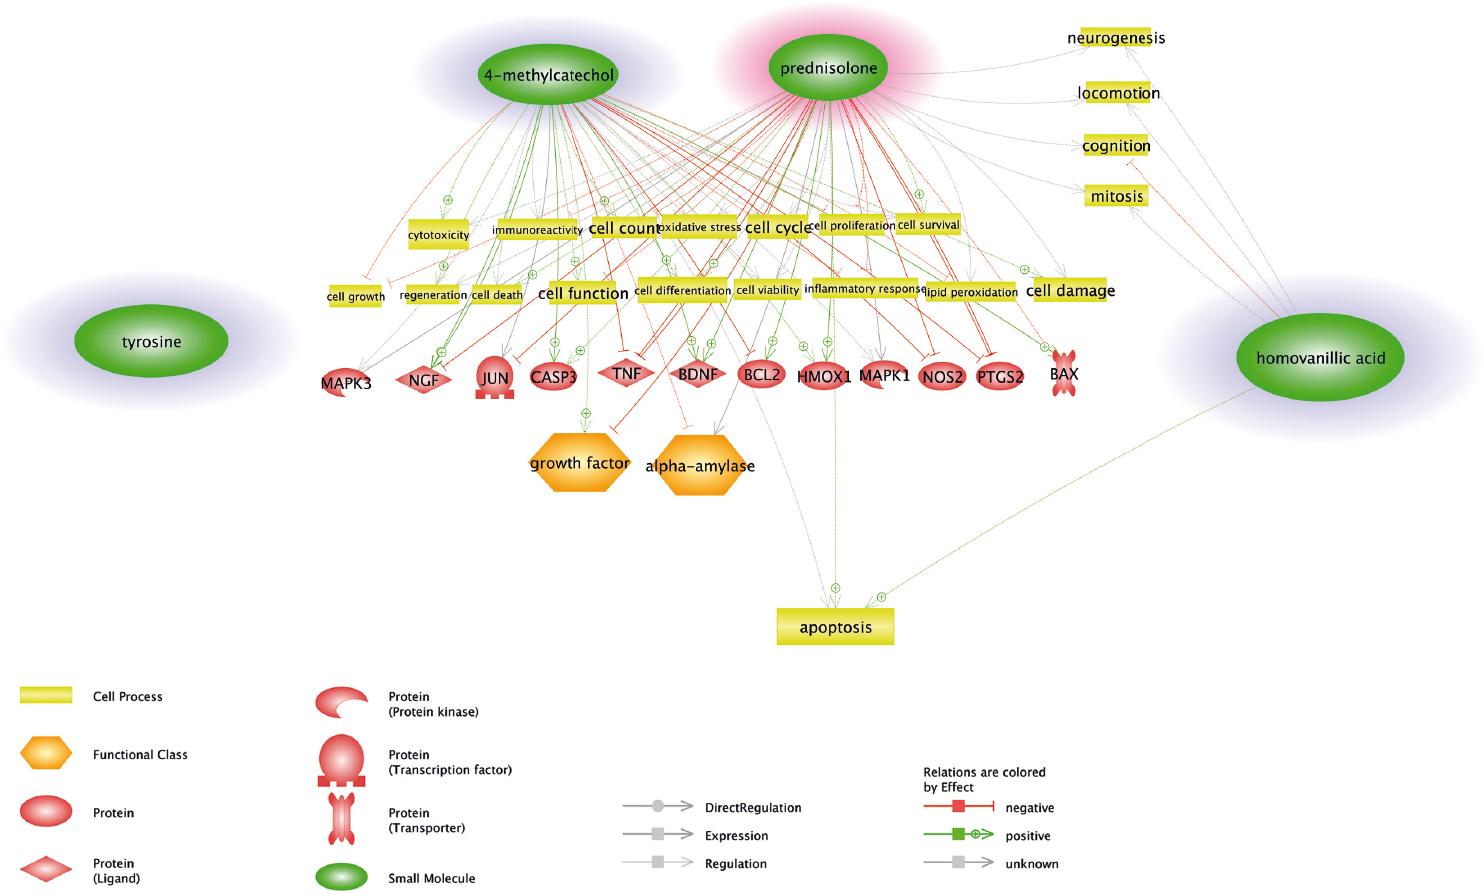
Figure 2 A schematic figure of common targets for candidate biomarkers and prednisolone. Tyrosine and prednisolone did not have any common targets while 4-methylcatechol and prednisolone had many including proteins involved in the apoptosis process and other important signaling. Apoptosis is the common process between two biomarkers (4-methylcatechol and homovanillic acid) and prednisolone and, therefore, is the most important issue to be focused on for future experiments.
DISCUSSION
In the present study, the urine metabolome was investigated in FSGS patients before commencing steroid therapy and analyzed for candidate biomarkers for the prediction of steroid responsiveness after at least 6-8 weeks of follow-up. This is the first metabolomics study on urine samples for the purpose of biomarker discovery with respect to steroid responsiveness in FSGS patients.
A urine metabolite signature comprising three metabolites was found. The three metabolites which were differentially present in two groups of patients included homovanillic acid, 4-methylcatechol, and tyrosine. In addition to these candidates, L-DOPA, norepinephrine, and gentisic acid were suggested as other important molecules that are involved in the pathogenesis of steroid resistance based on AUC and accuracy of group differentiation. All the suggested candidates were underrepresented in the urine of steroid-resistant patients. All metabolites, except the 4-methylcatechol, contribute in tyrosine metabolism, and hence, this pathway is suggested as the most important defective molecular pathway in the steroid-resistant mechanism.
Since homovanillic acid and tyrosine significantly correlated with an increase in proteinuria, decline in eGFR, and increase IFTA score in the steroid-resistant patients, it is postulated that they might be more important than other suggested candidates and are better targets for further analyses in the larger population.
Homovanillic acid is produced by metabolism of dopamine through two pathways21. Monoaminoxidase, aldehyde dehydrogenase, and catechol-O-methyltransferase are the contributory enzymes in the production of homovanillic acid22,23. A decreased excretion of homovanillic acid in the urine of CKD patients with diabetes in comparison with normal controls was detected in a study by Sharma et al.24, while an increased plasma level of this metabolite was detected by Rhee et al.25 in comparison to end-stage renal disease (ESRD) patients and at-risk controls. The result of these two studies is in line, as the increased plasma level of homovanillic acid in ESRD patients might be due to inability of the kidney to excrete this metabolite similar to diabetic CKD patients who have reduced urinary level of homovanillic acid. Accordingly, a decreased urinary level of this metabolite in our subjects (i.e., steroid-resistant FSGS patients) indicates the higher risk of chronicity and worse prognosis in these patients.
There is evidence of decreased excretion of the tyrosine from the kidney in patients with advanced renal failure, reduction of norepinephrine clearance in mild renal failure and patients on hemodialysis, and impairment of the dopaminergic system in experimental model and human subjects with diabetic kidney injury25-27. According to these findings, dysregulation of tyrosine and dopaminergic metabolites is involved in the pathogenesis of progression of renal injury. In the present study, it is suggested that perturbation of these metabolites and their corresponding pathways results in renal failure irrespective of its etiology, and therefore, these metabolic dysregulations can occur in FSGS, but this impairment is more severe in steroid-resistant FSGS patients. Interestingly, Park et al. found tyrosine metabolism as a significant pathway relating to steroid resistance in asthmatic children28, which confirms that this pathway could be a target pathway of action for steroid drugs. Hence, further studies are suggested on regulation of the catalytic enzymes related to this pathway, especially tyrosine hydroxylase (related to conversion of tyrosine to L-DOPA), DOPA decarboxylase (related to conversion of L-DOPA to dopamine), and dopamine beta-hydroxylase (related to conversion of dopamine to norepinephrine), which are related to our detected metabolites.
Since podocytes express dopamine receptors29 and dopamine is one of the intermediates in the tyrosine metabolism pathway, even though it was not detected directly in our analysis, and owing to this fact that podocyte injury occurs in FSGS30, one can speculate that podocytes in steroid-resistant patients are the target of a destructive effect of dysregulation in tyrosine metabolism and the dopaminergic system.
Taken together, as mentioned above, there are relationships between these metabolite candidates and reduced renal function according to the literature, although eGFR value was not statistically significant in our two study groups. To resolve this concern, validation of these candidate metabolites in an independent large population is needed.
Bioinformatic analysis on the common targets for three statistically significant candidates and prednisolone elucidated the most important target proteins that are under the influence of drug and candidates simultaneously, and the important pathway whose regulation could reduce the steroid resistance. The most common linkage was found between 4-methylcatechol and prednisolone, including 16 cell processes, two functional classes, and 12 target proteins, while homovanillic acid and prednisolone had five common cell processes with no common protein targets. Common targets between tyrosine and prednisolone were not found by our Pathway Studio analysis. These results (Fig. 2), in addition to supplementary analysis on 12 target proteins by DAVID tool, showed that apoptosis is the most important target pathway in the pathogenesis of response to steroid in FSGS patients. It is known that steroids action on apoptosis is tissue specific, that could be either pro- or anti-apoptotic depending on the cell types31,32. Accordingly, steroid drugs have a protective effect in the kidney31 versus apoptosis induction in the immune cells including T-cells33 and monocytes/macrophages34. The protective mechanism of steroids in the kidney is through a decrease in p53, increase in Bcl-xL, and inhibition of apoptosis-inducing factor translocation31,35. Suppression of T-cells by steroid drugs will inhibit cytokines production such as IL-2, IFN-γ, and TNF-α36. Therefore, based on these data, it is suggested that apoptosis of T-cells in FSGS, that is, known as a T-cell driven disease37 might be impaired in steroid-resistant patients. On the other hand, loss of its protective effect in the kidney is another hypothesis that may cause resistance or even aggravate the disease. These hypotheses could be examined in future experiments by evaluating our suggested targets (e.g., TNF, BCL2, BAX, CASP3, and NGF) on the genes or protein level in the kidney tissue and T-cells derived from steroid-resistant and steroid-sensitive FSGS patients.
In summary, in the present study a non-invasive panel of biomarker candidates was introduced by which prediction of responsiveness to steroid drugs in FSGS patients was possible. Therefore, the harmful effect of high-dose steroids will be prevented in patients who are not likely to benefit from their use, and outcome, care, and management of this progressive and devastating disease will be improved. This biomarker panel must now be subjected to a larger, multicenter study for validation to prepare its use in clinical practice. On the other hand, the pathogenic pathways that were suggested for steroid resistance could be the target for regulation or sensitization before treatment with steroid drugs in future studies.

