


Services on Demand
Journal
Article
 text in
  English (pdf)
 Article in xml format
 Article references
 Send this article by e-mail
Indicators
-
 Cited by SciELO
 -
 Access statistics
Related links
-
 Similars in
SciELO
Similars in
SciELO
Share

 Permalink
Problemas del desarrollo
Print version ISSN 0301-7036
Prob. Des vol.54 n.215 Ciudad de México Oct./Dec. 2023 Epub Mar 18, 2024
https://doi.org/10.22201/iiec.20078951e.2023.215.70052
Articles
Unpaid domestic work: consumption and investment in the human capital of Mexican families
*Universidad Autónoma Metropolitana-Unidad Azcapotzalco, México. Correos electrónicos: oecm@azc.uam.mx y caaduquega@unal.edu.co, respectively.
This article studies the behavior of the magnitude of unpaid domestic work (TDNR) alongside family income, distinguishing between the production of consumer goods and investment. The theoretical proposal predicts that as monetary income increases, the time devoted to investment in human capital increases to the detriment of domestic consumer production. Data from the ENUT-2019 (INEGI, 2023) and a two-stage semiparametric model were used to estimate the TDNR hours devoted to investment and consumption over income distribution. The results support the theoretical hypothesis and are relevant evidence for public policy decision-making concerning poverty, social mobility and welfare issues.
Key Words: income; unpaid work; investment; human capital; consumption
El presente artículo estudia el comportamiento de la magnitud de trabajo doméstico no remunerado (TDNR) a lo largo del ingreso familiar, distinguiendo entre producción de bienes de consumo e inversión. La propuesta teórica predice que conforme incrementa el ingreso monetario, el tiempo dedicado a la inversión en capital humano aumenta en detrimento de la producción doméstica de consumo. Se usaron datos de la ENUT-2019 (INEGI, 2023) y un modelo semiparamétrico en dos etapas para estimar las horas de TDNR dedicadas a la inversión y al consumo sobre la distribución de ingresos. Los resultados apoyan la hipótesis teórica y son evidencia relevante para la toma de decisiones sobre la política pública en relación con la pobreza, la movilidad social y temas del bienestar.
Palabras clave: ingresos; trabajo no remunerado; inversión; capital humano; consumo
Clasificación JEL: D13; J24; C52
1. Introduction
The study of unpaid domestic work (TDNR) as a strand in economic science and development studies is increasingly relevant, both in contemporary scientific research and in public policy debates. The identification of the role of unpaid domestic production in national economies has generated a growing body of literature focused on its measurement and valuation (Addati et al., 2018; Giannelli et al., 2012; Mahmoud and Gadallah, 2011; Miranda, 2011). Different studies find that TDNR represents a significant share of total work and social production in all countries.
Some analyses focus on determining factors of the time spent by individuals on TDNR (Amarante and Rossel, 2018; Bloemen et al., 2010; Bloemen and Stancanelli, 2014; Duque-García, 2015; Hersch and Stratton, 1997; Kalenkoski et al., 2005). Broadly speaking, said studies agree that household structure (number of adults, children, elderly, etc.) and individual characteristics (age, gender, educational level, marital status, etc.) influence the time individuals devote to domestic production. Given that these studies also find a clear gender gap in the allocation of household chores, several articles address the effects of TDNR on the gender wage gap (Herrera et al., 2019; Qi and Dong, 2016).
In Mexico, TDNR has an estimated value of around 20% of GDP, being one of the nations with the highest TDNR per capita among the countries belonging to the Organization for Economic Cooperation and Development (OECD) (García, 2019; OECD, 2020). In terms of distribution, it is also estimated that Mexican women devote around 70% of their time to unpaid domestic production, while it is less than 30% for men (Llanes and Pacheco, 2021). A genuine argument for Mexico and the rest of the countries in the region is that the magnitude and distribution of this unpaid production varies as family income rises.
It should be considered that some of these variations in wealth are easier to explain when it is recognized that TDNR is composed of the production of a set of diverse goods and that it should not be seen as an aggregate linked exclusively to household consumption. Unfortunately, regardless of whether the analytical focus has been on the valuation, determining factors or their implications, from an economic point of view, most existing empirical literature on TDNR implicitly assumes that domestically produced goods and services are only consumer goods.
In recent times, some exceptions have been found in less traditional literature, such as the exception related to "care work", which, from a feminist point of view of the political economy, addresses the issue of TDNR with an interdisciplinary heterodox perspective (Carrasco, 2013; Carrasco et al., 2011). In fact, the care category is still part of an academic and political agenda under construction (Espino and Salvador, 2014). In this respect, Esquivel (2012) recalls:
[...] "care" is an interpersonal relationship, work and cost, a social practice and political tool, a production subsidy, conflict, ethics, law and responsibility. These close but not necessarily interchangeable definitions imply different disciplinary perspectives, theoretical traditions, and analytical levels (p. 141).
Within this framework, there is one exception: the theoretical proposals of Folbre (2012 and 2014), in which the TDNR, in addition to producing household consumer goods and services, can also be used in the formation or investment of human capital as in the case of educational support for children at home.
This paper offers a reformulation and extension of Folbre's (2014) model to predict the behavior of unpaid household production of human capital and consumption throughout the distribution of household income.
The theoretical proposal predicts that as income increases, the TDNR allocated to investment in human capital increases while the time allocated to consumer goods tends to decrease. We used data from the Mexican National Time Use Survey (ENUT) 2019 (INEGI, 2023) to provide empirical evidence regarding the model's predictions. We estimated regressions of Mexican households' unpaid household production on their sociodemographic characteristics and non-parametrically observed the model's predictions throughout the income distribution.
Studying the differentiated patterns or heterogeneity of TDNR, when it becomes possible to categorize it into consumption and investment activities, contributes to understanding the role of unpaid household production on relevant economic problems such as the poverty traps faced by developing countries. Understanding how families, according to their socioeconomic conditions, can trade usage of consumption time for investment in order to be able to enter a virtuous circle is relevant for public policy decisions related to social problems such as poverty, inequality and social mobility.
The rest of the article is distributed as follows: the second section presents a brief review of the literature on TDNR in Mexico and the human capital approach relevant to this paper. Section three presents the theoretical model, its adaptation and its extension. The fourth section presents the empirical validation of the model; it describes the data set and the econometric methods used and reports the results. The fifth and last section presents the implications and conclusions of the study.
2. Review of the literature
The first ENUT applied in Mexico was carried out in 1996 and was designed by the National Institute of Statistics and Geography (INEGI) (García, 2019). It was reapplied in 1998, 2002, 2009, 2014 and 2019. Based on this information, INEGI constructed a satellite account of unpaid work in households that has estimated, among other variables, the total number of hours dedicated to TDNR, its distribution by gender, as well as the imputed economic value for the period 2003-2018 (INEGI, 2022).
The value of TDNR in Mexico between 2003 and 2018 has been estimated with values that increased from 19.6 to 29.2% of GDP,1 while Mexican women account for between 77 and 83% of this unpaid production (INEGI, 2022). Several studies on TDNR in Mexico have been conducted based on ENUT data (Garcia, 2017 and 2019; Garcia and Pacheco, 2015; Martinez and Rojas, 2016; Santoyo and Pacheco, 2014). Using Tobit regressions, Amarante and Rossel (2018) found that the time people spend on TDNR in Mexico decreases if the person is male, employed and single. However, it increases with age and children under 12 years old in the household.
Amarante and Rossel (2018) also point out similar behaviors in Colombia, Peru and Uruguay, providing evidence of a clear gender gap in the distribution of TDNR. On the other hand, Campaña et al. (2020) found that Mexican women (and women from other Latin American countries) tend to dedicate more time to TDNR when they are self-employed than when they are salaried. In the first case, they have fewer paid hours than in the second.
As already mentioned in the introduction, a common feature in all these studies is the implicit assumption solely focused on producing consumer goods and services. The theoretical basis for such an approach can be traced back to Becker's (1965) seminal paper on TDNR, where he suggests an aggregate household utility function, U, which would depend (positively) on goods purchased in the household, xi, and on TDNR time, Ti:
On the other hand, the literature on human capital only tends to consider formal education, training and experience as factors that improve people's physical and mental skills and, therefore, increase their real income prospects (Becker, 1962 and 1985). From this perspective, TDNR would play no role in human capital accumulation. Moreover, according to Becker (1985), given a stock of human capital, if a person increases their daily TDNR, their labor effort and productivity will decrease and, with it, their wages.
In contrast to the traditional position on human capital, Folbre (2012) offers an alternative definition of this variable. For the author, human capital can be broadly defined as an endowment or accumulation of productivity-enhancing skills that can produce a future rate of return in the labor market, in other markets or even in different domains of life, including, for example, better health or more successful children (Folbre, 2012). Based on this approach, human capital can be interpreted as a subset of human capabilities, which include operations that may have intrinsic value but do not necessarily offer a future monetary return.
The theoretical conception of human capital proposed by Folbre (2012) extends the conventional definition to find points of support in the theory of human capabilities developed by Sen (2001) and Nussbaum (2001 and 2011). Thus, human capital is a subset of human capabilities co-produced by several institutions: households, the State and the market. While the traditional literature on human capital tends to focus on the role of markets and the State, Folbre (2012 and 2014) takes care to highlight the role of TDNR in the production of human capital.
Thus, the theoretical framework of this article considers the time devoted to childcare or the development of adult capabilities as investments in human capital, as Folbre (2014) suggested. Consequently, households are not only units of consumption but also units of production and investment (in human capital). Below, we present a theoretical model that allows us to predict the distribution of TDNR between consumption and investment within households as they face changes in monetary income.
3. A theoretical proposal
This exercise is based on the model Folbre (2014)) suggested with some contrasts. The first focuses on domestic work time at the household level, not the individual level. For Folbre, the role of individuals and the distribution of TDNR is especially relevant. However, the objective here is not to explain the distribution of TDNR among household members but to group TDNR into consumption and human capital investment activities. Based on this, we can explain the relationship of these two groups of time use with changes in household monetary income. For this purpose, observing the family as a whole and not the individual is sufficient.
A second element of the proposal is that, in order to make a functional presentation, the category of extended income was introduced to account for total household income in monetary units, assuming that the economic value of the TDNR is assigned. The extended or expanded income makes it possible to link remunerated and non-remunerated household activities through the sum of the value of the TDNR and monetary income. The last relevant aspect of this exercise was to explicitly consider the form of a function of household consumption and investment in order to examine its implications on the use of time devoted to TDNR.
The presentation of the model is divided into two subsections. First, the participation of the TDNR in the construction of the household's extended income is explained. Expenditure is introduced as an equivalence of such income and utilizing a Keynesian propensity function, an explanation is provided of how it is divided into consumption and investment. Thus, the TDNR is also divided into consumption and investment, which are related to levels of monetary income. The second subsection presents a comparative statics analysis, showing the impact of changes in the household wage rate (money income) on the different types of TDNR.
TDNR, extended income and consumer function
Based on the Folbre (2014) model, we consider household i facing the following time constraint:
Where Ti is the total time available in household i; Mi is the total time spent on paid work by household members; Hi is the total time spent on unpaid household chores; and Si is the total time spent on self-care activities (such as sleeping or personal hygiene) and leisure (recreation, socializing, etc.).
Moreover, if
Figure 1 is a graphical representation of equation 3, which allows us to interpret the relationship between unpaid domestic production and extended household income. The intercept of the function corresponds to the income from paid work; in the figure, it is possible to observe that given the gradient of the function (shadow wage of unpaid housework
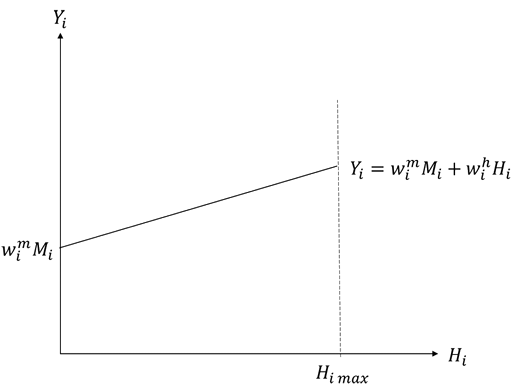
Source: Compiled by the authors based on equation (3).
Figure 1 Relationship between TDNR and extended household income
Continuing with Folbre's (2014) proposal, it is possible to consider that total expenditure Ei by household i is equivalent to its extended income Yi which is divided into consumption Ci and investment in human capital Ii as in equations (5) and (6):
It is important to note that extended income is composed of money and TDNR hours, so household spending (consumption and investment) is also composed of money and TDNR time.
To model the consumption behavior of household i in this proposal, a standard Keynesian linear consumption function is assumed as follows:
Where C0 is autonomous consumption, which in this model can be interpreted as a minimum subsistence level and c is the marginal propensity to consume over extended income. On the other hand, from (5), (6) and (7), we obtain household investment in human capital, which is an increasing function of income:
An essential difference with the traditional Keynesian consumption (and investment) function is that, in this case, the marginal propensity to consume depends, among other variables, on the structure of each household i. Thus, while households with small children have a social need to invest in their human capital, this need does not exist in households without small children, this need does not exist. Consequently, in the first type of household, the marginal propensity to consume will be lower than in the second type.
As an analytical strategy, Figure 2 integrates the elements of the model into two quadrants linked by extended income. The top quadrant represents equations (5), (6), (7) and (8), which connect the levels of expenditure (Ei) on consumption (Ci) and investment (Ii), with each level of extended income (Y) of household i. The bottom quadrant is figure 1 inverted; in other words, it represents the relationship between unpaid work and extended income of equation (3).
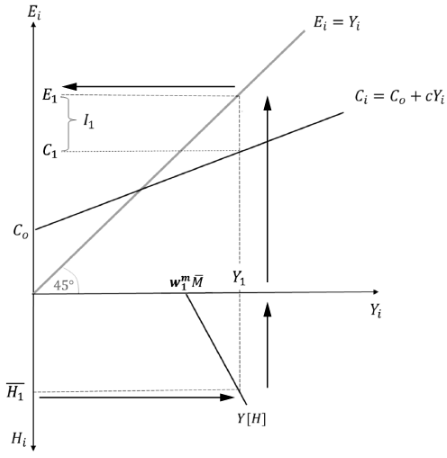
Source: Compiled by the authors based on equations (3), (5) and (7).
Figure 2 Extended Household Income and Expenditure Model with TDNR
The bold arrows indicate the direction of causality in Figure 2. Starting from the lower quadrant, the figure suggests that, given a level of monetary income
Figure 2 also shows that if the household does not spend time on unpaid household chores ( H1 = 0), income will only be
TDNR and monetary income: comparative statics
The model also allows us to explain the allocation of hours of unpaid domestic work to the production of consumer goods or services (Hc), such as food preparation, cleaning, laundry, or the hours dedicated to investment in human capital (H1); for example, educational support for children in the household. To illustrate the above, it is assumed that the proportion of TDNR hours devoted to investment in human capital is equal to the proportion of extended income (Yi ) that is invested (Ii):
From equation (8), we obtain:
Then, substituting (10) in (9), we obtain:
Furthermore, by dividing equation (7) by Yi, we obtain the proportion of unpaid household chores devoted to consumption:
In Figure 3, the distribution of TDNR between consumption and investment is incorporated into the model. Now, the new quadrant at the top of the left-hand side indicates the direct relationship between the share of investment Ii / Yi and expenditure (or extended income) as in equation (10). On the other hand, the new lower left quadrant represents equation (9).
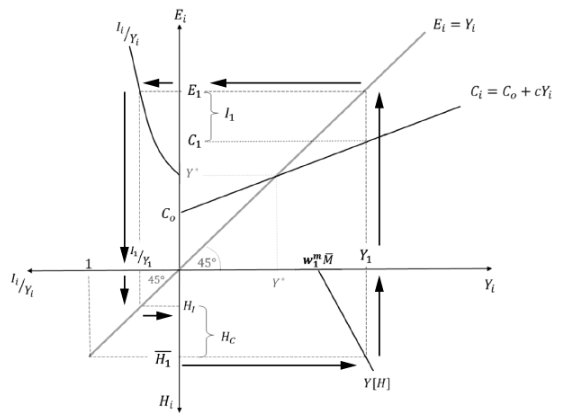
Source: Compiled by the authors based on equations (3) to (12).
Figure 3 Effects of an increase in monetary wages
Once again, the bold arrows indicate the direction of causality. As in Figure 2, given the total amount of unpaid household activities
Considering equation (11) and Figure 3, it can be seen that the proportion of unpaid household chores dedicated to investment tends to increase with extended income, which, in turn, increases with monetary income (see equation 3). In contrast, the proportion of unpaid household chores dedicated to consumption tends to decrease with increasing income. 2
In this model, the absolute magnitude of unpaid household chores devoted to investment activities can also be determined. Substituting (3) in (11) and solving for HI we obtain:
Furthermore, by substituting (3) into (12) and solving for Hc, we can determine the absolute magnitude of unpaid household chores devoted to consumption activities:
Equation (13) indicates that the magnitude of unpaid household chores dedicated to investment activities tends to increase with household monetary income. In contrast, equation (14) indicates that the magnitude of unpaid household chores dedicated to consumption activities tends to decrease with household monetary income.
The division of expenditure between consumption and investment that results from the Keynesian function implies that as monetary income increases, there is a relative decrease in unpaid household activities related to consumption, while those related to investment in human capital increase. Therefore, a higher wage increases extended income and will allow the household to invest more in human capital at the expense of a relative reduction in the TDNR dedicated to consumption.
Figure 4 is a representation that generalizes the domestic production of consumer goods and investment in human capital and is the result of the model proposed in Figure 3. Given

4. Empirical validation
Using data on the time use of Mexican households with children from the ENUT-2019, we estimate semiparametric models of unpaid household production on household income as an empirical revision of the proposed theoretical extensions. In particular, we estimate a two-stage partial-linear model that controls human capital and household demographic structure, then non-parametrically estimates TDNR hours devoted to consumption and investment in human capital over income quantiles. This section begins with a brief description of the available data set, continues with the presentation of the methodological strategy and closes with a discussion of the estimates.
Data and descriptive statistics
In this empirical validation exercise, the variable of hours dedicated to the educational support of children in the household is used as a proxy for investment in human capital. 3 Therefore, 12,246 households with children between 0 and 14 years of age were selected, corresponding to the total number of families with these characteristics out of the 27,214 households surveyed by the ENUT-2019 (INEGI, 2023). Table 1 presents the set of descriptive characteristics of the sample in relation to the relevant variables for the analysis of the behavior of the TDNR by income quintiles and the national average.
Table 1 Weekly hours of TDNR by income quintiles
| Quintiles | National overage | |||||
|---|---|---|---|---|---|---|
| I | II | III | IV | V | ||
| Total hours of unpaid domestic production | 99.26 | 96.39 | 94.25 | 93.23 | 86.77 | 94.13 |
| Investment | ||||||
| Houors of educational support | 6.87 | 6.67 | 6.90 | 6.58 | 6.99 | 6.80 |
| Consuption | ||||||
| Food preparation hours | 31.97 | 28.22 | 27.36 | 25.49 | 22.85 | 27.30 |
| Laundry hours | 11.07 | 10.82 | 10.41 | 10.60 | 9.08 | 10.42 |
| Household chores hours | 19.68 | 20.15 | 20.26 | 20.94 | 20.79 | 17.61 |
| Household members | 4.99 | 4.81 | 4.62 | 4.52 | 4.16 | 4.63 |
| Education of head of household | 6.74 | 7.64 | 8.41 | 9.74 | 11.96 | 8.85 |
| Age of head of household | 43.98 | 43.52 | 43.85 | 43.42 | 44.13 | 43.78 |
| Female head of household | 29% | 23% | 26% | 23% | 23% | 25% |
| Observations | 2 621 | 2 290 | 2 540 | 2 473 | 2 322 | 12 246 |
Source Own calculations with data from ENUT-2019.
In general, it can be observed that the total weekly hours of TDNR in households decreases with higher income levels; this behavior seems to be mainly driven by the time dedicated to consumer-related activities since variables such as the hours spent on food preparation, household cleaning and laundry decrease as income rises. This empirical relationship can be explained by the possibility that households with higher incomes can pay for the realization of these activities (contracting out household chores). On the other hand, the behavior of time spent on educational support, although in some parts of the distribution appears to be increasing, does not seem to have a clear ren in this descriptive analysis and without the use of additional controls.
Identification strategy
The hypothesis being studied is that there is a differentiated pattern of behavior between the hours of TDNR dedicated to consumption and those dedicated to investment in human capital and that family income is fundamental in explaining the differences between these patterns of behavior. The relationship between income and TDNR faces significant problems of unobserved heterogeneity (omitted variables) and causal bi-directionality. However, based on the theoretical proposal in this article, it is interesting to observe how the hours of TDNR dedicated to consumption and investment are determined by income distribution.
Under these considerations of endogeneity, before observing the behavior of the TDNR by income levels, we must be able to control, at least for the demographic structure and the human capital of the families, variables which, in the descriptive analysis, seem to be significantly related to the TDNR. Bearing this empirical objective in mind, we propose estimating a semiparametric linear-partial model submitted by Speckman (1988) and used by Ceballos and Guadarrama (2020). The two-stage method combines parametric estimators obtained from ordinary least squares (OLS) in the first stage and non-parametric estimators derived from a Kernel function in the second stage. In this case, the model in the first stage corresponds to OLS estimates of TDNR hours on household characteristics as follows:
Where Hi is the total TDNR hours dedicated to educational support or consumption in household i; Xi is the matrix of the set of explanatory variables that include gender, age and schooling of the head of household, as well as the number of wage earners and children in the household; β is the parameter to be estimated corresponding to the effects of sociodemographic characteristics on TDNR; and ui is the random disturbance of the model.
Table 2 presents the variables used to estimate equation (15). Total household TDNR hours are grouped into two categories: a) those spent on children's educational support as a representation of investment in human capital; and b) a set of activities that includes food preparation, laundry and housework as consumption-related time variables.4 Three models of per capita hours of unpaid household production are estimated by OLS, using the same set of explanatory variables in each case.
Table 2 Variables for the estimation of TDNR hours (first stage)
| Dependent variables (Hi): hours of household work | Eplanatory variables (Xi) |
|---|---|
|
|
|
Fuente: elaboración propia.
To complete the identification strategy, the TDNR hours predicted by the equation (15) model are observed throughout the per capita income distribution 5 without assigning a preconceived functional form. Non-parametric models are estimated using polynomial estimators derived from a Kernel function as used by Delgado and Miles (1997), Garcia (2012) and Ceballos (2019):
The variable
Where K is a Kernel function that gives greater weight to households whose income has values close to the xo percentile. Based on the proposal of Gutierrez et al. (2003), equation (17) for each xo percentile estimates an m(xo) approximation so that the function m(income percentilei) is very flexible for capturing variations of TDNR hours over the income quantiles of households and testing the predictions of the theoretical model.6
Results
Table 3 presents the results of the parametric OLS regressions for the total and two types of TDNR (investment and consumption). In this first stage, the objective is to generate predictions of the controlling time of TDNR according to the household characteristics. It is worth mentioning that the effects of these control variables are not the primary objective of this research. However, this first stage shows that even after considering the main characteristics of each household, the behavior of TDNR varies throughout the distribution of household monetary income. In Table 3, most of the explanatory variables are statistically significant with more than 95% confidence, both in the t-tests for each variable and in the F-tests for joint significance. Likewise, it is confirmed that the hours of TDNR in the household are significantly linked to the level of human capital and the family demographic structure.
Table 3 Determining factors of TDNR hours. OLS estimates
| Total TDNR Hours | Investment Hours dedicated to children´s educational support | Consumption Hours devoted to production of consumption | |
|---|---|---|---|
| Female head of household | -11.196*** | -0.935*** | -7.532*** |
| (1.055) | (0.159) | (0.693) | |
| Years of education of head of household | -0.575*** | 0.142*** | -0.762*** |
| (0.115) | (0.017) | (0.074) | |
| Age of head of household | 0.822*** | 0.136*** | 1.960*** |
| (0.215) | (0.028) | (0.121) | |
| Age squared | 0.001 | -0.001*** | -0.013*** |
| (0.002) | (0.000) | (0.001) | |
| Number of children between 0 and 14 years old | 12.742*** | 1.588*** | 5.845*** |
| (0.574) | (0.074) | (0.323) | |
| Number of employed wage earners | 7.355*** | 0.345*** | 5.084*** |
| (0.537) | (0.074) | (0.321) | |
| Constant | 30.367*** | -1.734** | -5.413* |
| (4.958) | (0.684) | (2.975) | |
| F test | 202.05 | 93.32 | 337.66 |
| R-squared | 0.1362 | 0.0507 | 0.1619 |
| Observations | 12 246 | 12 246 | 12 246 |
Notes: *** 1%; ** 5% and * 10% significance. In parentheses, the standard robust errors to heteroscedasticity..
Source: Compiled by the authors with data from the ENUT-2019.
It is observed that a household with a female head (compared to households with a male head) significantly decreases total TDNR time (11.2 hours), consumption time (more than 7.5 hours) and investment time (close to 1 hour) by more than 10% of the average total hours dedicated to the activity in each case. This negative relationship may be associated with the substitution effect of TDNR for paid work in households with a female head. Considering the historical evidence of the unequal gender distribution of TDNR, women are the ones who dedicate more time to such work. However, when they are heads of household, they substitute it with paid work, causing a decrease in TDNR in the family as a whole.
Years of education have a negative effect on total TDNR and consumption but a positive effect on TDNR investment. In particular, each additional year of education decreases total TDNR by more than half an hour and increases the time spent on educational support for household children by just over ten minutes. The contrary signs are the first significant indication of the varied behavior of the TDNR. The academic level of the head of the household is highly correlated with the socioeconomic level of the household; the higher the socioeconomic level, the greater the possibility of reducing the hours of TDNR by contracting domestic work related to consumption. On the other hand, in the case of investment in human capital, substitution is not direct and with a higher level of education of the head of household, the time dedicated to educational support for the children of the household increases.
Table 3 also shows that an additional child from 0 to 14 years of age or another salaried employee increases the hours dedicated to the two types of TDNR and the total. These variables positively correlate with the TDNR because the total number of household members is negatively related to the socioeconomic level. In other words, the greater the number of employed persons, the larger the household size (not necessarily the higher the socioeconomic level) and the more time dedicated to TDNR. It is possible to observe that, with this first stage, the model variables explain 13.6% of the variations of total TDNR, 5% of investment TDNR and 16% of consumption TDNR.
Based on the three regressions, Figures 5, 6 and 7 present the estimates of the second stage of the semi-parametric model. In other words, the figures plot the average values of TDNR for each income quantile after allowing for the variables incorporated in the estimates in Table 3. Figure 5 reports the estimates for total TDNR, Figure 6 for investment TDNR and Figure 7 for consumption TDNR. In all three cases, the percentiles of per capita income of Mexican households are on the horizontal axis and the TDNR hours are on the vertical axis.
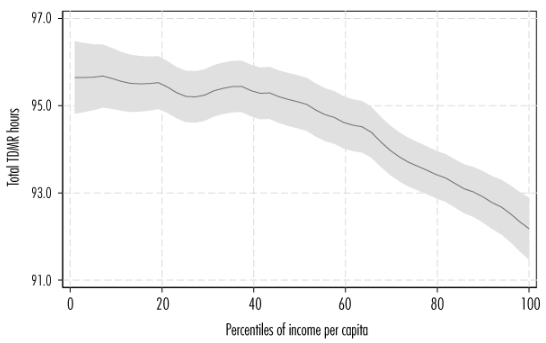
Source: Compiled by the authors with data from the ENUT-2019.
Figure 5 Total weekly hours of TDNR. Predictions of the estimated model by percentile of per capita income.
Source: Compiled by the authors with data from the ENUT-2019.
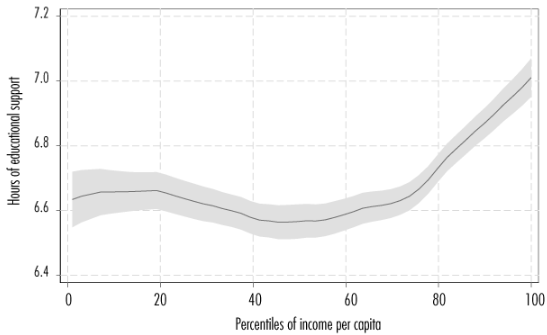
Figure 6 Weekly hours of household work devoted to educational support of children. Predictions of the model estimated by percentile of per capita income
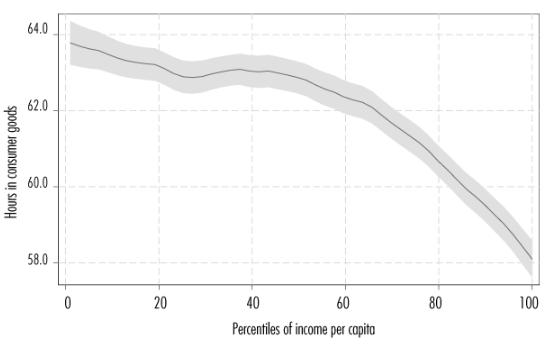
Source: Compiled by the authors with data from the ENUT-2019.
Figure 7 Weekly hours of TDNR dedicated to consumption. Predictions of the estimated model by percentile of per capita income
Figure 5 shows that the predicted total TDNR time decreases as household per capita income increases. Thus, while the total TDNR time is 95.4 hours per week in the first percentile, it is only 92.7 hours in the last percentile. The shading around the solid line in Figure 5 reports the confidence intervals, showing that said decreasing trend in TDNR hours is statistically significant throughout the income percentiles.
Figure 6 shows the evolution of the TDNR investment in human capital (child educational support). It is observed that as household per capita income increases, TDNR investment also increases. While in the first percentile, TDNR investment is 6.6 hours per week, it rises to 7 hours per week in the last percentile. The reported confidence intervals allow us to observe that the changes along the percentiles of per capita income are statistically significant.
The increasing behavior in Figure 6 is in line with the predictions of the theoretical model (see Figures 3 and 4), in which an increase in household monetary income also increases the amount of TDNR earmarked for investment. However, it is essential to recognize that this increase operates in a relatively small range with some decreasing behavior across the distribution, especially between the 30th and 50th percentiles of this empirical exercise.
Finally, Figure 7 reports the behavior of the TDNR of predicted consumption (hours of food preparation, laundry and household chores) throughout income percentiles. Clearly decreasing behavior is observed, which is also statistically significant. While the TDNR of predicted consumption amounts to about 64 hours per week in households in the first percentile, the amount decreases to 58 hours in households in the last percentile. This finding provides evidence in favor of the predictions of the suggested theoretical model: consumption-oriented TDNR tends to decrease as household monetary income increases.
5. Conclusions
This paper presented an alternative use of the basis of the TDNR model suggested by Folbre (2014), which, according to certain reformulations and extensions, allows us to show that unpaid household production is heterogeneous and has differentiated behavior throughout the distribution of household income. The TDNR contributes to the extended household income and, together with this, is spent on consumption and investment in human capital. A specific functional form was associated with household production, introducing a Keynesian-type consumption function. This allows us to predict that investment TDNR tends to increase with monetary income while that devoted to consumption decreases.
To validate the theoretical predictions of the model, a semi-parametric analysis was performed using data from the latest ENUT for Mexico. The model uses relevant socio-demographic variables in the first stage and explains the TDNR on the distribution of family income in the second stage. As a proxy for the investment TDNR in human capital, the time spent on educational support for children under 14 years of age in the household was used. The results of the econometric analysis are evidence in favor of the proposed theoretical model. Consumption TDNR tends to decrease with household per capita income, being controlled using various sociodemographic characteristics of the families, while the investment TDNR in human capital tends to increase. Both results are statistically significant.
The theoretical and empirical results presented have relevant implications for economic literature and public policy. On the one hand, the theoretical framework Folbre (2012 and 2014) proposed is developed and extended by highlighting the heterogeneous nature of TDNR in terms of consumption and investment. On the other, vis-à-vis the literature on human capital, a rare approach is presented to linking human capital investment to households and their unpaid household production.
The findings also suggest important lines in economic issues such as poverty, inequality and social mobility. It was found that in lower-income households, the time dedicated to consumer goods is more significant to the detriment of time dedicated to investment in human capital. On the other hand, families with higher levels of wealth can use the market to contract the domestic production of consumer goods (cleaning, food preparation, among others) in favor of time dedicated to investment in human capital. This situation undoubtedly puts lower-income households at a disadvantage with respect to their investment opportunities and reproduces different social and economic gaps.
The results also constitute a relevant input for the evaluation and formulation of care policies and the reduction of gender gaps. For example, an improvement in income distribution (especially for the lowest quintiles) also contributes to a more significant investment by these households in the capabilities of their children, thus reducing inequality in the reproduction of human capital.
Finally, it is worth mentioning that although the purpose of this article was not the distribution of TDNR at the intra-household level, the results constitute a starting point for future research on this critical topic. Considering the importance of grouping TDNR into consumption and investment time, this allows us to refine the analyses related to the distribution of unpaid household production, not only from the perspective of workloads by gender, age, etc. but also thinking about the people (children and adults) who benefit from the investment derived from the use of time.
Acknowledgments
The authors would like to thank two anonymous journal reviewers for their valuable comments for improving this paper.
REFERENCES
Addati, L., Cattaneo, U., Esquivel, V. y Valarino, I. (2018). Care work and care jobs for the future of decent work. International Labour Organization, ILO. https://www.ilo.org/global/publications/books/WCMS_633135/lang-en/index.htm. [ Links ]
Amarante, V. y Rossel, C. (2018). Unfolding patterns of unpaid household work in Latin America. Feminist Economics, 24(1). http://dx.doi.org/10.1080/13545701.2017.1344776. [ Links ]
Becker, G. S. (1962). Investment in human capital: A theoretical analysis. Journal of Political Economy, 70(5, Part 2). https://dx.doi.org/10.1086/258724. [ Links ]
______ (1965). A theory of the allocation of time. The Economic Journal. https://doi.org/10.2307/2228949. [ Links ]
______(1985). Human capital, effort, and the sexual division of labor. Journal of Labor Economics, 3(1, Part 2). https://doi.org/10.1086/298075. [ Links ]
Bloemen, H. G., Pasqua, S. y Stancanelli, E. G. (2010). An empirical analysis of the time allocation of Italian couples: are they responsive? Review of Economics of the Household, 8(3). https://doi.org/10.1007/s11150-009-90 83-4. [ Links ]
______ y Stancanelli, E. G. (2014). Market hours, household work, child care, and wage rates of partners: An empirical analysis. Review of Economics of The Household, 12(1). https://doi.org/10.1007/s11150-013-9219-4. [ Links ]
Campaña, J. C., Gimenez-Nadal, J. I. y Molina, J. A. (2020). Self-employed and employed mothers in Latin American families: Are there differences in paid work, unpaid work, and child care? Journal of Family and Economic Issues, 41(1). https://doi.org/10.1007/s10834-020-09660-5. [ Links ]
Carrasco, C. (2013). El cuidado como eje vertebrador de una nueva economía. Cuadernos de relaciones laborales, 31(1). http://dx.doi.org/10.5209/rev_crla.2013.v31.n1.41627. [ Links ]
Carrasco, C., Borderías, C. y Torns, T. (2011). El trabajo de cuidados. Historia, teoría y política. La Catarata. https://www.fuhem.es/media/cdv/file/biblioteca/Economia_critica/El_trabajo_de_cuidados_C._Carrasco_C._ Borderias_T._Torns.pdf. [ Links ]
Ceballos, O. (2019). Perfiles económicos y comportamiento del gasto en salud de los hogares con personas adultas mayores. Estudios Demográficos y Urbanos, 34(3). http://dx.doi.org/10.24201/edu.v34i3.1643. [ Links ]
Ceballos, O. y Guadarrama, H. (2020). Efectos de la escolaridad en el consumo de calorías y nutrientes de las familias mexicanas. Problemas del Desarrollo. Revista Latinoamericana de Economía, 51(203 ). https://doi.org/10.22201/iiec.20078951e.2020.203.69569 [ Links ]
Delgado, M. A. y Miles, D. (1997). Household characteristics and consumption behaviour: a nonparametric approach. Empirical Economics, 22(3). https://doi.org/10.1007/bf01208831. [ Links ]
Duque-García, C. (2015). Hogares y cuidado doméstico no remunerado en Colombia. Ensayos de Economía, 25(47 ).https://revistas.unal.edu.co/index.php/ede/article/view/56980 [ Links ]
Espino, A. y Salvador, S. (2014). El sistema nacional de cuidados en Uruguay: ¿una apuesta al bienestar, la igualdad y el desarrollo? Revista de Economía Crítica, 18. https://revistaeconomiacritica.org/index.php/rec/article/view/273 [ Links ]
Esquivel, V. (2012). Cuidado, economía y agendas políticas: una mirada conceptual sobre la “organización social del cuidado”en América Latina. En V. Esquivel (ed.). La economía feminista desde América Latina: una hoja de ruta sobre los debates actuales en la región (pp. 141-185). ONU Mujeres Santo Domingo. https://www.unwomen.org/es/digital-library/publications/2012/6/la-economia-feminista-desde-america-latina [ Links ]
Folbre, N. (2012). The political economy of human capital. Review of Radical Political Economics, 44(3). https://doi.org/10.1177/0486613412440240. [ Links ]
______(2014). The production of people by means of people. Political Economy Research Institute Uma. https://peri.umass.edu/publication/item/652-the-production-of-people-by-means-of-people. [ Links ]
García, B. (2017). El trabajo doméstico y de cuidado en México. Coyuntura Demográfica. Revista sobre los procesos demográficos de México hoy, 11. http://coyunturademografica.somede.org/wp-content/plugins/coyuntura_demografica/COMPLETAS/11.pdf [ Links ]
______ (2019). El trabajo doméstico y de cuidado: su importancia y principales hallazgos en el caso mexicano. Estudios Demográficos y Urbanos, 34(2). https://doi.org/10.24201/edu.v34i2.1811. [ Links ]
García, B. y Pacheco, E. (2015). Uso del tiempo y trabajo no remunerado en México. El Colegio de Mexico A.C., ONU-Mujeres e INMUJERES. [ Links ]
García, R. (2012). Medidas de desempeño en regresiones no paramétricas de curvas de Engel. Comunicaciones en Estadística, 5(2). http://hdl.handle.net/11336/198938 [ Links ]
Giannelli, G. C., Mangiavacchi, L. y Piccoli, L. (2012). GDP and the value of family caretaking: How much does europe care? Applied Economics, 44(16). https://doi.org/10.1080/00036846.2011.558485 [ Links ]
Gutierrez, R., Linhart, J. M. y Pitblado, J. (2003). From the help desk: Local polynomial. The Stata Journal, 3(4).http://www.stata-journal.com/sjpdf.html?articlenum=st0053 [ Links ]
Herrera, C., Dijkstra, G. y Ruben, R. (2019). Gender segregation and income differences in Nicaragua. Feminist Economics, 25(3). https://doi.org/10.10 80/13545701.2019.1567931 [ Links ]
Hersch, J. y Stratton, L. S. (1997). Housework, fixed effects, and wages of married workers. Journal of Human Resources, 32(2). https://doi.org/10.2307/146216. [ Links ]
Instituto Nacional de Estadística y Geografía (INEGI) (2022). Trabajo no remunerado de los hogares. INEGI. https://www.inegi.org.mx/temas/tnrh/ [ Links ]
______ (2023). Encuesta Nacional sobre Uso del Tiempo (ENUT) 2019. INEGI. https://www.inegi.org.mx/programas/enut/2019/ [ Links ]
Kalenkoski, C. M., Ribar, D. C. y Stratton, L. S. (2005). Parental child care in single-parent, cohabiting, and married-couple families: time-diary evidence from the United Kingdom. American Economic Review, 95(2). https://doi.org/10.1257/000282805774670176. [ Links ]
Llanes, N. y Pacheco, E. (2021). Maternidad y trabajo no remunerado en el contexto del Covid-19. Revista Mexicana de Sociología, 83(SPE). http://revistamexicanadesociologia.unam.mx/index.php/rms/article/view/60 069/53130 [ Links ]
Mahmoud, D. y Gadallah, M. (2011). Imputing monetary value to Egyptian females’ unpaid domestic and care work. Journal of Development and Economic Policies, 13(1). https://www.arab-api.org/Files/Publications/PDF/619/619_j13-1-5.pdf. [ Links ]
Martínez, M. y Rojas, O. L. (2016). Una nueva mirada a la participación masculina en el trabajo doméstico y el cuidado de los hijos en México. Estudios Demográficos y Urbanos, 31(3). https://doi.org/10.24201/edu.v31 i3.14. [ Links ]
Miranda, V. (2011). Cooking, caring and volunteering: Unpaid work around the world. OECD Social, Employment, and Migration Working Papers, 116. https://doi.org/10.1787/5kghrjm8s142-en. [ Links ]
Nieto, M. P. (2004). Género, trabajo doméstico y extradoméstico en México. Una estimación del valor económico del trabajo doméstico. Estudios Demográficos y Urbanos, 19(2). https://doi.org/10.24201/edu.v19i2.1191 [ Links ]
Nussbaum, M. C. (2001). Women and human development: The capabilities approach (vol. 3). Cambridge University Press. [ Links ]
______ (2011). Creating capabilities. Harvard University Press. [ Links ]
Organisation for Economic Cooperation and Development (OECD) (2020). Time Use. OECD. Stat. https://stats.oecd.org/index.aspx?queryid=54757# [ Links ]
Qi, L. y Dong, X. Y. (2016). Unpaid care work’s interference with paid work and the gender earnings gap in China. Feminist Economics, 22(2). https://doi.org/10.1080/13545701.2015.1025803. [ Links ]
Santoyo, L. y Pacheco, E. (2014). El uso del tiempo de las personas en México según tipo de hogar. Una expresión de las desigualdades de género. En B. García y E. Pacheco. Uso del tiempo y trabajo no remunerado en México (pp. 171-219). El Colegio de México, A.C., ONU Mujeres, Instituto Nacional de las Mujeres. [ Links ]
Sen, A. (2001). Development as freedom. Oxford Paperbacks. [ Links ]
Speckman, P. (1988). Kernel smoothing in partial linear models. Journal of the Royal Statistical Society. Series B (Methodological), 50(3). http://www.jstor.org/stable/2345705 [ Links ]
1Given the nature of the TDNR, its monetary valuation requires the allocation of a shadow price according to the opportunity cost for the person performing the activity and the replacement cost at the market level, among other strategies (Nieto, 2004). INEGI's Unpaid Labor Satellite Account commonly relies on the valuation of these activities at market prices. For further methodological details, see INEGI (2022).
2
Due to the use, for the sake of simplicity, of the linear form of the Keynesian consumption function, with increasing income, the ratios H1 /Hi and Hc /Hi converge to 1-c and a c, respectively. Calculating the limits for equations (11) and (12), it is verified that:
3Under the broad definition of human capital adopted in this paper's approach, it is possible that there are other TDNR variables associated with investment in human capital. For example, use of time that represents the improvement or maintenance of household capacities or skills, such as health care for members in the productive stage or recreational activities, among others. This article uses the variable of educational support for children because of its availability in the information source.
4Leisure time was not incorporated into the analysis because its rigorous operationalization falls outside the objective and scope of this article. However, it could be developed in future research.
5Using per capita income enables us to make adjustments in relation to household size, without resulting in collinearity problems by including members of interest such as wage earners and children in the first stage of the model.
6
Gutierrez et al. (2003) state:
Received: April 02, 2023; Accepted: August 08, 2023
 Este es un artículo publicado en acceso abierto bajo una licencia Creative Commons
