


Services on Demand
Journal
Article
 text in
  English (pdf)
 Article in xml format
 Article references
 Send this article by e-mail
Indicators
-
 Cited by SciELO
 -
 Access statistics
Related links
-
 Similars in
SciELO
Similars in
SciELO
Share

 Permalink
Tecnología y ciencias del agua
On-line version ISSN 2007-2422
Tecnol. cienc. agua vol.11 n.3 Jiutepec May./Jun. 2020 Epub June 10, 2024
https://doi.org/10.24850/j-tyca-2020-03-01
Articles
Estimating areas vulnerable to flooding in urban zones: Morelia, Michoacán, Mexico

1Colegio de Postgraduados, Montecillo, Texcoco, Estado de México, México, alarcon.anastasia@colpox.mx
2Colegio de Postgraduados, Montecillo, Texcoco, Estado de México, México, chavezje@colpos.mx
3Colegio de Postgraduados, Montecillo, Texcoco, Estado de México, México, opalacio@colpos.mx
4Universidad Autónoma Chapingo, Postgrado en Ingeniería Agrícola y Uso Integral del Agua, carretera México-Texcoco, Chapingo, Texcoco, Estado de México, México, libacas@gmail.com
We determined areas of Morelia, Michoacán, that are vulnerable to flooding caused by the river Río Grande de Morelia, which crosses the city. A hydrological model in the river’s basin and another hydraulic model on the stretch of river that goes through the city were applied.
The hydrological model was carried out with HEC-HMS considering the characteristics of the sub-basins such as area, lag time and number of runoff curves. The precipitations were incorporated with hyetographs for September 2013. The model was calibrated based on a gauged hydrograph at the outlet of the basin and adjusting the values of the runoff curve number until an acceptable fit was obtained between the hydrograph calculated by the model and that gauged at the basin’s exit. The fit was evaluated with the criteria Nash-Sutcliffe, RMSE and Coefficient of Determination.
With the calibrated hydrological model, an event lasting 24 hours was identified and the precipitations for hyetographs were substituted by those associated with 100- and 500-year return periods estimated with the Gumbel Probability Distribution. Both events were modeled, and hydrographs were obtained.
Hydraulic modeling of the section of the Río Grande River that crosses the city was carried out with IBER, using the hydrographs for each return period, channel topography and Manning roughness coefficients. The results of this last modeling allowed identification of the areas vulnerable to flooding produced by rises associated with the return periods considered.
Keywords: Model; hyetograph; automatic weather station; hydrograph; Gumbel PDF; return periods; recurrence interval
Se determinaron áreas vulnerables a inundaciones en la ciudad de Morelia Michoacán, causadas por el río Grande de Morelia que la cruza; esto, mediante la aplicación de un modelo hidrológico en su cuenca hidrológica y otro hidráulico sobre el río, en su tramo por la ciudad.
La modelación hidrológica se realizó con HEC-HMS, considerando las características de las subcuencas como área, tiempo de retraso y valores de curvas de escurrimientos. Las precipitaciones se incorporaron mediante hietogramas para septiembre de 2013. Se calibró el modelo, tomando como base un hidrograma aforado a la salida de la cuenca y adecuando valores de curva número de escurrimientos hasta tener un ajuste aceptable entre el hidrograma calculado por el modelo y el aforado a la salida de la cuenca; el ajuste se evaluó mediante los criterios de Nash-Sutcliffe, RMSE y el coeficiente de determinación.
Con el modelo hidrológico calibrado, se identificó un evento con duración de 24 horas y se sustituyeron las precipitaciones por hietogramas asociados con los periodos de retorno de 100 y 500 años, que se estimaron mediante la función de distribución de probabilidad Gumbel; se modelaron ambos eventos y se obtuvieron hidrogramas.
La modelación hidráulica del río Grande se realizó con IBER, retomando los hidrogramas para cada periodo de retorno, topografía del cauce y coeficientes de rugosidad de Manning. Los resultados de esta última modelación permitieron identificar las zonas vulnerables a inundaciones producidas por avenidas asociadas con los periodos de retorno considerados.
Palabras clave: modelo; hietograma; estación meteorológica automática; hidrograma; Gumbel; periodo de retorno
Introduction
A flood is a rise of water above normal levels of a current or body of water or the accumulation of water over areas that are not normally submerged (WMO, 2011). Generally, extraordinary rainfall is the main cause of floods that endanger lives and material goods (Kidd & Huffman, 2011).
To model the rain-runoff process, we use hydrological models such as Hydrologic Engineering Center-Hydrologic Modeling System (HEC-HMS) (USACE, 2016), among other techniques. For the transit of floods in channels and flood plains, hydraulic-type models are used (Fuentes-Mariles & Franco, 1999). A bidimensional hydraulic simulation model in channels is the IBER model developed by the Institute of River Dynamics and Hydrological Engineering (FLUMEN, 2010) that has the advantage of considering the topography of channels and flood plains on a grid.
In the case of the city of Morelia, the urban population has grown into flood-risk areas (Corona-Morales, 2009). In this city, multiple floods have occurred causing economic losses and destruction of infrastructure (Conagua, 2016). In this study, we determined areas of Morelia that are vulnerable to floods and propose the use of mathematical models.
Methodology
The basin was delimited up to the El Plan Conventional Hydrometric Station using HEC-GeoHMS (HEC-GeoHMS, 2017). This program generated a scheme formed by sub-basins, rivers and unions. Also, we determined mainly parameters, such as lag time and value of runoff curve number at the sub-basin level.
We analyzed meteorological information available from the Conventional Meteorological Stations (CMS), consisting of a set of instruments placed outdoors to measure weather variations, and from Automatic Meteorological Stations (AMS) that are made up of a group of sensors that record and transmit weather information automatically.
With the register of rainfall in September of 2013 from the AMS, we constructed an adimensional hyetograph and used it as the basis for generating hyetographs with the CMS. In turn, with the historic register from the CMS, we analyzed 24-hour maximums and estimated precipitations for 100- and 500-year return periods (Tr) with the Gumbel Probability Distribution function.
Analysis of the hydrometric information consisted of reviewing the historic record of gauges of the El Plan Conventional Hydrometric Station (CHS) with which a hydrograph was generated.
Hydrological modeling was carried out with HEC-HMS (2017), using the scheme of the basin. The following values were fed into HEC-HMS: areas, number of runoff curve values and lag time. Hydrological simulation was carried out in two parts. The first part was to calibrate the model using the hydrograph observed in the El Plan CHS as the base. In the second part, 24-hour maximum events were modeled for the return periods of 100 and 500 years.
We used IBER for hydraulic modeling. An uneven grid was used with channel geometry information, Manning coefficient, and hydrographs for each channel of Río Grande tributaries. With the results of the hydraulic model, we identified areas vulnerable to flooding.
Results
The hydrological basin up to the El Plan CHS, code 12588 (19°49’10’’ N and 101°00’40’’ W), is in the northwestern part of the state of Michoacán and covers an area of 1,578.36 km2. The basin was divided into 14 sub-basins as shown in Figure 1.

The hydrography in Morelia is mainly made up of the Río Grande, into which flow tributaries such as Itzícuaro River, Chiquito River, the La Higuera stream and the El Obispo stream. In the upper part of the Río Grande is the Cointzio Dam (19°37’48” N and 101°15’27” W).
Concentration times were calculated with the Kirpich formula (Conagua, 2011), and lag times were calculated considering 60% of the concentration time (USACE, 2016).
Number of runoff curve values were obtained by discretization of the edaphic distribution of the vector maps with which we determined soil texture and unit and sub-units of the predominant soil and then the soil hydrological group (A, B, C or D). Later, with land use and vegetation maps, we determined the number of runoff curve values in function of the condition of the plant cover. Table 1 shows the main characteristics at the sub-basin level.
Table 1 Characteristics at the sub-basin level.
| Sub-basin | Area (km2) | Concentration time (min) | Lag time (min) | Runoff curve number (adimensional) |
|---|---|---|---|---|
| W1040 | 260.48 | 308.51 | 185.1 | 77.55 |
| W810 | 88.00 | 276.26 | 165.8 | 77.74 |
| W830 | 283.27 | 274.47 | 164.7 | 79.08 |
| W760 | 45.97 | 143.31 | 120.3 | 79.94 |
| W1150 | 60.11 | 36.68 | 95.0 | 78.06 |
| W1100 | 45.47 | 83.18 | 86.0 | 81.18 |
| W610 | 68.79 | 158.25 | 213.1 | 81.27 |
| W690 | 99.49 | 200.49 | 22.0 | 79.05 |
| W590 | 126.77 | 355.13 | 49.9 | 83.94 |
| W840 | 32.29 | 215.64 | 43.6 | 79.9 |
| La Higuera | 95.19 | 72.64 | 123.5 | 91.27 |
| Río Chiquito | 149.39 | 205.77 | 282.6 | 82.7 |
| A. Blanco | 54.19 | 174.35 | 104.6 | 83.23 |
| A. Obispo | 168.94 | 471.07 | 129.4 | 90.19 |
The meteorological analysis consisted of identifying the stations near the basin. Six CMS and two AMS were found. To determine the influence of these at the sub-basin level, isohyets were generated for the month of September 2013 (Figure 2).

From the isohyet analysis, a station of influence was assigned to each sub-basin. The list is presented in Table 2.
Table 2 Stations selected for each sub-basin.
| Sub-basin | Station | Sub-basin | Station |
|---|---|---|---|
| W1040 | AMS-Tercer Mundo/16513 El Jacal | W690 | AMS -Tercer Mundo/16513 El Jacal |
| W810 | AMS -Tercer Mundo/16513 El Jacal | W590 | 16105-Quirio |
| W830 | AMS -Cointzio/16022 Cointzio | W840 | 16105-Quirio |
| W760 | AMS -Cointzio/16022 Cointzio | La Higuera | AMS -Cointzio/ 16022 Cointzio |
| W1100 | AMS -Tercer Mundo/ 16513 El Jacal | Río Chiquito | 16080-Morelia (OBS) |
| W1150 | 16254-Teremendo | Arroyo Blanco | 16512-El Colegio |
| W610 | AMS -Cointzio/16022 Cointzio | El Obispo | 16512-El Colegio |
We were not able to access the rainfall data to generate hyetographs with intervals of less than 24 hours. However, using the methodology of López et al. (2012) and the register of rainfall in some neighboring AMS outside or inside the basin (that generally report precipitation every 10 min), we assumed that the distribution in 24 hours of the daily values in the CMSs is similar to those of the AMS.
With the report from two AMS for September 2013 every 10 minutes, the temporal distribution of the precipitation was used to generate a monthly hyetograph for each AMS (dividing the ordinates of the hyetograph observed in the AMS by the total precipitation registered in the same month). These hyetographs were multiplied by the depth of total precipitation reported in the CMS for the same month. In this way, hyetographs in the CMS were obtained.
With the historical register in the CMSs for the period 1986 to 2014, 24-hour maximum precipitations and the Gumbel function (Aparicio, 1992) we obtained the CMS’s expected maximums for the 100- and 500-year return periods (Table 3).
Table 3 Maximum precipitations (mm) in 24 hours for the 100- and 500-year return periods.
| Tr (years) | 16513 El Jacal | 16512 El Colegio | 16254 Teremendo | 16080 Morelia (OBS) | 16022 Cointzio | 16105 Quirio |
|---|---|---|---|---|---|---|
| 100 | 94.00 | 86.16 | 83.06 | 101.01 | 85.04 | 73.23 |
| 500 | 114.47 | 102.60 | 99.78 | 121.55 | 102.11 | 86.78 |
The hydrometric analysis found that the only CHS with available useful information was 12588 El Plan. With its register of gauges in September 2013, the hydrograph in Figure 3 was generated.

Hydrological modeling
Hydrological modeling was carried out in HEC-HMS (USACE, 2016). This program used the basin scheme integrated by sub-basins, rivers, unions and the Cointzio dam. The parameters that were fed into the model at the sub-basin level were the values of area, runoff curve number and lag times. Also, the Cointzio dam was integrated as a regulator of maximum rises and the reservoir was considered full.
The September hyetographs were input for the meteorological module, and the model was run for the entire month with 10 min intervals to obtain the simulated hydrograph. When this hydrograph was compared with the observed hydrograph (gauged) in the El Plan CHS, the peaks coincide. However, the model overestimated them. To calibrate the model, number of runoff curve number were fit for each sub-basin until an optimal value was arrived at, taking care that these values did not surpass 15%, relative to the initial proposed value (Table 4).
Table 4 Runoff curve number adjusted at the sub-basin level (adimensional).
| SUB-BASIN | RUNOFF CURVE NUMBER | DIFFERENCE (%) | |
|---|---|---|---|
| ESTIMATED | FIT | ||
| W1040 | 77.55 | 71.53 | 7.76 |
| W810 | 77.74 | 68.51 | 11.90 |
| W830 | 79.08 | 74.42 | 6.00 |
| W760 | 79.94 | 69.09 | 13.98 |
| W1150 | 78.06 | 67.47 | 13.65 |
| W1100 | 81.18 | 76.40 | 6.16 |
| W610 | 81.27 | 71.32 | 12.83 |
| W690 | 79.05 | 74.40 | 5.99 |
| W590 | 83.94 | 79.00 | 6.36 |
| W840 | 79.9 | 73.69 | 8.00 |
| La Higuera | 91.27 | 80.09 | 14.41 |
| Río Chiquito | 82.7 | 72.57 | 13.06 |
| A. Blanco | 83.23 | 73.03 | 13.14 |
| A. Obispo | 90.19 | 79.14 | 14.24 |
To determine the level of fit between the observed hydrograph and the calibrated hydrograph, goodness of fit tests were applied (Table 5). These parameters, mainly Nash-Sutcliffe (Moriasi et al., 2007), indicate that the fit of the hydrological model was found with in an acceptable range. Therefore, the calibrated values of runoff curve number for later hydrological modeling of 24-hour events and for 100- and 500-year return periods.
Table 5 Goodness of fit tests.
| Goodness of fit | Value | Score |
|---|---|---|
| Nash-Sutcliffe | 0.273 | Acceptable |
| RMSE | 13.971 | --- |
| Coefficient of determination (r2) | 0.743 | Acceptable |
Figure 4 presents the graphic comparison of the observed, simulated and calibrated hydrographs.

With the calibrated hydrological model, an event that lasted 24 hours was detected from September 20 at 12:00 hours to September 21 at 12:00 hours. The adimensional hyetographs corresponding to this event (Figure 5) were multiplied by the precipitation depth associated with the 100- and 500-year return periods.

The hydrological model was run for the 24-hour events and the hydrographs were obtained for each sub-basin that, in turn, correspond to the tributary channels that contribute runoff to the Río Grande in its passage through the city (Figures 6 and 7).


Hydraulic modeling
Hydraulic modeling was carried out in IBER software (FLUMEN, 2017), using the channel topography obtained directly in the field, and LIDAR (Conagua, 2016) topography was used for the flood plains.
The hydraulic model replicated the topography using a triangular-cell grid. The channel area was assigned a cell size of 5 meters, and the plains a cell size of 10 meters. The Manning roughness coefficients were also defined: 0.18 for the channel and 0.032 in the flood channels. The flow of each current was assigned using the corresponding hydrograph for the 100- and 500-year return periods.
The model transited the floods and estimated the depth and maximum peaks reached by the water in the channel area and river edges. With these results, which can be expected for the modeled return periods, the areas vulnerable to flooding are evident (Figure 8 and Figure 9). These areas correspond to highly populated neighborhoods such as the residential area San Lorenzo Itzcuaro, Amplificación del Club Campestre la Huerta, Molino de Parras, Profesor Jesús Romero Flores and the Cuauhtémoc sports complex.


Discussion
In the analysis, precipitations were distributed using the hyetographs of the AMS applied to the CMS; in recent years radar (Méndez-Antonio, Magaña, Caetano, Da-Silveira, & Domínguez, 2009; Méndez-Antonio, Domínguez-Mora, Magaña-Rueda, & Carrizosa-Elizondo, 2006; Magaña-Hernández, Bâ, & Guerra-Cobián, 2013) and satellites (Zubieta, Getirana, Espinoza, Lavado, & Aragón, 2017; Zubieta, Laqui, & Lavado, 2018) have been implemented. Although it is certain that these technologies will be used in the future, we decided not to use them, and we implemented one suggested by López et al. (2012).
The vulnerable areas determined in this study correspond to 100- and 500-year return periods. Corona-Morales (2009) reported what was published in the Risks Atlas of Morelia (Figure 10). In this report, a model of water depth distributed every 25 cm was carried out by analysis of peaks and identification of areas flooded in 2003. It should be noted that in this study the rain-runoff model was not used. But, because the storm was observed and the affected areas were identified, it was possible to consider problems derived from stagnating water resulting from obstruction by garbage. Evidently, most of the areas do not coincide with those determined in our study.
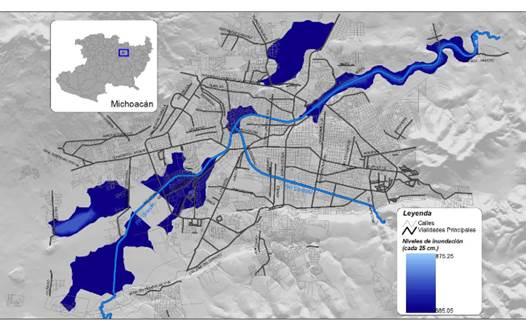
Figure 10 Model of water depth distribution every 25 cm. Risk Atlas of Morelia. Source: Corona-Morales (2009)
Another study by Roblero-Hidalgo (2018) defined areas vulnerable to flooding using a rain-runoff model for a continuous event from January 2013 to January 2014. Given that in our study we used return periods, the flooded areas coincide, but the estimates for the return periods cover more extensive areas.
Conclusions
The methodology proposed for identification of areas vulnerable to flooding contemplated the use of models. One was hydrological in HEC-HMS, which used as input hyetographs generated from information registered in the AMS and CMS, sub-basin scheme, runoff number curve values and lag times. This model was calibrated on the basis of a hydrograph gauged in the El Plan CHS and goodness of fit tests. According to the Nash-Sutcliffe criterion, it was an acceptable model.
The other model was hydraulic in IBER, for which hydrographs and a topographic grid were input. With this model, areas of the city of Morelia, Michoacán, that are vulnerable to flooding were identified for the 100- and 500-year return periods.
The models used, HEC-HMS and IBER, are highly powerful and robust for estimation of the rain-runoff process and transit of rises in the urban channels. However, they require specific information that is difficult to access in Mexico.
Referencias
Aparicio-Mijares, F. J. (1992). Fundamentos de hidrología de superficie. México, DF, México: Limusa. [ Links ]
Conagua, Comisión Nacional del Agua. (2016). Actualización del estudio para el control de avenidas en el sistema Río Grande-río Chiquito de la presa Cointzio a su desembocadura al lago de Cuitzeo. Morelia, México: Dirección Local Michoacán. [ Links ]
Conagua, Comisión Nacional del Agua. (2011). Manual para el control de inundaciones. Recuperado de http://cenca.imta.mx/pdf/manual-para-el-control-de-inundaciones.pdf [ Links ]
Corona-Morales, N. (2009). Vulnerabilidad de la ciudad de Morelia a inundaciones (tesis de maestría). Centro de Investigaciones en Geografía Ambiental, Universidad Nacional Autónoma de México, México. [ Links ]
FLUMEN. (2017). IBER (2.4.3). Software para la modelación hidráulica en 2D. Recuperado de http://www.iberaula.es/space/54/downloads [ Links ]
FLUMEN. (2010). Modelización bidimensional del flujo en lámina libre en aguas poco profundas. Manual de básico usuario 07.06.2010. Catalunya, España: Universidad Politécnica de Catalunya. [ Links ]
Fuentes-Mariles, O. A., & Franco, V. (1999). Capítulo 3. Estudio hidrológico para obras de protección. En: Manual de ingeniería de ríos. México, DF, México: Instituto de la Ingeniería, Universidad Nacional Autónoma de México. [ Links ]
HEC-GeoHMS. (2017). Software para la preparación de datos de GIS para la importación a HEC-HMS (10.2). Recuperado de https://www.hec.usace.army.mil/software/hec-geohms/downloads.aspx [ Links ]
HEC-HMS. (2017). Software para la modelación hidrológica (4.2.1). Recuperado de http://www.hec.usace.army.mil/software/hec-hms/downloads.aspx [ Links ]
Kidd, C., & Huffman, G. (2011). Global precipitation measurement. Meteorological Applications. Royal Meteorological Society, 18, 334-353. Recuperado de https://rmets.onlinelibrary.wiley.com/doi/pdf/10.1002/met.284 [ Links ]
López, J., González, M., Scaini, A., Goñi, M., Valdenebro, J., & Gimena, F. (2012). Caracterización del modelo HEC-HMS en la cuenca de río Arga en Pamplona y su aplicación a cinco avenidas significativas. Obras y Proyectos, 12, 15-30. Recuperado de https://scielo.conicyt.cl/pdf/oyp/n12/art02.pdf [ Links ]
Magaña-Hernández, F., Bâ, K., & Guerra-Cobián, V. (2013). Estimación del hidrograma de crecientes con modelación determinística y precipitación derivada de radar. Agrociencia, 47, 739-752. Recuperado de http://www.scielo.org.mx/pdf/agro/v47n8/v47n8a1.pdf [ Links ]
Méndez-Antonio, B., Magaña, V., Caetano, E., Da-Silveira, R. B., & Domínguez, R. (2009). Analysis of daily precipitation based on weather radar information in México City. Atmósfera, 22(2), 299-313. Recuperado de http://www.scielo.org.mx/pdf/atm/v22n3/v22n3a5.pdf [ Links ]
Méndez-Antonio, B., Domínguez-Mora, R., Magaña-Rueda, R., & Carrizosa-Elizondo, E. (2006). Calibración hidrológica de radares meteorológicos. Ingeniería hidráulica en México, 21(4), 43-64. [ Links ]
Moriasi, D., Arnold, J., Van-Liew, M. W., Bingner, R., Harmel, R., & Veith, T. (2007). Model evaluation guidelines for systematic quantification of accuracy in watershed simulation. Transactions of the ASABE, 50 (3), 885-900. Recuperado de https://www.researchgate.net/publication/43261199_Model_Evaluation_Guidelines_for_Systematic_Quantification_of_Accuracy_in_Watershed_Simulations [ Links ]
Roblero-Hidalgo, R. (2018). Sistema de alerta temprana, para reducir daños de eventos hidrometeorológicos extremos (tesis de doctorado). Colegio de Postgraduados, Postgrado en Hidrociencias, Campus Montecillo, Texcoco, México. [ Links ]
USACE, U.S. Army Corps of Engineers. (2016). User´s Manual of Hydrologic Modeling System HEC-HMS. Recuperado de http://www.hec.usace.army.mil/software/hec-ms/documentation.aspx [ Links ]
WMO, World Meteorological Organization. (2011). Manual on flood forecasting and warning. Recuperado de http://www.library.wmo.int [ Links ]
Zubieta, R., Getirana, A., Espinoza, J. C., Lavado, W., & Aragón, L. (2017). Hydrological modeling of the Peruvian-Ecuadorian Amazon Basin using GPM-IMERG satellite-based precipitation dataset. Hydrology and Earth System Sciences, 21(7), 3543-3555. [ Links ]
Zubieta, R., Laqui, W., & Lavado, E. (2018). Modelación hidrológica de la cuenca del río Ilave a partir de datos de precipitación observada y de satélite, periodo 2011-2015, Puno, Perú. Tecnología y ciencias del agua, 9(5), 85-105, DOI:10.24850/j-tyca-2018-05-04. [ Links ]
Received: July 05, 2018; Accepted: August 23, 2019
 Este es un artículo publicado en acceso abierto bajo una licencia
Creative Commons
Este es un artículo publicado en acceso abierto bajo una licencia
Creative Commons
