


Services on Demand
Journal
Article
 text in
  English (pdf)
 Article in xml format
 Article references
 Send this article by e-mail
Indicators
-
 Cited by SciELO
 -
 Access statistics
Related links
-
 Similars in
SciELO
Similars in
SciELO
Share

 Permalink
Tecnología y ciencias del agua
On-line version ISSN 2007-2422
Tecnol. cienc. agua vol.11 n.4 Jiutepec Jul./Aug. 2020 Epub June 10, 2024
https://doi.org/10.24850/j-tyca-2020-04-01
Articles
Removal of the direct navy-blue dye on modified coffee bean
1
 http://orcid.org/0000-0001-7711-5912
2
http://orcid.org/0000-0003-2980-8807
3
http://orcid.org/0000-0002-0112-3622
4
http://orcid.org/0000-0003-4884-5099
5
http://orcid.org/0000-0002-8333-0042
6
http://orcid.org/0000-0001-8103-7611
1Universidad Autónoma del Caribe, Barranquilla, Colombia, grey.castellar@uac.edu.co
2Universidad del Atlántico, Barranquilla, Colombia, mariacely@mail.uniatlantico.edu.co
3Universidad Autónoma del Caribe, Barranquilla, Colombia, beatriz.cardozo@uac.edu.co
4Universidad del Atlántico, Barranquilla, Colombia, edgangulo20@gmail.com
5Universidad del Atlántico, Barranquilla, Colombia, evertmendoza@mail.uniatlantico.edu.co
6Universidad de la Costa, Barranquilla, Colombia, azambran8@cuc.edu.co
7Universidad de la Costa, Barranquilla, Colombia, jjaramillo@cuc.edu.co
8Universidad Autónoma del Caribe, Barranquilla, Colombia, cristianleroy10@hotmail.com
The presence of dyes in water bodies inhibits the penetration of light, affecting the flora and fauna of these ecosystems, which is why, greater efforts are made to eliminate them before being poured. This study allowed the removal of the direct navy-blue dye (DNB), using activated carbon prepared from coffee beans and H3PO4. The experimental methodology began with the preparation of three types of activated carbon by varying the concentration of H3PO4 (20, 40 and 60% m/v). Texture properties were evaluated by adsorption-desorption isotherms with N2 to 77 K, the identification and quantification of organic functional groups, mainly acids, with FTIR and the Boehm method, respectively. Batch adsorption experiments were performed by varying the initial dye concentration (5, 10, 50, 75, 100 and 200 mg/dm3) to 25 °C and, the adsorption kinetics was determined. Both coffee beans and activated carbons have an acidic nature with surface area development between 519 and 771 m2/g. With respect to the batch study, a monolayer and multilayer growth was observed on a heterogeneous surface. Activated carbon prepared with 20% of H3PO4 recorded the highest removal capacity with a value of 25.8 mg/g. The kinetic model of pseudo second order was the one that best fit to the experimental data (R 2 > 0.98). It can be concluded that the coffee bean treated with H3PO4 is an efficient adsorbent to remove DNB from aqueous solutions.
Keywords: Activated carbon; characterization techniques; phosphoric acid; adsorption isotherm; adsorption kinetics
La presencia de colorantes en los cuerpos de agua inhibe la penetración de la luz, afectando la flora y la fauna de estos ecosistemas, razón por la cual se hacen cada vez esfuerzos mayores para eliminarlos antes de ser vertidos. Este estudio permitió remover el colorante azul marino directo (AMD), empleando carbón activado preparado a partir de la borra de café y H3PO4. La metodología experimental inició con la preparación de tres tipos de carbón activado, variando la concentración de H3PO4 (20, 40 y 60% m/v). Las propiedades de textura se evaluaron mediante isotermas de adsorción-desorción con N2 a 77 K; la identificación y cuantificación de grupos funcionales orgánicos, en especial ácidos, con FTIR, y el método de Boehm, respectivamente. Se realizaron experimentos de adsorción por lote, variando la concentración inicial del colorante (5, 10, 50, 75, 100 y 200 mg/dm3) a 25 °C y se determinó la cinética de adsorción. Tanto la borra de café como los carbones activados tienen naturaleza ácida con desarrollo de áreas superficiales entre 519 y 771 m2/g. Con respecto al estudio por lote, se observó un crecimiento en monocapa y multicapa sobre una superficie heterogénea. El carbón activado preparado con 20% de H3PO4 registró la mayor capacidad de remoción, con un valor de 25.8 mg/g. El modelo cinético de pseudo segundo orden fue el que mejor se ajustó a los datos experimentales (R 2 > 0.98). Se puede concluir que la borra de café tratada con H3PO4 es un adsorbente eficiente para eliminar AMD de soluciones acuosas.
Palabras clave: carbón activado; técnicas de caracterización; ácido fosfórico; isoterma de adsorción; cinética de adsorción
Introduction
The presence of dyes in the effluents of industries such as food, paper, carpets, rubbers, cosmetics and textiles among others, is of great concern because they directly damage the entire aquatic ecosystem due to its high resistance to biodegradation and high stability to water light and oxidizing agents (Jung, Choi, Hwang, Jeong, & Ahn, 2016). This is a serious environmental problem because few industries are responsible for cleaning their wastewater and end up pouring them into water sources, turning them into polluted waters full of dyes and other types of toxics (Peláez, 2013).
There are different techniques based on physicochemical treatments for the removal of color from textile effluents such as coagulation-flocculation, ozonation, electrochemical techniques, membrane technology and adsorption (Anastopoulos, Karamesouti, Mitropoulos, & Kyzas, 2017). Most of these processes are expensive and lead to the generation of sludge or the formation of sub products (Hameed & El-Khaiary, 2008); however, it is known that the adsorption is the most effective method, especially if the adsorbent is cheap and shows a high adsorption capacity for the removal of dyes from wastewater (Ahmad, Loh, & Aziz, 2007). In recent bibliographic consultations there is a special interest on the part of researchers about the development of effective adsorbent materials, of low cost and using unconventional precursors. Some of these adsorbents reported in their natural form and processed as activated carbon, include agro-industrial wastes, such as coconut husk, rice husk, orange peel and coffee waste, among others. This last precursor is a special case due to the use of both waste from the processes of extraction and manufacturing of instant coffee, as well as the final residue obtained from the extraction with hot water of the grain, which is normally called "bean". On the other hand, Colombia is one of the world's leading producers and consumers of coffee and despite the economic and social benefits that it represents for the country, it also generates large amounts of waste mainly after being consumed as a hot drink, finally being available in the landfills. The coffee bean has minerals and organic compounds such as carbohydrates, lipids, proteins, alkaloids, such as caffeine and trigonelline and, phenolic carboxylic acids (Ramos, 2010), that potentialize it as a precursor in the production of activated carbon.
Recent research shows the potential of coffee residues as adsorbent material in dye removal: methylene blue (Ramos, 2010; Gonçalves, Guerreiro, De Oliveira, & De Castro, 2013; Jung et al., 2016); malachite green and red 40 (Ramos, 2010); orange 7 (Jung et al., 2016), and methyl orange (Lafi & Hafiane, 2016).
In this investigation, the removal capacity of the direct navy-blue dye (DNB) on coffee bean modified with H3PO4 at fixed temperature and stirring was evaluated. The experimental data were adjusted to the Langmuir and Freundlich isothermal models and, to different kinetic models.
Materials and methods
Preparation of activated carbon
The coffee bean obtained from a commercial brand was washed with distilled water () (Lafi, Fradj, Hafiane & Hameed, 2014) hot until a constant pH was achieved, to eliminate fines and impurities present in the waste. The wet bean was dried in an oven at 105 °C for 24 hours (Heibati et al., 2015).
Activated carbon was prepared by chemical activation of the precursor with H3PO4 (Ma & Ouyang, 2013; Fernández, Nunell, Bonelli, & Cukierman, 2014; Heibati et al., 2015), at different concentrations (20% (CA20), 40% (CA40) y 60% (CA60) m/v). The impregnation consisted of adding the solution of H3PO4 to a certain amount of dry bean, under a ratio of 1: 4 (grams of bean: cm3 of solution), in a reflux ball. Then it was shaken on an ultrasound machine (Ma & Ouyang, 2013) mark Elmasonic E30h, at 65 °C for 7 hours and it was calcined in a muffle at 550 °C by 60 min. The excess H3PO4 was removed by washing with distilled water until the pH remained constant. Finally, the activated carbons were dried at 105 °C for 24 h, reserving them in a plastic container for later use.
Physicochemical characterization of coffee beans and activated carbons
The acidity of the coffee bean and activated carbons was determined by the Boehm method (Kyzas, Lazaridis, & Mitropoulos, 2012; Lafi et al., 2014; González-García, 2018; Dai et al., 2019). For quantification, 1.0 g of the samples were placed separately in 50 cm3 of NaOH, Na2CO3 and NaHCO3 solutions, Finally, it was filtered, an aliquot was taken and the final concentration was determined using potassium acid phthalate as the primary standard for the NaOH y HCl 0.1 M for the Na2CO3 and NaHCO3. This procedure was performed in triplicate. According to Boehm (2002), the NaOH neutralizes carboxylic, lactonic and phenolic groups; the Na2CO3 to the carboxylic and lactonic groups, and the NaHCO3 only to carboxylic groups. The presence of the main organic functional groups was determined by infrared spectrophotometry with Fourier transformed (FTIR) (Pavlović et al., 2014; Ahsan et al., 2018), using an equipment mark Nicolet iS10 Thermo Fisher Scientific. FTIR spectra were recorded with a resolution of 2 cm-1 at a scan speed of 20 scans per minute and infrared domain between 4 000 and 400 cm-1. The adsorbents were mixed with KBr powder in a proportion of 1:100. The specific area was determined from the adsorption-desorption isotherm of nitrogen at 77 K at relative pressures between 0.05 and 0.35, in an area analyzer brand Micromeritics Gemini VII V 3.03, adjusting the results to the isotherm model proposed by Brunauer, Emmett and Teller (BET) (Brunauer, Emmett, & Teller, 1938; Jung et al., 2017; Wen et al., 2019).
Batch experiments and kinetic study
For the batch study, a "stock" solution of 500 mg/dm3 of the DNB dye was prepared, dissolving the required amount in distilled water and from this solution dilutions of 2, 6, 10, 25 and 35 mg/dm3 for the study with the coffee bean and, of 5, 10, 25, 50, 75, 100 and 200 mg/dm3 for activated carbons. To 1 000 mg of the adsorbent 100 cm3 of each of the dilutions were added, then placed on a horizontal shaker at 120 rpm for 8 hours (estimated by previous study) at 25 °C. Finally, it was filtered, an aliquot of the DNB dye was taken, and the concentration was determined in a UV-vis spectrophotometer brand Spectronic Genesys 20, at a wavelength of 575 nm, previously determined by scanning (Figure 1).
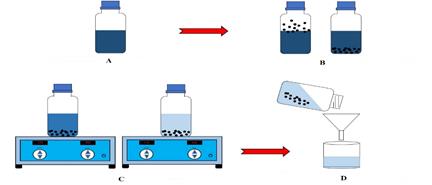
Figure 1 Batch study, A) solution prepared, B) addition of activated carbon, C) stirring system and D) filtering.
DNB dye was supplied by a company located in the city of Barranquilla (Atlántico-Colombia), dedicated to the manufacture of pants type jean. The name that receive according to The Color Index is Direct Blue 2. C.I. 22590, it is a direct dye with double azo group, molecular formula C32H21N6Na3O11S3 and molecular molar mass of 830.71 g/mol. Its molecular structure is shown in the Figure 2.

For the kinetic study, 10 samples of 1 000 mg of carbon were placed in 100 cm3 of the DNB dye solution at 50 mg/dm3 on a horizontal shaker. From time to time (5, 10, 20, 60, 120, 180, 240, 300, 360 and 420 min) one of the samples was removed, filtered and its concentration measured in a UV-vis spectrophotometer brand Spectronic Genesys 20.
Results and discussion
Physicochemical characterization
Coffee chemically consists of water and dry matter. The dry matter of almond coffee beans is made up of minerals and organic substances that are carbohydrates, lipids, proteins, alkaloids, such as caffeine and trigonelline, as well as carboxylic and phenolic acids, and volatile compounds that give the almond aroma (Puerta, 2011). Once the hot drink is prepared, some of these substances pass into the aqueous phase, while others continue to be part of what is commonly called bean. The presence of carboxylic acids and phenols in coffee beans (Table 1) is due to chlorogenic acids (phenolic acids) that are the most abundant in the coffee almonds, mainly quinic acid, cinemas acid, synaptic acid, cumaric acids, caffeic acid and caffeoilquinic acid, which is the one that most contributes to acidity; after the chlorogenic, the most abundant acids in coffee are aliphatic carboxylic acids such as citrus, acetic and malic (Puerta, 2011). The presence of lactones in the bean (Table 1), begins with the roasting of the coffee bean (Gutiérrez, 2002), where chlorogenic acids are isomerized, bind to melanoidins, hydrolyze and form quinolactones (Puerta, 2011). De La Rosa (2010), in his research he reports two lactones that have been identified in roasted coffee: 3-caffeoyl and 4-caffeine lactone from quinic acid.
Table 1 Surface acid functional groups present in coffee beans and activated carbons.
| Adsorbent | Total acidity (meq/g) | Carboxylic acids (meq/g) | Lactones (meq/g) | Phenols (meq/g) | Specific area (m2/g) |
|---|---|---|---|---|---|
| Coffee bean | 2.0 | 0.5 | 0.5 | 1.0 | 0.42 |
| CA20 | 3.0 | 1.2 | 0.3 | 1.5 | 519 |
| CA40 | 4.0 | 1.4 | 0.1 | 2.5 | 758 |
| CA60 | 5.0 | 1.6 | 0.0 | 3.4 | 774 |
When the coffee bean is activated with phosphoric acid and then the lignocellulosic material (cellulose, hemicellulose and lignin) is carbonized, they break down releasing water vapor and other volatile compounds that modify the structure, forming new functionalized surface groups (Tehrani, Aznar, & Kiros 2015), within a rigid carbon skeleton with a predominance of aromatic structures (Yakout & Sharaf, 2016). Cellulose is the most abundant natural polymer, it is composed of linear chains of D-glucose linked by β-14-glycosidic bonds with a degree of polymerization between 1 000 and 10 000 units; unlike the cellulose, hemicellulose has a lower degree of polymerization (only between 50 and 300 units) with side groups on the chain of molecules and are essentially amorphous. Both cellulose and hemicellulose have reactive hydroxyl groups in each constituent unit of anhydro glucose (Tehrani et al., 2015). The structural definition of lignin has never been as clear as that of other natural polymers such as cellulose and proteins, due to the complexity that affects its isolation, analysis of the composition and structural characterization.
The problem of a precise definition for lignin is associated with the nature of its multiple structural units, which are not usually repeated on a regular basis, since that the composition and structure of lignin vary depending on its origin and the method of extraction or isolation. But in general, lignins are copolymers that are derived primarily from three basic monomer units of phenylpropane (Jagtoyen & Derbyshire, 1998).
The increase in the content of phenols from 1.5 to 3.4 meq/g in the different activated carbons is due to the acid hydrolysis reaction that occurs when phosphoric acid attacks hemicellulose and lignin, hydrolyzing the glycosidic bonds and breaking the ether aryl bonds (Chávez-Sifontes & Domine, 2013). These reactions are accompanied by chemical transformations that include dehydration, degradation and aromatic condensation. In the opposite case to phenols, it occurs with lactones that decrease their content (Table 1) after treatment with coffee bean phosphoric acid, because they are hydrolyzed to form phenolic carboxylic acids.
The adsorption isotherms with N2 at 77K adjusted to the BET model, allowed to calculate the specific area. The results (Table 1) suggest that an increase in the impregnation ratio with H3PO4 leads to an increase in the specific area. According to Tehrani et al. (2015), and Yakout and Sharaf (2016), This behavior is mainly due to the aromatic condensation reactions that take place between the molecules of the lignocellulosic structures, which results in a carbonized material with high porosity and surface area.
The FTIR spectrum of the coffee bean and activated carbon is shown in Figure 3. According to Lafi et al. (2014), the band of intense and wide absorption that appears between the frequencies 3 600 cm-1 and 3 200 cm-1, corresponds to stretching vibrations of the interintramolecular -OH bond present in alcohols, phenols and carboxylic acids, as also in pectin, cellulose and lignin; on the other hand, the absorption bands in 1 570, 1 440 y 1 382 cm-1, respectively indicate the presence of secondary amines, C-O bond vibrations and carboxylate groups (COO-). These bands together with another one at 1 100 cm-1 frequency attributed to C-O-C stretching vibrations of aromatic esters (Fernández et al., 2014), they occur systematically in all adsorbents evaluated. In the FTIR two bands are observed that have greater intensity in the coffee erase and decrease significantly in the three activated carbons: the first is observed between 3 000 and 2 800 cm-1, which corresponds to stretching and deformation of the C-H group present in polymer chains, with simple bonds (Albis, Martínez, & Santiago, 2017), cellulose, hemicellulose and lignin type (El Messaoudi et al., 2016), and the second one in 1 740 cm-1 shows the presence of stretching vibrations of the C = O bond of ketones, aldehydes, lactones and carboxylic acids (Prahas, Kartika, Indraswati, & Ismadji, 2008); according to Fernández et al. (2014), this result suggests that after the chemical activation and calcination of the coffee bean, there are fewer alkyl groups attached to the aromatic rings. And finally, the band about 1 080 cm-1 in activated carbons suggests the presence of P+-O- phosphoric acid esters and symmetrical vibrations of P-O-P polyphosphate chains (Fernández et al., 2014). The infrared of the activated carbons bear great similarity both in amplitude, intensity and shape of the bands, as in the frequencies that appear, this suggests that although different amounts of H3PO4 were used, the chemical reactions that occurred with the treatment lead to the structuring of similar organic and inorganic functional groups.

Effect of dye concentration on removal percentage and adsorption capacity
The removal percentages (% Removal) and adsorption capacities (
Where
The Table 2 shows the variation of the percentage of removal and adsorption capacity for each of the initial DNB dye concentrations. It is observed that as the DNB concentration increases from 2 to 35 mg/dm3, the percentage of coffee bean removal decreases from 80 to 17.1%, while, for CA20 activated carbon, the concentration increases from 5 to 200 mg/dm3, the percentage decreases from 100 to 91.2%; the carbons CA40 and CA60 have a similar trend. According to Baskaralingam, Pulikesi, Ramamurthi and Sivanesan (2007), and Ahmad and Alrozi (2010), the previous behavior is due to the greater availability of active adsorption sites at low concentrations, therefore, a large part of the DNB molecules can be removed from the solution; as the initial concentration increases more DNB molecules compete for the available sites and even after reaching equilibrium, molecules remain in the solution, which reduces the percentage of removal.
Table 2 Results of adsorption capacity and removal percentages of different adsorbents.
| Adsorbent |
|
|
Removal percentage (%) |
|
|---|---|---|---|---|
| Coffee bean | 2 | 0.4 | 80.0 | 0.16 |
| 6 | 3.2 | 46.6 | 0.28 | |
| 10 | 7.0 | 30.0 | 0.30 | |
| 25 | 20.0 | 20.0 | 0.50 | |
| 35 | 29.0 | 17.1 | 0.60 | |
| CA20 | 5 | 0,0 | 100.0 | 0.50 |
| 10 | 0.0 | 100.0 | 1.00 | |
| 25 | 0.0 | 100.0 | 2.50 | |
| 50 | 0.0 | 100.0 | 5.00 | |
| 75 | 0.0 | 100.0 | 7.50 | |
| 100 | 7.6 | 92.4 | 9.24 | |
| 200 | 17.6 | 91.2 | 18.24 | |
| CA40 | 5 | 0.3 | 94.0 | 0.47 |
| 10 | 1.0 | 90.0 | 0.90 | |
| 25 | 2.6 | 89.6 | 2.24 | |
| 50 | 5.3 | 89.4 | 4.47 | |
| 75 | 8.5 | 88.7 | 6.65 | |
| 100 | 29.3 | 70.7 | 7.07 | |
| 200 | 43.3 | 78.4 | 15.67 | |
| CA60 | 5 | 0.5 | 90.0 | 0.45 |
| 10 | 1.3 | 87.0 | 0.87 | |
| 25 | 2.8 | 88.8 | 2.22 | |
| 50 | 4.8 | 90.4 | 4.52 | |
| 75 | 10.2 | 86.4 | 6.48 | |
| 100 | 54.4 | 45.6 | 4.56 | |
| 200 | 69.5 | 65.3 | 13.05 |
Regarding adsorption capacity, Table 2 shows that the initial concentration increases for all the adsorbents used. According to Ahmad and Hameed (2010), the driving force of the adsorption processes is the difference in concentration of the dye present in the adsorbent and in solution, a low concentration gradient causes a slow transport due to the decrease in the diffusion coefficient or mass transfer coefficient, while, increasing the initial concentration causes faster transport and, consequently, increases the adsorption capacity.
Adsorption isotherms
The adsorption process in this investigation took place between a solid phase (coffee eraser and activated carbon) and a liquid phase (water) containing dissolved DNB dye. When an affinity between the adsorbent and the dye is established, the latter is attracted to the solid by physical or chemical adsorption, continuing the process until the balance between the two is reached, that is, when the adsorption and desorption rates of the dye are the same. This equilibrium is described by mathematical models (adsorption isotherms) that relate the amount of dye removed and what remains in solution when equilibrium is reached at a constant temperature (Figure 4).

For the batch equilibrium study, experiments were carried out by varying the
initial concentration keeping the temperature constant at the natural pH of
the solutions for 8 hours. The Figure
4 shows the adsorption capacity (
The Langmuir isotherm model assumes that the adsorption occurs at identical active sites on the surface of the adsorbent, restricting to the monolayer covering, that is, once the solute occupies a place, no other adsorption can occur at this same site and there is no interaction between the adsorbed molecules. On the other hand, this model considers that the heat of adsorption is the same in all places and is independent of the surface covered (Langmuir, 1916).
The Langmuir isotherm according to Anastopoulos et al. (2017) can be represented as follows:
Where
The values of
The Freundlich isotherm model assumes that the heat of adsorption is not constant because it varies exponentially with the extent of the covered surface, a condition closer to reality than what Langmuir assumed. This assumption implies that the surface of the adsorbent is heterogeneous and that the adsorption sites have different affinities, first, the positions of greater affinity are occupied and later the rest is occupied, likewise, in its application it is assumed that the union is of physical type (Freundlich, 1906).
The Freundlich isotherm according to Anastopoulos et al., (2017) can be represented as follows:
Where
So, representing
The Table 3 shows the values of the Langmuir and Freundlich constants after the adjustment of the experimental data to equations 4 and 6. It is observed in this table that the linear correlation coefficients R 2 for both models are very close, which indicates that both chemisorption and fisisorption are being presented. According to Orfäo et al. (2006) this includes valence forces where electrons are shared or exchanged, as well as physical interactions like dispersion forces, interaction forces between π electrons in the basal plane of adsorbents and free electrons of DNB molecules present in aromatic rings and multiple bonds, as well as hydrogen bonds.
Table 3 Values of the constants of the Freundlich and Langmuir models.
| Adsorbent | Freundlich constants | Langmuir constants | |||||
|---|---|---|---|---|---|---|---|
|
|
|
R 2 |
|
|
R 2 | ||
| Coffee bean | 0.20 | 4.53 | 0.99 | 0.55 | 0.30 | 0.98 | |
| CA20 | 9.00 | 3.71 | 0.99 | 25.8 | 0.20 | 0.99 | |
| CA40 | 1.08 | 1.33 | 0.99 | 23.3 | 0.04 | 0.99 | |
| CA60 | 0.86 | 1.48 | 0.98 | 16.2 | 0.06 | 0.99 | |
The values of
By applying the linear regression method to the experimental data adjusted to
the Langmuir isotherm model, the maximum adsorption capacity was achieved (
When comparing the maximum adsorption capacity obtained in this investigation with that reported by other researchers (Table 4), shows that the results differ depending on: 1) the precursor used: coffee husk, ground coffee beans and coffee grounds, etc.; 2) activating agent used and activation conditions; 3) nature of the dye that is removed; 4) removal conditions, and 5) surface area, among others.
Table 4 Comparison of the maximum adsorption capacity of synthetic dyes for various activated carbon precursors.
| Precursor | Dye removed | Experimental conditions | Ref. | ||||
|---|---|---|---|---|---|---|---|
| Dose (g/100 cm3) | pH | Temperature (°C) | Concentration range (mg/dm3) | qmax (mg/g) | |||
| Coffee shella | Methylene blue | 0.1 | 5 ± 0.5 | 25 ± 2 | 25-1000 | 398 | Gonçalves et al. (2013) |
| Coffee beanb | Violet crystal | 0.5 | 6 | 20 ± 2 | 80-400 | 125 | Lafi et al. (2014) |
| Toluidine blue | 0.5 | 6 | 20 ± 2 | 80-400 | 142.5 | ||
| Spent coffee groundsc | Acid orange 7 | 0.1 | 3 | 10 | 100-1500 | 1 222 | Jung et al. (2017) |
| Coffee groundsd | Methyl orange | 0.03 | 3 | 30 | 300 | 658 | Rattanapan, Srikram and Kongsune (2017) |
| Coffee shelle | Violet crystal | 3.0 | 3 | 25 | 2.448-12.2394 | 2.0238 | Cheruiyot, Wanyonyi, Kiplimo and Maina (2019) |
| Coffee beanf | Direct navy blue | 1.0 | 6 ± 0.5 | 25 | 5-200 | 25.8 | This study |
aModified with ZnCl2.
bUnmodified.
cModified with KOH.
dModified with HNO3.
eUnmodified.
fModified with H3PO4.
Adsorption kinetics
The study of adsorption kinetics is important because it allows to establish not only the adsorption rate, as a criterion of the adsorbent efficiency, but also the adsorption mechanism (Aljeboree, Alshirifi, & Alkaim, 2017). The Figure 5 shows the variation of adsorption capacity as a function of time. The adsorption rate of the dye initially is rapid and gradually decreases with the contact time as it approaches equilibrium.
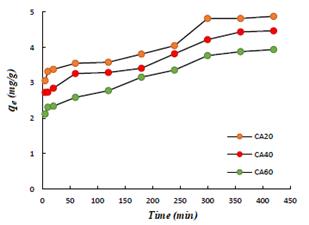
Figure 5 Adsorption kinetics of the three activated carbons.
Experimental conditions: T = 25 °C and
In order to analyze the adsorption mechanism, the experimental data were adjusted to two kinetic models: pseudo first order and pseudo second order. The pseudo first order equation is given by:
Where
Where
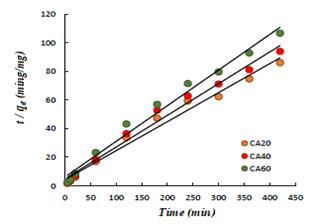
Figure 6 Comparison between the linearized equation of the pseudo second order model and the kinetic results.
To better understand the diffusion mechanism of the DNB dye in the different activated carbons, the kinetic results were adjusted to the intraparticle diffusion model, which is expressed as:
Where
Table 5 Kinetic constants of the three activated carbons.
| Adsorbent |
|
Pseudo first order model | Pseudo second order model | Intraparticle diffusion model | ||||||
|---|---|---|---|---|---|---|---|---|---|---|
|
|
|
R2 |
|
|
R2 |
|
|
R2 | ||
| CA20 | 5.0 | 0.0030 | 2.4 | 0.86 | 0.17 | 4.9 | 0.98 | 0.096 | 2.8 | 0.89 |
| CA40 | 4.5 | 0.0012 | 2.8 | 0.96 | 0.24 | 4.5 | 0.98 | 0.098 | 2.4 | 0.95 |
| CA60 | 4.0 | 0.0015 | 2.3 | 0.95 | 0.38 | 4.0 | 0.98 | 0.100 | 1.9 | 0.98 |
The values of R
2 obtained from the adjustment to the pseudo second order model
are very close to the unit (0.98), in the same way, the values of

Conclusions
Activated carbons obtained from the treatment of coffee beans with H3PO4 at different concentrations, present organic functional groups oxygenated type carboxylic acids, phenols and lactones, with porosity development, which allowed them to increase their surface area. Experimental data show good fit to Langmuir and Freundlich isothermal models, when comparing correlation factors. CA20 activated carbon prepared by 20% m/v of H3PO4 presented the greatest ability to remove direct navy-blue dye (25.8 mg/g). The kinetic model that best fits is the pseudo second order, that is, the kinetics is controlled by chemical reactions between the dye and the adsorbents forming a monolayer on the surface, with a subsequent growth in multilayer. The coffee bean has physicochemical characteristics that potentiate it as a precursor for the production of activated carbon.
Referencias
Ahmad, A., Loh, M., & Aziz, J. (2007). Preparation and characterization of activated carbon from oil palm wood and its evaluation on methylene blue adsorption. Dyes and Pigments, 75(2), 263-272. [ Links ]
Ahmad, M. A., & Alrozi, R. (2010). Optimization of preparation conditions for mangosteen peel-based activated carbons for the removal of Remazol Brilliant Blue R using response surface methodology. Chemical Engineering Journal, 165(3), 883-890. [ Links ]
Ahmad, A. A., & Hameed, B. H. (2010). Fixed-bed adsorption of reactive azo dye onto granular activated carbon prepared from waste. Journal of Hazardous Materials, 175(1-3), 298-303. [ Links ]
Ahsan, M. A., Jabbari, V., Islam, M. T., Kim, H., Hernandez-Viezcas, J. A., Lin, Y., Díaz-Moreno, C. A., Lopez, J., Gardea-Torresdey, J., & Noveron, J. C. (2018). Green synthesis of a highly efficient biosorbent for organic, pharmaceutical, and heavy metal pollutants removal: Engineering surface chemistry of polymeric biomass of spent coffee waste. Journal of Water Process Engineering, 25, 309-319. [ Links ]
Anastopoulos, I., Karamesouti, M., Mitropoulos, A. C., & Kyzas, G. Z. (2017). A review for coffee adsorbents. Journal of Molecular Liquids, 229, 555-565. [ Links ]
Albis, A., Martinez, J., & Santiago, P. (2017). Remoción de zinc (II) de soluciones acuosas usando cáscara de yuca (Manihot esculenta): experimentos en columna. Prospectiva, 15(1), 16-28. [ Links ]
Aljeboree, A. M., Alshirifi, A. N., & Alkaim, A. F. (2017). Kinetics and equilibrium study for the adsorption of textile dyes on coconut shell activated carbon. Arabian Journal of Chemistry, 10, S3381-S3393. [ Links ]
Baskaralingam, P., Pulikesi, M., Ramamurthi, V., & Sivanesan, S. (2007). Modified hectorites and adsorption studies of a reactive. Applied Clay Science, 37(1-2), 207-214. [ Links ]
Boehm, H. P. (2002). Surface oxides on carbon and their analysis: A critical. Carbon, 40(2), 145-149. [ Links ]
Brunauer, S., Emmett, P. H., & Teller, E. (1938). Adsorption of gases in multimolecular layers. Journal of the American Chemical Society, 60, 309-319. [ Links ]
Chávez-Sifontes, M., & Domine, M. (2013). Lignina, estructura y aplicaciones: métodos de despolimerización para la obtención de derivados aromáticos de interés industrial. Avances en Ciencias e Ingeniería, 4(4), 15-46. [ Links ]
Cheruiyot, G. K., Wanyonyi, W. C., Kiplimo, J. J., & Maina, E. N. (2019). Adsorption of toxic crystal violet dye using coffee husks: Equilibrium, kinetics and thermodynamics study. Scientific African, 5, e00116. [ Links ]
Dai, Y., Zhang, K., Meng, X., Li, J., Guan, X., Sun, Q., Sun, Y., Wang, W., Lin, M., Liu, M., Yang, S., Chen, Y., Gao, F., Zhang, X., & Liu, Z. (2019). New use for spent coffee ground as an adsorbent for tetracycline removal in water. Chemosphere, 215, 163-172. [ Links ]
De La Rosa, A. (2010). Estudio del efecto de un novedoso proceso de desacidificación en el sabor y composición del café (tesis de maestría). Centro de Investigación en Ciencia Aplicada y Tecnología Avanzada, Instituto Politécnico Nacional, Santiago de Querétaro, México. [ Links ]
El-Messaoudi, N., El-Khomri, M., Dbik, A., Bentahar, S., Lacherai, A., & Bakiz, B. (2016). Biosorption of Congo red in a fixed-bed column from aqueous solution using jujube shell: Experimental and mathematical modeling. Journal of Environmental Chemical Engineering, 4(4), 3848-3855. [ Links ]
Fernández, M. E., Nunell, G. V., Bonelli, P. R., & Cukierman, A. L. (2014). Activated carbon developed from orange peels: Batch and dynamic competitive adsorption of basic dyes. Industrial Crops and Products, 62, 437-445. [ Links ]
Freundlich, H. (1906). Over the adsorption in solution. Journal of Physical Chemistry, 57, 387-470. [ Links ]
González-García, P. (2018). Activated carbon from lignocellulosics precursors: A review of the synthesis methods, characterization techniques and applications. Renewable and Sustainable Energy Reviews, 82, 1393-1414. [ Links ]
Gonçalves, M., Guerreiro, M., De Oliveira, L., & De Castro, C. (2013). A friendly environmental material: Iron oxide dispersed over activated carbon from coffee husk for organic pollutants removal. Journal of Environmental Management, 127, 206-211. [ Links ]
Gutiérrez, A. (2002). Café, antioxidantes y protección a la salud. Medisan, 6(4), 72-81. [ Links ]
Hameed, B. H., & El-Khaiary, M. I. (2008). Equilibrium, kinetics and mechanism of malachite green adsorption activated carbon prepared from bamboo by K2CO3 activation and subsequent gasification with CO2. Journal of Hazardous Materials, 157(2-3), 344-351. [ Links ]
Heibati, B., Rodriguez-Couto, S., Al-Ghouti, M. A., Asif, M., Tyagi, I., Agarwal, S., & Gupta, V. K. (2015). Kinetics and thermodynamics of enhanced adsorption of the dye AR 18 using activated carbons prepared from walnut and poplar woods. Journal of Molecular Liquids, 208, 99-105. [ Links ]
Jagtoyen, M., & Derbyshire, F. (1998). Activated carbons from yellow poplar and white oak by H3PO4 activation. Carbon, 36, 1085-1097. [ Links ]
Jung, K. W., Choi, B. H., Hwang, M. J., Jeong, T. U., & Ahn, K. H. (2016). Fabrication of granular activated carbons derived from spent coffee grounds by entrapment in calcium alginate beads for adsorption of acid orange 7 and methylene blue. Bioresource Technology, 219, 185-195. [ Links ]
Jung, K. W., Choi, B. H., Hwang, M. J., Choi, J. W., Lee, S. H., Chang, J. S., & Ahn, K. H. (2017). Adsorptive removal of anionic azo dye from aqueous solution using activated carbon derived from extracted coffee residues. Journal of Cleaner Production, 166, 360-368. [ Links ]
Kyzas, G. Z., Lazaridis, N. K., & Mitropoulos, A. C. (2012). Removal of dyes from aqueous solutions with untreated coffee residues as potential low-cost adsorbents: Equilibrium, reuse and thermodynamic approach. Chemical Engineering Journal, 189-190, 148-159. [ Links ]
Konicki, W., Aleksandrzak, M., & Mijowska, E. (2017). Equilibrium, kinetic and thermodynamic studies on adsorption of cationic dyes from aqueous solutions using graphene oxide. Chemical Engineering Research and Design, 123, 35-49. [ Links ]
Lafi, R., Fradj, A., Hafiane, A., & Hameed, B. H. (2014). Coffee waste as potential adsorbent for the removal of basic dyes from aqueous solution. Korean Journal of Chemical Engineering, 31(12), 2198-2206. [ Links ]
Lafi, R., & Hafiane, A. (2016). Removal of methyl orange (MO) from aqueous solution using cationic surfactants modified coffee waste (MCWs). Journal of the Taiwan Institute of Chemical Engineers, 58, 424-433. [ Links ]
Langmuir, I. (1916). The adsorption of gases on plane surfaces of glass, mica and platinum. Journal of the American Chemical Society, 40, 1361-1403. [ Links ]
Ma, X., & Ouyang, F. (2013). Adsorption properties of biomass-based activated carbon prepared with spent coffee grounds and pomelo skin by phosphoric acid activation. Applied Surface Science, 268, 566-570. [ Links ]
Murillo, Y., Giraldo, L., & Moreno, J. C. (2011). Determinación de la cinética de adsorción de 2,4-dinitrofenol en carbonizado de hueso bovino por espectrofotometría uv-vis. Revista Colombiana de Química, 40(1), 91-103. [ Links ]
Órfão, J. J. M., Silva, A. I. M., Pereira, J. C. V., Barata, S. A., Fonseca, I. M., Faria, P. C. C., & Pereira, M. F. R. (2006). Adsorption of a reactive dye on chemically modified activated carbons-influence of pH. Journal of Colloid and Interface Science, 296(2), 480-489. [ Links ]
Pavlović, M. D., Buntić, A. V., Mihajlovski, K. R., Ŝiler-Marinković, S. S., Antonović, D. G., Radovanović, Z., & Dimitrijević-Branković, S. I. (2014). Rapid cationic dye adsorption on polyphenol-extracted coffee grounds: A response surface methodology approach. Journal of the Taiwan Institute of Chemical Engineers, 45, 1691-1699. [ Links ]
Peláez, A. (2013). Alternativas de solución para el tratamiento de efluentes textiles (tesis de doctorado). Academia de Ingeniería de México, Ciudad de México, México. [ Links ]
Prahas, D., Kartika, Y., Indraswati, N., & Ismadji, S. (2008). Activated carbon from jackfruit peel waste by H3PO4 chemical activation: Pore structure and surface chemistry characterization. Chemical Engineering Journal, 140, 32-42. [ Links ]
Puerta, G. I. (2011). Composición química de una taza de café. Ciencia, Tecnología e Innovación para la Caficultura Colombiana, 414(2), 1-12. [ Links ]
Ramos, J. (2010). Estudio del proceso de biosorción de colorantes sobre cuncho de café (tesis de maestría). Universidad Nacional de Colombia, Bogotá, Colombia. [ Links ]
Rattanapan, S., Srikram, J., & Kongsune, P. (2017). Adsorption of methyl orange on coffee grounds activated carbon. Energy Procedia, 138, 949-954. [ Links ]
Tehrani, N., Aznar, J., & Kiros, Y. (2015). Coffee extract residue for production of ethanol and activated carbons. Journal of Cleaner Production, 91, 64-70. [ Links ]
Valencia-Ríos, J. S., & Castellar-Ortega, G. C. (2013). Predicción de las curvas de ruptura para la remoción de plomo (II) en disolución acuosa sobre carbón activado en una columna empacada. Revista Facultad de Ingeniería Universidad de Antioquia, 66, 141-158. [ Links ]
Wen, X., Liu, H., Zhang, L., Zhang, J., Fu, C., Shi, X., Chen, X., Mijowska, E., Chen, M. J., & Wang, D. Y. (2019). Large-scale converting waste coffee grounds into functional carbon materials as high-efficient adsorbent for organic dyes. Bioresource Technology, 272, 92-98. [ Links ]
Yakout, S., & Sharaf, G. (2016). Characterization of activated carbon prepared by phosphoric acid activation of olive stones. Arabian Journal of Chemistry, 9, 1155-1162. [ Links ]
Received: February 19, 2019; Accepted: October 01, 2019
 Este es un artículo publicado en acceso abierto bajo una licencia
Creative Commons
Este es un artículo publicado en acceso abierto bajo una licencia
Creative Commons
