


 nueva página del texto (beta)
 Inglés (pdf)
 Artículo en XML
 Referencias del artículo
 Enviar artículo por email
 Citado por SciELO
  Similares en
SciELO
Similares en
SciELO 
 Permalink
1. Introduction
Over the last years, several studies related to the brick kiln emissions have been published due to their impact on air quality and health on nearby population (Le and Oanh, 2010; Ames et al., 2012; Skinder et al., 2014; INECC, 2016) Quite the opposite and to the best of our knowledge, no research has addressed the study of adobe kiln emissions which are used by pottery artisans in many regions of developing countries. The word “adobe” is used to describe various earthen-based building materials and techniques usually referring to the sun-dried adobe brick, rammed-earth construction that is widely used in developing countries (Binici et al., 2005; Millogo et al., 2014). Adobe kilns have been used since the pre-Hispanic era in Mexico by artisans (Ruvalcaba-Sil et al., 1999), with 9749 registered pottery workshops in the country (INEGI, 2017). In the Temascalcingo municipality of the State of Mexico, pottery is an informal familial industry that represents the main activity of many towns located in urban and rural areas, most of them installed in the households’ backyards (INEGI, 2017). Although the traditional fuel in an adobe oven is firewood, due to the scarcity of this raw material and the high cost of gas and diesel, wasted tires (which are banned as a fuel in Mexico) are the most used fuel in adobe ovens, basically because they are cheap, consequently giving rise to multiple small smoky chimneys in artisans towns, similar to those observed in artisanal brick production areas (Williams, 2018). According to the Secretaría del Medio Ambiente y Recursos Naturales (Ministry of Environment and Natural Resources) of Mexico, every year more than 32 million used tires are discarded, representing on the one hand a waste problem, but on the other hand an opportunity to have a low cost fuel like that for brick kilns (INECC, 2016). Tires are mainly composed by a mixture of several rubbers strengthened with carbon black filler material, usually styrene-butadiene copolymers or styrene-butadiene copolymer/polybutadiene mixtures (62.1%), black carbon (31%), extender oil (1.9%), and other additives (4.9%) (Caponero et al., 2003). Several researchers have identified some PAHs in tires such as Flt, Phe and Pyr (Rogge et al., 1993). PAHs may have petrogenic origin when they are related with crude oil and subproducts, or pyrogenic origin when they are associated to fossil fuels or combustion processes, usually dominated by unsubstituted high molecular weight PAHs (Wang et al., 2007; González-Sepúlveda et al., 2013). Boonyatumanond et al. (2007) reported high correlations of Pyr and BghiP with tire residues, which are likely derived from extender oils used to make tires, whereas Atal et al. (1997) detected petrogenic PAHs > 178 g mol-1 (Phe, Ant, Flt, Pyr, BaP, among others) in constituents of waste tires, but due to their complicated extraction with a high uncertainty they were not quantified; however, these researchers reported that parent PAH survivability is a minor path for PAH emissions at fuel-rich conditions as is the case of adobe kilns. Waste tires are attractive products to be recycled as fuel, due to their high calorific power of 29-39 MJ kg−1 (Giere et al., 2004) which is greater compared with the 27 MJ kg−1 of carbon (Pirnie, 1991). Nevertheless, combustion processes, utility boilers and kilns using this kind of fuel should be designed and optimized in order to avoid air pollution problems (Barlaz et al., 1993; Caponero et al., 2003, 2005).
It is a well-known fact that uncontrolled burning of tires produces high emissions of pollutants, greenhouse gases, and particulate matter (PM) containing carbonaceous species such as elemental carbon (EC) (named also black carbon or soot), which increase the radiative forcing contributing to global warming, along with toxic organic species, as polycyclic aromatic hydrocarbons (PAHs) and dioxins included in the organic carbonaceous fraction (OC) of PM (DeMarini et al., 1994; Reisman et al., 1997; Lemieux et al., 2004; Downard et al., 2015). Although tire particles burn faster and hotter than similar-size coal chips and release less NOx, SO2 and CO2 than coal, they generate significantly higher PAHs and soot yields (Caponero et al., 2005). Particles and elemental carbon have been associated to lung cancer, respiratory and cardiovascular diseases (Briggs and Long, 2016).
PAHs are semi-volatile species formed via a pyrolytic process during incomplete combustion of carbonaceous materials. Source apportionment studies of these compounds have shown that domestic, gasoline and diesel vehicles and biomass burning are the major sources of PAHs (Ravindra et al., 2008; Mugica et al., 2010; Jakovljević et al., 2018). The United States Environmental Protection Agency (USEPA) selected 16 priority PAHs, among which those of higher molecular weight have been classified as carcinogenic and genotoxic, being represented by benzo[a]pyrene as a cancer risk indicator. Several researches have reported that some mutagenic and carcinogenic properties of particles are due to the presence of bonded PAHs (IARC, 1989; Garshick et al., 2004; Pope and Dockery, 2006; Amador-Muñoz et al., 2013; De Oliveira Alves et al., 2014; Mugica-Álvarez et al., 2015; Aztatzi-Aguilar, et al. 2018). Population can be exposed to PAHs inhalation in areas with multiple adobe kilns, but this is determined by the distance from the sources as well as by PM concentration. Child work from family members is common in pottery workshops, exposing children to the adobe kilns emissions. In this regard, Martínez-Salinas et al. (2010) carried out an assessment of children exposure to PAHs from different sources, finding out that highest exposures occurred in rural communities due to indoor and outdoor biomass burning followed by brick kilns manufacture, whereas Alvarado-Cruz et al. (2017) conducted a cross-sectional study of 150 schoolchildren in an industrial urbanized area and observed that increased methylation in DNA repair genes associated with environmental exposure to some PAHs and metals adsorbed in PM10, can contribute to DNA irreparable damage in that age group.
Considering the lack of information about emissions of adobe kilns, the main objective of this investigation was to determine PM10, PM2.5, carbonaceous and toxic species concentration levels, as well as the carcinogenic potential as benzo[a]pyrene equivalent (BaPeq) of a PAHs mixture in a town with multiple adobe kilns, in order to provide decision makers with reliable data to design control strategies.
2. Materials and methods
2.1 Sampling site
Santiago Coachochitlán is one of the 65 small towns of the Temascalcingo municipality located in the State of Mexico, at a medium height above sea level of 2476 m (19.8622º N and 100.034º W) where climate is predominantly temperate moist with an annual median (10th-90th percentiles) temperature of 15 ºC (7-24 ºC) and a rainfall of 700-900 mm, with the dry season lasting from October to May; median (10th-90th percentiles) relative humidity during sampling was 31 % (20-52 %). The town has 3746 inhabitants and the main economic activity is the production of clay handcrafts manufactured in adobe kilns, which mostly use scrap tires as fuel since there is no strict control for this use. The town has around 425 pottery workshops on a surface less than 10 km2, as is shown in Figure 1, being the main source of pollutant emissions to the atmosphere since this community does not have any other type of industry. Additionally, its vehicular park is not significant, since in the whole Temascalcingo municipality the vehicular fleet reported in 2017 was 14 103 vehicles; then, the town has less than 500 vehicles. Other registered economic activities are some tortillerias, butchers, small shops and one chicken rotisseries (INEGI, 2017).

2.2 PM 10 and PM 2.5 mass concentration determinations
Integrated 24 h PM10 and PM2.5 samples were collected during two weeks from April 22 to May 5, 2017 with four low volume samplers (AirMetrics and Eugene Oregon), two for PM10 and two for PM2.5, calibrated at 5 L min-1. In order to have a comparison, the first sampling corresponded to the Easter week, considered low activity (LA), since children are on holidays and most kilns were inactive, whereas during the second week the adobe kilns displayed normal activity (NA), maintained even during weekends. PM10 and PM2.5 were collected in quartz filters (Whatman, 47 mm) previously calcined at 800 ºC for 8 h and stabilized during 24 h at 24 ºC and 25 % relative humidity.
Daily temperature, relative humidity, velocity and direction wind data within the sampling period were used to evaluate the variations due to environmental conditions related to each day of sampler.
Particle concentrations were obtained by gravimetry using an analytical balance (Mettler Toledo MT5, Max. 5.1 g, d=1 µg) divided by the total volume of air. The results are reported as concentration in μg m−3 for an average 24 h.
2.3 Organic and elemental carbon measurements.
Quantification of elemental (EC) and organic carbon (OC) was performed with a thermo-optic analyzer (Sunset Lab) according to TOT-NIOSH method (Birch and Cary, 1996); briefly, the filter samples were analyzed in two stages: in the first the temperature reached 650 ºC without oxygen for OC quantification, and during the second stage temperature was raised to 800 ºC in order to oxidize the remaining carbon and determine the EC concentration.
2.4 Evaluation of analytical method efficiency
The analytical method efficiency was determined through the recovery percent of each compound (% Rec). The analysis was performed to four filters, two of PM10 and two of PM2.5, with an added mass of 150 ng (Table I). The recovery percentages varied from 67 ± 6 for Bb + kF to 115 ± 6 for BaA, which are according to TO-13A protocol (USEPA, 1999).
Table I Polycyclic aromatic hydrocarbons and recovery percentages (mean ± standard deviation).
| PAH | ID | Target ion m/z | Selected ions m/z | RT min | Recovery % | |
| 1 | Naphthalene | Nap | 128 | 128,129,64 | 5.69 | 82 ± 2 |
| 2 | 2-Methylnaphthalene | 2-MNap | 142 | 142,143,71 | 7.11 | 80 ± 3 |
| 3 | Acenaphthylene | Acy | 152 | 152,153,76 | 9.75 | 80 ± 4 |
| 4 | Acenaphtene | Ace | 154 | 154,153,76 | 10.44 | 86 ± 3 |
| 5 | Fluorene | Fne | 166 | 166,165,82 | 12.33 | 86 ± 5 |
| 6 | Phenanthrene | Phe | 178 | 178,179,89 | 16.21 | 82 ± 6 |
| 7 | Anthracene | Ant | 178 | 178,179,89 | 16.41 | 98 ± 5 |
| 8 | Fluoranthene | Flt | 202 | 202,203,101 | 21.52 | 77 ± 6 |
| 9 | Pyrene | Pyr | 202 | 202,203,101 | 22.45 | 72 ± 4 |
| 10 | Benzo[a]anthracene | BaA | 228 | 226,229,114 | 28.11 | 115 ± 6 |
| 11 | Chrysene | Chr | 228 | 226,229,114 | 28.28 | 97 ± 3 |
| 12,13 | Benzo[b+k]fluoranthene | Bb+kF | 252 | 252,253,126 | 32.80 | 67 ± 6 |
| 14 | Benzo[a]pyrene | BaP | 252 | 252,253,126 | 34.02 | 78 ± 2 |
| 15 | Perylene | Per | 252 | 252,253,126 | 34.36 | 80 ± 6 |
| 16 | Indeno[1,2,3-cd]pyrene | I123cdP | 276 | 276,277,138 | 38.13 | 84 ± 7 |
| 17 | Dibenzo[a,h]anthracene | DBahA | 278 | 278,279,139 | 38.33 | 107 ± 3 |
| 18 | Benzo[ghi]perylene | BghiP | 276 | 276,277,138 | 38.92 | 81 ± 2 |
PAH: polycyclic aromatic hydrocarbon.
2.5 Organic compound extractions
Filters with particles were fortified with 11 deuterated PAHs (Table II) (98-99.9 % purity, Chem Service and Ultra Scientific, USA). The organic compounds were extracted ultrasonically (Branson 2510) with 10 mL of dichloromethane (HPLC grade, Burdick Jackson) according to the methodology published by Valle-Hernández et al. (2010).
Table II Deuterated polycyclic aromatic hydrocarbons. Target and secondary ions.
| PAH-d | ID | Target ion m/z | Selected ions m/z | RT min | Added mass ng | |
| 1 | Naphthalene-d8 | Nap-d8 | 136 | 136,137,108 | 5.61 | 75.0 |
| 2 | Acenaphtene-d10 | Ace-d10 | 164 | 164,165,160 | 10.35 | 75.2 |
| 3 | Phenanthrene-d10 | Phe-d10 | 188 | 188,189,94 | 16.15 | 75.2 |
| 4 | Fluoranthene-d10 | Flt-d10 | 212 | 212,213,106 | 21.45 | 75.0 |
| 5 | Pyrene-d10 | Pyr-d10 | 212 | 212,213,106 | 22.39 | 75.0 |
| 6 | Benzo[a]anthracene-d12 | BaA-d12 | 240 | 240,241,120 | 28.01 | 150.0 |
| 7 | Chrysene-d12 | Chr-d12 | 240 | 240,241,120 | 28.17 | 75.2 |
| 8 | Benzo[b]fluoranthene-d12 | BbF-d12 | 264 | 264,265,132 | 32.71 | 150.0 |
| 9 | Benzo[a]pyrene-d12 | BaP-d12 | 264 | 264,265,132 | 33.94 | 150.0 |
| 10 | Perylene-d12 | Per-d12 | 264 | 264,265,132 | 34.27 | 75.2 |
| 11 | Benzo[ghi]perylene-d12 | BghiP-d12 | 288 | 288,289,144 | 38.85 | 150.0 |
PAH-d: deuterated polycyclic aromatic hydrocarbon.
2.6 Analysis and quantification of polycyclic aromatic hydrocarbons
PAHs were identified and analyzed through GC/MS (GC model HP 6890, MS model 5973, GC-MS), with a 30 m, 0.25 mm diameter HP5 capillary column and 0.25 µm thickness stationary phase. Ultrapure helium (99.999%, Praxair) with a 1.2 mL min−1 flow was the carrier gas. One µL was injected in splitless mode at 300 ºC. The applied temperature program started at 40 ºC for 1 min, followed by a heating ramp of 50 ºC min−1 till 120 ºC remaining for 1 min during the first heating ramp; then 5 ºC min−1 till 305 ºC remaining for 1 min in the second ramp, and finally 20 ºC min−1 till 330 ºC during 10 min. Operating conditions of GC-MS for PAHs analysis were previously stablished by Amador-Muñoz et al. (2011). Eighteen PAHs were quantified by isotopic dilution; those without their deuterated homologous were quantified with the immediate previous deuterated compound. Filter blanks were included and treated the same as the samples. The blanks’ analysis indicated that no compound of interest was present.
2.7 Toxic and mutagenic equivalence of PAHs
Toxic equivalence factors (TEF) estimated by Nisbet and Lagoy (1992) and mutagenic equivalence factors (MEF) proposed by Durant et al. (1996) were multiplied by the obtained concentrations of each PAH in order to determine the toxic and mutagenic equivalences related to BaP (BaP-TEQ and BaP-MEQ, respectively), which represent the carcinogenic and mutagenic potential or the airborne mixture.
2.8 Statistical analyses
STATISTICA v. 10 (Statsoft, OK, USA) software was used for statistical analyses. Non-parametric U-Mann-Whitney test was applied to compare medians of different measured parameters. Spearman coefficient was applied to assess the association between PAHs and particles, carbonaceous species, and some meteorological parameters like relative humidity, temperature and wind velocity.
3. Results and discussion
3.1 Particle concentrations
Figure 2 shows the variation of PM10 and PM2.5 concentrations during the two sampling periods (low activity [LA] and normal activity [NA]). Most weeks in the year have normal activity, whereas low activity lasts only five weeks corresponding to vacation periods (Holly and Eastern weeks, Independence week in September, All Saints’ Day in November, Christmas week and New Year week). The variation between both periods is due to the fact that artisan community operates in different modes: during NA artisans work daily, whereas during LA the kiln operations are carried out every three or four days. Medians and percentiles (10th and 90th) of PM10 concentrations were 66 (50-80) µg m-3 and 196 (77-290) µg m-3 for LA and NA, respectively; and for PM2.5 42 (33-57) µg m-3 and 108 (37-177) µg m-3 for low and normal activity, respectively. During the first period of LA of adobe kilns, PM10 and PM2.5 concentrations were within the limits established by the Official Mexican Standard NOM-025-SSA1-2014 (SSA, 2014) of 75 and 45 µg m-3, respectively , but not the WHO standards of 50 and 25 µg m-3, respectively, which were exceeded all days. In the case of the second period of NA, the PM10 standard was exceeded all days, and the PM2.5 standard half of days; consequently, the WHO standards were exceeded all days in both sizes. Mexican Standard exceedances of PM concentrations were up to three times some days, and the medians exceeded the standards around twice, consequently having a high negative effect in the town air quality. Other researchers also observed that ceramic industry has a significant impact on air quality, due to the high emissions of atmospheric particles generated in combustion processes (Querol et al., 2001). In addition to the use of tires as fuel in the study area, particles emitted by the ceramic production also affect visibility, since during activity smoke columns are observed in the kilns. Other studies have reported high emissions due to tires burning, as was the case in Iowa, USA, where hundreds of shredded tires in a landfill burned uncontrollably increasing the ambient air PM2.5 concentrations to 70 µg m-3, although concentrations 1 km away from the sources were as high as 2 mg m-3 (Downard et al., 2015).
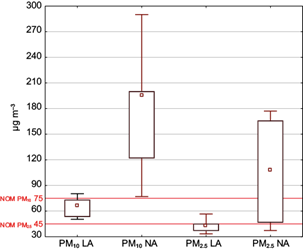
Fig. 2 PM10 and PM2.5 (µg m-3). Boxes: 25th-75th percentiles, bars: 10th-90th percentiles (medians). LA: low activity, NA: normal activity. Red lines correspond to Mexican standards.
Significant differences (p < 0.05) were found between the median of particles in LA and NA periods. Figure 3 shows the wind roses of sampling days in the two periods of activity. It can be observed that although the winds come from several directions, the prevailing direction of winds was southwest, with speeds lower than 4 m s-1. These relatively low speeds can contribute to create a relative atmospheric stability and combined with low temperatures (5-9 ºC) the pollutant dispersion is minimum. Therefore, the difference in particle concentrations (both PM10 and PM2.5) is due to the number of kilns operating in each activity period, and not to the climatic conditions, since no correlations were observed between particles and temperature or wind speed (p > 0.05).

Significant differences were only observed between PM10 and PM2.5 concentrations during the LA period (p < 0.05), since other sources such as dust resuspension or vehicles can contribute to PM10 presence. In opposite, during the NA period no significant differences were found between PM10 and PM2.5 concentrations (p > 0.05), thus suggesting the same origin source for both particle sizes related to the combustion of tires (PM2.5) in adobe kilns, which increased significantly during this period since there is no other significant combustion source in the studied area.
3.2 Carbonaceous species concentrations
Table III displays the descriptive statistics of PM, organic and elemental carbon concentrations, as well as those of quantified PAHs. OC was a major component of both PM sizes, accounting for 34% (31-35%) and 47% (37-52%) of PM10 during low and normal activity of adobe kilns, respectively, and for 42% (31-52%) and 54% (52-61%) of PM2.5, for the same periods. These contributions are within the 22-58 % range reported by Chow et al. (2011) for OC emissions from burned tires. The OC contribution to the total mass of particles was lower during the artisans’ low activity period than during the normal activity period, suggesting that in the latter the combustion source becomes most important. Indeed, these results are of concern since the toxicity of carbonaceous particles is more clearly associated to the organic fraction than to the elemental one (Kocbach et al., 2006). Nevertheless, OC concentrations of PM10 and PM2.5 had no significant differences between them (p > 0.05) in any activity period.
Table III Descriptive statistics of PM, OC, EC and PAHs.
| PM10 | PM2.5 | |||||||||||||||
| Low activity | Normal activity | Low activity | Normal activity | |||||||||||||
| N | Median | P10 | P90 | N | Median | P10 | P90 | N | Median | P10 | P90 | N | Median | P10 | P90 | |
| µg m-3 | ||||||||||||||||
| PM | 7 | 66.2 | 50.4 | 80.4 | 6 | 195.9 | 77.1 | 290.1 | 7 | 42.4 | 33.3 | 56.5 | 6 | 107.8 | 37.3 | 177.1 |
| OC | 7 | 22.5 | 13.8 | 27.4 | 6 | 87.8 | 36.0 | 93.2 | 7 | 17.7 | 10.5 | 23.6 | 6 | 62.9 | 20.2 | 90.0 |
| EC | 7 | 5.0 | 4.0 | 6.1 | 6 | 34.0 | 14.1 | 80.4 | 7 | 5.3 | 0.9 | 10.6 | 6 | 35.7 | 13.3 | 64.5 |
| ng m-3 | ||||||||||||||||
| Nap | 7 | 0.8 | 0.3 | 1.8 | 6 | 0.9 | 0.4 | 1.6 | 7 | 0.5 | 0.2 | 1.1 | 6 | 0.7 | 0.3 | 1.0 |
| 2-MNap | 6 | 0.2 | 0.1 | 0.4 | 6 | 0.2 | 0.1 | 0.5 | 7 | 0.2 | 0.1 | 0.4 | 6 | 0.2 | 0.1 | 0.4 |
| Acy | 7 | 0.2 | 0.1 | 0.3 | 6 | 0.2 | 0.2 | 0.8 | 7 | 0.2 | 0.0 | 0.2 | 5 | 0.2 | 0.1 | 0.3 |
| Fne | 7 | 0.2 | 0.1 | 0.4 | 6 | 0.2 | 0.1 | 0.7 | 7 | 0.1 | 0.0 | 0.2 | 5 | 0.2 | 0.1 | 0.4 |
| Phe | 7 | 2.2 | 1.7 | 4.2 | 6 | 3.5 | 2.9 | 15.8 | 7 | 1.6 | 0.7 | 3.3 | 6 | 2.9 | 1.3 | 15.0 |
| Ant | 7 | 0.2 | 0.0 | 0.6 | 6 | 0.4 | 0.2 | 2.4 | 6 | 0.2 | 0.1 | 0.4 | 6 | 0.4 | 0.2 | 1.3 |
| Flt | 7 | 8.4 | 4.3 | 13.6 | 6 | 16.4 | 11.9 | 59.8 | 7 | 6.4 | 2.5 | 11.2 | 6 | 13.1 | 6.3 | 28.9 |
| Pyr | 7 | 7.7 | 3.3 | 14.1 | 6 | 17.9 | 8.4 | 62.6 | 7 | 7.1 | 2.2 | 10.7 | 6 | 13.5 | 6.3 | 30.2 |
| Ret | 6 | 0.5 | 0.1 | 0.7 | 6 | 0.4 | 0.1 | 1.1 | 6 | 0.3 | 0.1 | 1.1 | 6 | 0.2 | 0.0 | 0.4 |
| BaA | 7 | 3.2 | 0.6 | 4.8 | 6 | 7.2 | 4.6 | 23.7 | 7 | 2.0 | 1.2 | 3.9 | 6 | 5.3 | 2.9 | 11.4 |
| Chr | 7 | 3.9 | 1.5 | 6.9 | 6 | 9.8 | 6.6 | 34.0 | 7 | 3.3 | 2.3 | 5.4 | 6 | 7.1 | 4.3 | 15.7 |
| Bb+kF | 7 | 11.3 | 6.3 | 14.1 | 6 | 23.5 | 14.2 | 61.7 | 7 | 9.0 | 6.7 | 11.3 | 6 | 16.3 | 10.9 | 29.6 |
| BaP | 7 | 6.5 | 3.1 | 11.4 | 6 | 15.9 | 10.4 | 59.1 | 7 | 6.0 | 3.0 | 10.7 | 6 | 12.2 | 9.1 | 23.4 |
| I123cdP | 7 | 12.8 | 3.9 | 17.2 | 6 | 29.0 | 19.6 | 80.0 | 7 | 13.8 | 6.1 | 16.6 | 6 | 14.8 | 9.6 | 37.1 |
| DBahA | 6 | 1.6 | 0.6 | 1.9 | 6 | 3.1 | 0.8 | 10.3 | 6 | 1.7 | 0.4 | 2.4 | 5 | 2.6 | 0.4 | 4.2 |
| BghiP | 7 | 8.9 | 4.6 | 11.2 | 6 | 16.8 | 10.6 | 46.3 | 7 | 7.5 | 3.8 | 9.4 | 6 | 11.5 | 8.8 | 21.6 |
| ∑PAHcarc. | 7 | 35.4 | 19.5 | 55.9 | 6 | 91.8 | 56.7 | 268.8 | 7 | 36.2 | 19.3 | 48.1 | 6 | 62.4 | 38.3 | 121.4 |
| ∑PAHtot. | 7 | 67.1 | 37.4 | 99.7 | 6 | 157.6 | 96.9 | 459.7 | 7 | 61.0 | 29.0 | 79.8 | 6 | 110.4 | 63.2 | 211.1 |
PM: particulate matter; OC: carbonaceous fraction of PM; EC: elemental carbon; PAHs: polycyclic aromatic hydrocarbons.
This behavior was also observed for EC concentrations that did not present significant differences (p > 0.05) between PM10 and PM2.5 in both activity periods, indicating that OC and EC are mainly in the fine fraction. EC contributed from 8-18 and 12-36% of PM10 and PM2.5, respectively, during low and normal activity periods. EC percentages were lower than the 29-61% reported by Chow et al. (2011) for PM2.5 from tires burning, but greater than the 8% reported by Downard et al. (2015). This can be explained by different combustion conditions, since higher temperatures are reached during more time in adobe kilns than during an uncontrolled fire.
3.3 Polycyclic aromatic hydrocarbon concentrations
No significant differences were found between PAHs in PM10 and PM2.5 (p > 0.05), meaning that PAHs from combustion sources are majorly found in the fine fraction. As can be observed in Table III, PAHs are largely in the fine fraction, 90% during LA and 70% during NA. Heavier PAHs concentrations (> 206 g mol-1) in the two PM sizes were around twice during NA than in LA. Among the PAHs of special concern are those classified as carcinogenic by the International Agency for Research on Cancer (IARC) (BaA, Chr, Bb+kF, BaP, I123cdP, and DBahA), which correspond to those with higher molecular weight (except for BghiP); Figure 4 presents the comparison of the sum of total PAHs with the sum of carcinogenic PAHs in PM10 and PM2.5 during both activity periods. Carcinogenic PAHs accounted for 53 and 58% of the total PAHs in PM10 through the low and normal adobe kiln activity periods, respectively, whereas carcinogenic PAHs contributed with 59 and 57% of the total sum of PAHs in PM2.5 in the same periods. These carcinogenic PAHs have also been determined in studies related to tires burning, contributing with more than 50% of the total analyzed PAHs (Lemieux et al., 2004; Lönnermark and Blomqvist, 2005). However, most of three-ring PAHs can occur in the gaseous phase, so that their concentrations associated with PM should be compared carefully.
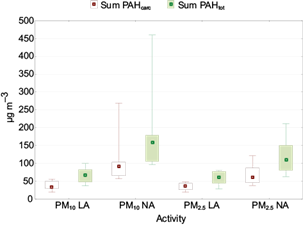
Fig. 4 Medians of the sum of total PAHs (PAHtot) and carcinogenic PAHs (PAHcarc). Boxes: 25th-75th percentiles; bars: 10th-90th percentiles. LA: low activity, NA: normal activity. ƩPAHcarcinogenic: BaA, Chr, Bb+kF, BaP, I123cdP and DBahA.
Naphthalene was the most abundant PAH within the lighter compounds (two and three rings), whereas fluoranthene and pyrene, having four rings, were the most abundant non mutagenic PAHs. Carcinogenic PAHs I123cdP, Bb+kF, and BaP, presented the greater concentrations during the normal activity of adobe kilns as shown in Figure 5.
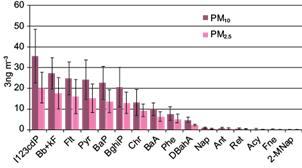
Fig. 5 Average PAHs abundance and standard deviations in PM10 and PM2.5 during normal activity of adobe kilns.
The high concentrations of carcinogenic compounds represent an important risk for population, since the median concentrations in this study are more than 10 times higher than those medians reported in Mexico City (Amador-Muñoz et al., 2009; Mugica et al., 2010), as well as those reported during sugarcane harvesting in the state of Morelos (Mugica-Álvarez et al., 2015); for instance, BaP concentrations in PM10 in Mexico City and Morelos were 0.5 ng m-3, while in the present study they were 9.5 ng m-3. In addition, as was mentioned above, more PAHs in the fine fraction can penetrate into the deepest part of the lungs and even enter the bloodstream through the alveoli, causing a deeper damage (Pope and Dockery, 2006). Santiago Coachochitlán has some low elevations of volcanic relief with moderate slopes and some hills, so particulate matter and PAH concentrations may even be greater in the cold dry season when temperatures are lower at dawn by possible thermal inversions or stable conditions. Hence, PM monitoring would be convenient during that season to determine the population exposure (IPOMEX, 2015).
3.4 PAHs diagnostic ratios
Several researchers have estimated diagnostic ratios for some PAHs emission sources (Grimmer et al., 1983; Sicre et al., 1987; Khalili et al., 1995; Pandey et al., 1999; Ravindra et al., 2006; Rajput et al., 2011; Li et al., 2016). Table IV presents some of those ratios as well as the obtained ratios in this study, where it is possible to observe that no source reported previously corresponds to the PAH ratios found on the site.
Table IV Diagnostic PAHs ratios (mean ± SD, in this study) from some combustion sources in different studies.
| Molecular diagnostic ratios | Vehicular emission | Coal combustion | Industry | Biomass combustion | PM10h | PM2.5h | |||||||||||
| LA | NA | LA | NA | ||||||||||||||
| 1 | [Flt]/([Pyr]+[Flt]) | 0.35-0.39a | 0.69e | 0.46-0.49g | 0.52 | ± | 0.04 | 0.52 | ± | 0.07 | 0.49 | ± | 0.03 | 0.52 | ± | 0.04 | |
| 2 | [BaA]/([BaA]+[Chr]) | 0.55c | 0.38 | ± | 0.06 | 0.43 | ± | 0.06 | 0.38 | ± | 0.03 | 0.41 | ± | 0.02 | |||
| 3 | [BaA]/[Chr] | 0.53e | 0.61 | ± | 0.14 | 0.76 | ± | 0.21 | 0.61 | ± | 0.08 | 0.70 | ± | 0.06 | |||
| 4 | [I123cdP]/[BghiP] | 1.34e | 0.82-1.06f,g | 1.61 | ± | 0.60 | 1.75 | ± | 0.12 | 1.79 | ± | 0.20 | 1.49 | ± | 0.38 | ||
| 5 | [I123cdP]/([I123cdP]+[BghiP]) | 0.56d, 0.53e | 0.45-0.51f,g | 0.60 | ± | 0.11 | 0.64 | ± | 0.02 | 0.64 | ± | 0.03 | 0.59 | ± | 0.07 | ||
| 6 | [BaA]/[BghiP] | 2.46e | 0.74-2.5f | 0.34 | ± | 0.13 | 0.46 | ± | 0.12 | 0.33 | ± | 0.07 | 0.46 | ± | 0.14 | ||
| 7 | [Pyr]/[BaP] | 3.96e | 1.32 | ± | 0.50 | 1.09 | ± | 0.38 | 1.07 | ± | 0.22 | 1.05 | ± | 0.25 | |||
| 8 | [BaA]/[BaP] | 2.46e | 1.2-3.19f | 0.47 | ± | 0.21 | 0.45 | ± | 0.14 | 0.38 | ± | 0.06 | 0.44 | ± | 0.10 | ||
| 9 | [BaP]/([BaP]+[Chr]) | 0.36-0.46a | 0.33e | 0.12-0.38f | 0.59 | ± | 0.12 | 0.63 | ± | 0.05 | 0.61 | ± | 0.04 | 0.62 | ± | 0.06 | |
| 10 | [BaP]/[BghiP] | 0.56b | 0.27-0.64g | 0.80 | ± | 0.29 | 1.06 | ± | 0.30 | 0.87 | ± | 0.17 | 1.04 | ± | 0.11 | ||
| 11 | [Flt]/[Pyr] | 0.84-0.97g | 1.08 | ± | 0.16 | 1.13 | ± | 0.36 | 0.95 | ± | 0.10 | 1.10 | ± | 0.21 | |||
| 12 | [BbF+BkF]/[BghiP] | 7.1-11.2c | 1.37 | ± | 0.28 | 1.32 | ± | 0.14 | 1.34 | ± | 0.21 | 1.34 | ± | 0.16 | |||
| 13 | [Phe]/([Phe]+[Ant]) | 0.6a | 0.91 | ± | 0.03 | 0.90 | ± | 0.02 | 0.92 | ± | 0.04 | 0.90 | ± | 0.02 | |||
a Khalili et al. (1995), bPandey et al. (1999), cSicre et al. (1987), dGrimmer et al. (1983), Ravindra et al. (2006), eLi et al. (2016), fLi et al. (2018), gRajput et al. (2011), hthis study.
PAHs: polycyclic aromatic hydrocarbons; LA: low activity; NA: normal activity.
The means of obtained PAHs ratios of PM10 and PM2.5 from tires combustion emission during the two activity periods were not meaningfully different (p > 0.05), indicating that it could be adequate to diagnose the contribution of tires combustion sources in adobe kilns (Table IV), since there are no other significant emission sources in the site. However, some of the obtained ratios showed high standard deviations (> 20%), since certain PAHs can be unstable and reactive, indicating that some ratios are not robust enough to be considered as good markers for tire combustion.
Table V displays the diagnostic ratios that presented relative standard deviation (RSD) less than 15%, by activity period and particle size. PAHs ratios are useful to differentiate petrogenic or pyrogenic PAHs. Petrogenic are associated usually to PAHs such as Nap, Flu, Phe and Cry, whereas pyrogenic PAHs are dominated by unsubstituted high molecular weight PAHs with abundant Flt and Pyr (Wang et al., 2007; González-Sepúlveda et al., 2013). [Flt]/([Pyr]+[Flt]) ratio > 0.5 indicate pyrogenic sources although ratios < 0.5 have been found for vehicular emissions, while [I123cdP]/([I123cdP]+[BghiP]) ratios with values between (0.20-0.50) correlate mostly with petrogenic origin (i.e., unburned or leaked fuel and oil, road asphalt, and tire particles), but [BaA]/([BaA] + [Chr]) > 0.35 is attributed to pyrogenic sources (Nguyen et al., 2014); additionally, the high content of unsubstituted high molecular weight PAHs corroborates that pyrogenic emissions were dominant in this study (Mille et al., 2007).
When ratios of the two particle sizes are included (since there were not significant differences, p > 0.05), RSD is ≤ 10%, they can be considered robust rates and proposed as new diagnostic PAHs rates for tire combustion emissions, which is the main combustion source (last column in Table V).
Table V PAHs ratios emitted by tire combustion in adobe kilns.
| PAHs ratios | PM10 | PM2.5 | PM10 and PM2.5 (N=26) | |||||||
| LA (N=7) | NA (N=6) | LA (N=7) | NA (N=6) | |||||||
| Mean ± SD | % RSD | Mean ± SD | % RSD | Mean ± SD | % RSD | Mean ± SD | % RSD | Mean ± SD | % RSD | |
| 1 [Flt])/([Pyr]+[Flt]) | 0.52 ± 0.04 | 7 | 0.52 ± 0.07 | 13 | 0.49 ± 0.03 | 5 | 0.52 ± 0.04 | 9 | 0.51 ± 0.04 | 9 |
| 2 [BaA]/([BaA]+[Chr]) | 0.38 ± 0.06 | 15 | 0.43 ± 0.06 | 13 | 0.38 ± 0.03 | 8 | 0.41 ± 0.02 | 5 | 0.40 ± 0.05 | 11 |
| 3 [I123cdP]/([I123cdP]+[BghiP]) | 0.60 ± 0.11 | 19 | 0.64 ± 0.02 | 2 | 0.64 ± 0.03 | 4 | 0.59 ± 0.07 | 11 | 0.62 ± 0.07 | 12 |
| 4 [BaP]/([BaP]+[Chr]) | 0.59 ± 0.12 | 20 | 0.63 ± 0.05 | 8 | 0.61 ± 0.04 | 7 | 0.62 ± 0.06 | 10 | 0.61 ± 0.07 | 11 |
| 5 [Phe]/([Phe]+[Ant]) | 0.91 ± 0.03 | 4 | 0.90 ± 0.02 | 2 | 0.92 ± 0.04 | 4 | 0.90 ± 0.02 | 2 | 0.91 ± 0.03 | 4 |
PAHs: polycyclic aromatic hydrocarbons
3.5 Carcinogenic and mutagenic potential
The carcinogenic potential or PAHs toxicity mixture can be expressed as the toxic equivalence (TEQ) through the use of toxic equivalence factors (TEF) that express the toxicity of each PAH in terms of the most toxic form of these compounds, the BaP (Nisbet and Lagoy, 1992). In the estimation of mutagenic potential, mutagenic equivalence factors (MEF) were used (Durant et al., 1996). Table VI displays the TEQ and MEQ of the quantified PAHs in particles of both sizes and sampling periods. The greatest contribution to BaP-TEQ and BaP-MEQ was in all cases BaP with 15.9 ng m-3 for PM10 and 12.2 ng m-3 for PM2.5 during NA, contributing with 63 and 65% to BaP-TEQ of PM10 and PM2.5, respectively, and with 54 and 60% to BaP-MEQ of PM10 and PM2.5, respectively. The European Parliament and the Council of the European Union (DIRECTIVE 2004/107/EC) set a BaP-TEQ maximum value of 1 ng m-3 in PM10 as annual average to reduce the population risk, whereas the recommended value in the United Kingdom is 0.25 ng m-3 in PM10. It is concerning to observe that PAHs concentrations are high even during the LA of kilns and consequently carcinogenic and mutagenic potency are also high, suggesting that PAHs remain in fine particles in the atmosphere. Certainly, it should be a matter of earnest directives that in this town the standard is exceeded more than 25 times during the NA period and more than 10 times during LA activity of adobe kilns.
Table VI Carcinogenic and mutagenic potentials (BaP-TEQ and BaP-MEQ) estimated from the medians of PAHs in PM10 and PM2.5.
| PAH | TEF | MEF | BaP-TEQ [ng m-3] | BaP-MEQ [ng m-3] | |||||||
| PM10 | PM2.5 | PM10 | PM2.5 | ||||||||
| Low | Normal | Low | Normal | Low | Normal | Low | Normal | ||||
| 1 | Nap | 0.001 | NR | 0.0008 | 0.0009 | 0.0005 | 0.0007 | NR | NR | NR | NR |
| 2 | Acy | 0.001 | 0.0006 | 0.0002 | 0.0002 | 0.0002 | 0.0002 | 0.0001 | 0.0001 | 0.0001 | 0.0001 |
| 3 | Fne | 0.001 | NR | 0.0002 | 0.0002 | 0.0001 | 0.0002 | NR | NR | NR | NR |
| 4 | Phe | 0.001 | NR | 0.0022 | 0.0035 | 0.0016 | 0.0029 | NR | NR | NR | NR |
| 5 | Ant | 0.01 | NR | 0.0020 | 0.0040 | 0.0020 | 0.0040 | NR | NR | NR | NR |
| 6 | Flt | 0.001 | NR | 0.0084 | 0.0164 | 0.0064 | 0.0131 | NR | NR | NR | NR |
| 7 | Pyr | 0.001 | NR | 0.0077 | 0.0179 | 0.0071 | 0.0135 | NR | NR | NR | NR |
| 8 | BaA | 0.1 | 0.082 | 0.3200 | 0.7200 | 0.2000 | 0.5300 | 0.2624 | 0.5904 | 0.1640 | 0.4346 |
| 9 | Chr | 0.01 | 0.017 | 0.0390 | 0.0980 | 0.0330 | 0.0710 | 0.0663 | 0.1666 | 0.0561 | 0.1207 |
| 10 | Bb+kF | 0.1 | NR | 1.1300 | 2.3500 | 0.9000 | 1.6300 | NR | NR | NR | NR |
| 13 | BaP | 1 | 1 | 6.5000 | 15.9000 | 6.0000 | 12.2000 | 6.5000 | 15.9000 | 6.0000 | 12.2000 |
| 14 | DBahA | 1 | 0.29 | 1.6000 | 3.1000 | 1.7000 | 2.6000 | 0.4640 | 0.8990 | 0.4930 | 0.7540 |
| 16 | I123cdP | 0.1 | 0.31 | 1.2800 | 2.9000 | 1.3800 | 1.4800 | 3.9680 | 8.9900 | 4.2780 | 4.5880 |
| 17 | BghiP | 0.01 | 0.19 | 0.0890 | 0.1680 | 0.0750 | 0.1150 | 1.6910 | 3.1920 | 1.4250 | 2.1850 |
| Total BaP-TEQ and BaP-MEQ | 10.980 | 25.279 | 10.306 | 18.661 | 12.952 | 29.738 | 12.416 | 20.282 | |||
TEF: toxic equivalence factor (Nisbet and Lagoy, 1992); MEF: mutagenic equivalence factor (Durant et al., 1996).
The high BaP-TEQ estimated values from 11 to 25 ng m-3 indicate that particles emitted during tires burning in adobe kilns could be highly hazardous as was reported by Lemieux et al. (2004), who found that the uncontrolled burning of tires results in extremely high mutagenic particle emissions, representing a high risk for the population. The BaP-TEQ of this study are from 10 to 50 times higher than those reported for PM10 in sites with frequent agricultural burning (Mugica-Alvarez et al., 2015; Pongpiachan et al., 2017), and are greater than those reported for PM10 in sites with high vehicular traffic such as Florence and Venice, Italy, with annual means of 2.6 and 1.9 ng m-3, respectively (Masiol et al., 2012), Augsburg, Germany with 3.27 ng m-3 (Schnelle et al., 2005), and Copenhagen, Denmark with 6.9 ng m-3, and only comparable with Guangzhou city in China, which reported BaP-TEQs up to 25.44 ng m-3 (Bi et al., 2005).
The presence of extremely high mutagenic and carcinogenic compounds in particles shows that inhabitants of this little town are in high risk due to exposure of multiple emissions from scrap tires burning in adobe kilns. Therefore, the most important strategy to achieve reductions would be to replace to less pollutant fuels, or changes in oven technology such as the inclusion of high temperature ceramic filters which have shown reduction of particles and PAHs among 60 to 90% (Caponero et al., 2004)in the form of waste tire chips (1 cm in size. This is a complex issue since cultural and economic facets at local level make very difficult implementation of any change; so, education programs would be necessary to explain people the benefits in health and quality life of modifications in their habits and in ancestral ovens.
3.6 Relationships between species
Table VII displays the Spearman correlation between PM, carbonaceous species and individual PAHs. OC and EC have high correlations with PM, as well as with most PAHs with higher molecular weight; exceptions are the lighter PAHs of two and three rings (Nap, 2-MNap, Acy, Fne, and Ant). The meaningful correlation between PM and individual PAHs with equal or more than four rings suggests that their emitting sources could be the same, namely, more than 400 clay ovens in the area. The relationships between meteorological parameters (wind speed, temperature, and relative humidity) and measured pollutants did not show statistically significant correlation (p > 0.05).
Table VII Spearman correlation between different species.
| PM | OC | EC | Nap | 2-MNap | Acy | Fne | Phe | Ant | Flt | Pyr | Ret | BaA | Cht | Bb+ kf | Bap | I123cdP | DBahA | BghiP | Sum PAHcarc | Sum PAHtot | |
| PM | 1.00 | ||||||||||||||||||||
| OC | 0.97 | 1.00 | |||||||||||||||||||
| EC | 0.85 | 0.91 | 1.00 | ||||||||||||||||||
| Nap | 0.34 | 0.31 | 0.10 | 1.00 | |||||||||||||||||
| 2-MNap | 0.33 | 0.25 | 0.24 | 0.52 | 1.00 | ||||||||||||||||
| Acy | 0.65 | 0.54 | 0.43 | 0.30 | 0.19 | 1.00 | |||||||||||||||
| Fne | 0.20 | 0.13 | 0.30 | 0.00 | 0.17 | 0.54 | 1.00 | ||||||||||||||
| Phe | 0.67 | 0.65 | 0.57 | 0.46 | 0.32 | 0.73 | 0.31 | 1.00 | |||||||||||||
| Ant | 0.57 | 0.57 | 0.53 | 0.32 | 0.33 | 0.64 | 0.29 | 0.92 | 1.00 | ||||||||||||
| Flt | 0.71 | 0.71 | 0.68 | 0.41 | 0.45 | 0.55 | 0.16 | 0.86 | 0.88 | 1.00 | |||||||||||
| Pyr | 0.61 | 0.61 | 0.57 | 0.41 | 0.38 | 0.49 | 0.23 | 0.77 | 0.85 | 0.95 | 1.00 | ||||||||||
| Ret | 0.13 | 0.05 | 0.10 | 0.12 | 0.02 | 0.66 | 0.68 | 0.27 | 0.33 | 0.28 | 0.47 | 1.00 | |||||||||
| BaA | 0.71 | 0.70 | 0.64 | 0.38 | 0.41 | 0.54 | 0.14 | 0.85 | 0.90 | 0.99 | 0.93 | 0.25 | 1.00 | ||||||||
| Cht | 0.66 | 0.69 | 0.64 | 0.35 | 0.34 | 0.47 | 0.09 | 0.79 | 0.85 | 0.97 | 0.95 | 0.29 | 0.97 | 1.00 | |||||||
| Bb+kf | 0.69 | 0.73 | 0.70 | 0.29 | 0.21 | 0.43 | 0.08 | 0.79 | 0.84 | 0.95 | 0.92 | 0.16 | 0.96 | 0.96 | 1.00 | ||||||
| Bap | 0.74 | 0.74 | 0.71 | 0.09 | 0.12 | 0.62 | 0.12 | 0.80 | 0.86 | 0.88 | 0.78 | 0.22 | 0.90 | 0.88 | 0.89 | 1.0 | |||||
| I123cdP | 0.70 | 0.75 | 0.77 | 0.30 | 0.39 | 0.40 | 0.08 | 0.74 | 0.81 | 0.96 | 0.90 | 0.17 | 0.93 | 0.95 | 0.95 | 0.87 | 1.00 | ||||
| DBahA | 0.72 | 0.69 | 0.62 | 0.67 | 0.45 | 0.51 | 0.06 | 0.82 | 0.83 | 0.94 | 0.87 | 0.19 | 0.95 | 0.91 | 0.85 | 0.83 | 0.88 | 1.00 | |||
| BghiP | 0.71 | 0.73 | 0.65 | 0.26 | 0.08 | 0.37 | -0.04 | 0.60 | 0.66 | 0.84 | 0.85 | 0.15 | 0.86 | 0.87 | 0.93 | 0.81 | 0.85 | 0.78 | 1.00 | ||
| Sum PAHcarc | 0.69 | 0.73 | 0.71 | 0.27 | 0.29 | 0.45 | 0.08 | 0.80 | 0.86 | 0.97 | 0.92 | 0.17 | 0.97 | 0.97 | 0.99 | 0.92 | 0.97 | 0.89 | 0.90 | 1.00 | |
| Sum PAHtot | 0.68 | 0.69 | 0.66 | 0.32 | 0.34 | 0.51 | 0.14 | 0.84 | 0.89 | 0.99 | 0.93 | 0.23 | 0.99 | 0.97 | 0.97 | 0.91 | 0.95 | 0.93 | 0.87 | 0.99 | 1.00 |
4. Conclusions
PM2.5 and PM10 emissions from burning scrap tires used as fuel in adobe ovens in Santiago Coachotitlán exceeded the Mexican Standards of air quality most days and all days, respectively, during NA, whereas the WHO standard was exceeded all days even during LA. The exceedances of these standards implicate health risks for the population.
The most abundant species was OC, which accounted for 82% of PM2.5 during the NA period. PAHs are present this fraction, being I123cdP, Bb+kF, and BaP the most abundant carcinogenic species. Carcinogenic PAHs accounted for 53 to 59% of total PAHs considering both sizes and activity periods.
The carcinogenic and mutagenic potentials of PAHs (BaP-TEQ and BaP-MEQ) were more than 10 times higher during the LA period and more than 25 times higher during the NA period than the recommended values by the European Commission, representing a very important risk for the population, which is exposed to these pollutants every day. Those values are higher than the reported in cities and megacities with high vehicle traffic.
The diagnostic ratios [Flt]/([Pyr]+[Flt]) and [BaA]/([BaA]+[Chr]), as well as the dominance of high molecular weight PAHs confirmed the dominance of pyrolytic PAHs. Mmoreover, some diagnostic ratios for scrap tires combustion were proposed for PM10 and PM2.5, which can be used with ratios previously published for sources identification.
The intervention of authorities to mitigate these highly toxic pollutant levels is urgent. Nevertheless, sociocultural and economic issues should be taken into account to implement educational programs in order to convince artisans of the need to avoid the burning of scrap tires and consider changes to the ancestral technology of adobe ovens, such as the inclusion of particle filters.

