


 nueva página del texto (beta)
 Inglés (pdf)
 Artículo en XML
 Referencias del artículo
 Enviar artículo por email
 Citado por SciELO
  Similares en
SciELO
Similares en
SciELO 
 Permalink
1. Introduction
Milling is the process of machining flat, curved surface by feeding the work piece against rotating cutters. In face milling operation milling cutter rotated about an axis perpendicular to the work piece. The performance of machine tool dependent on the machining parameters like spindle speed, depth of cut and feed rate, all these machining parameter effect on surface roughness of work piece with major impact on machining tool vibration. In any of the machining processes, Surface quality have been decided by the surface roughness which is most indicated customer imperative. To enhance the product quality and productivity, combination of this machining parameter will result in an optimized condition. The effects of cutting parameter on surface finish in semi-solid AA7075 face milling, it is concluded that cutting speed significantly affect the surface roughness followed by feed rate and the research of this result could be applied in manufacturing of automotive component studied by Rawangwong, Chatthong, Boonchouytan, and Burapa (2014). Optimization of process parameter analyzed by performing the milling machining of hardened steel by varying the each parameter for L16 orthogonal array and output Parameter as surface finish. The result shows that radial cutting depth and the interaction between the radial and axial depth of cut are most relevant parameters investigated by Ribeiro, Cesar, and Lopes (2017). The face milling operation on Al6061 material according to Taguchi Orthogonal array and artificial neural network (ANN) model for various combination of control parameter, it was concluded that both the experimental approaches got almost the same for surface roughness value discussed by Sukumar, Venkata Ramaiah, and Nagarjun (2014). The effect of cutting parameter on machine tool vibration and surface roughness was carried out in high precision CNC milling machine. Compared The ANOVA results for Full factorial and Taguchi design of experiments techniques and found that Taguchi design of experiments is better and reliable to obtain optimal number of experiment by Kusuma, Agrawal, and Shashikumar (2014). Optimization of cutting process parameters increase the efficiency and improve the quality of the component explored by Subramanian, Sakthivel, Sooryaprakash, and Sudhakaran (2013). The second order equation developed and it has shown good co-relation between the predicted and experimental values described by Lmalghan, Rao, Arun Kumar, Rao, and Herbert (2018). Taguchi method has been successfully employed for optimizing the process parameter of milling of mild steel it provides a systematic and efficient methodology for optimal milling parameters investigated by Prasadraju, Satish Raja, Praveen, and Ajith Kumar (2017). The optimization of CNC end milling process parameters to provide good surface finish as well as high material removal rate experimented by Moshat, Datta, Bandyopadhyay, and Pal (2010). Response Surface Method (RSM) in order to develop an empirical model of the second order for predicting the surface finish in the machining of EN24 alloy steel discussed by Suresh, Sriram Kumar, Murali, and Madhava Rao (2011). The work carried out by the researchers provides in depth knowledge of machine tool behavior under varying machining conditions. In this context, an effort has been made to establish the relationship between cutting condition-machine tool-response parameter, which provides an industrial application, especially in the area of productivity and machine tool condition monitoring.
2. Experimental procedure
The conventional vertical milling machine used in the current experimentation was an HMT FN1PV vertical milling machine with Al6082 alloy used as work part for face milling operation were shown in Figure 1 and 2, the hardness of Al6082 is 40BHN with density 2.71 g/cm3. The multiple carbide cutting inserts were used with a noise radius of 0.4 mm and it fixed in collect of 20mm diameter. The experimental trials were designed by using Taguchi L9 orthogonal array (Sukumar, et al., 2014) as shown in Table 1 and Table 2, with three levels of machining parameters such as spindle speed, feed rate and depth of cut (Prasadraju, 2017; Ribeiro, et al., 2017). The vibrations were measured for each experimental trial with the help of a tri-hub accelerometer mounted on the spindle head of the machine tool and the vibrations data were recorded through the fast Fourier transform (FFT) analyzer. The FFT analyzer, which receives the signal and converts it into AC waveform and display signals on the system. The signal was displayed with the support of software and finally expresses it as RMS value which forms the vibration measurement. The surface roughness of the machined part was measured for each trial and recorded.


Table 1 Input parameters and their levels.
| Levels | Spindle speed (rpm) | Feed rate (mm/min) | Depth of cut (mm) |
| L1 | 125 | 31.5 | 0.3 |
| L2 | 250 | 40 | 0.6 |
| L3 | 710 | 56 | 1 |
Table 2 Recorded vibration and surface roughness values.
| Exp No |
Spindle speed (rpm) |
Feed rate (mm/min) |
Depth of cut (mm) |
Tangential vibration (g) |
Axial vibration (g) |
Radial vibration (g) |
Surface roughness (µ) |
| 1 | 125 | 31.5 | 0.3 | 0.214 | 0.267 | 0.038 | 2.77 |
| 2 | 125 | 40 | 0.6 | 0.214 | 0.287 | 0.039 | 4.15 |
| 3 | 125 | 56 | 1 | 0.224 | 0.232 | 0.038 | 2.94 |
| 4 | 250 | 31.5 | 0.6 | 0.167 | 0.243 | 0.073 | 1.35 |
| 5 | 250 | 40 | 1 | 0.191 | 0.46 | 0.060 | 2.27 |
| 6 | 250 | 56 | 0.3 | 0.358 | 0.273 | 0.053 | 1.47 |
| 7 | 710 | 31.5 | 1 | 0.197 | 0.305 | 0.073 | 2.69 |
| 8 | 710 | 40 | 0.3 | 0.24 | 0.508 | 0.066 | 0.73 |
| 9 | 710 | 56 | 0.6 | 0.284 | 0.383 | 0.107 | 0.94 |
3. Results and discussion
3.1 ANOVA for tangential vibration of Al6082 alloy
After the completion of the experiments, data were collected and sorted based on the requirements of the study. Then the collected data were subjected to an analysis process which included an analysis of variances (ANOVA). The optimal machining parameter design was done using Taguchi L9 orthogonal array. The analysis of variances was carried out; it included three independent variables and one dependent variable. The three input parameters, namely, spindle speed, feed and depth of cut, remained the same. The output parameter or dependent variable was subjected to change with each ANOVA. In this study four different analyses of variances (ANOVA) were carried out: surface roughness of Al6082 alloy and three axis vibrations. As shown in the following tables, vibration is maximum at a feed rate of 40mm/min for both the tangential and axial vibrations, minimum at (31.5 and 56) mm/min for the tangential vibration and only 31.5mm/min for the axial vibration.
Table 3 and Table 4 demonstrate the percentage contribution of the highest significant factor for the tangential and axial vibrations, respectively. The feed rate has the highest impact (50%) followed by the spindle speed (3.72%) and the F- test value is 3.11 and the F-test value is 3.11 and the F table value is 4.73 for the feed rate; therefore, this is the significant factor influencing the tangential vibration. The feed rate has the highest impact (47.33%) followed by the spindle speed (35.87%) the F-test value is 3.11 and the F table value is 3.70 for the feed rate; thus, this is the significant factor influencing the axial vibration. Table 5 shows the significant factor for the radial vibrations. The spindle speed has the highest impact (71.40%) followed by the depth of cut (17.18%) and the F-test value is 3.11 and the F table value is 10.25 for the spindle speed; hence, this is the significant factor influencing the radial vibration. Figure 3 shows the variation of the tangential vibration corresponding to the variation in input parameters in which it is found that the maximum value occurs at 710 rpm and minimum at 250 rpm. Figures 4 and 5 show the variation of the axial and radial vibrations corresponding to the variation in input parameters in which it is found that the maximum value occurs at 710 rpm and minimum at 125 rpm. Table 6 and Table 7 show the response table of the mean for the tangential vibration and the axial vibration.
Table 3 ANOVA for tangential vibration of Al6082 alloy.
| Source | DOF | Sum of square | Mean of square | F-Value | P-Value | %Contribution |
| Spindle speed | 2 | 0.000987 | 0.000493 | 0.31 | 0.764 | 3.72 |
| Feed rate | 2 | 0.015142 | 0.007571 | 4.73 | 0.175 | 57.16 |
| DOC | 2 | 0.007158 | 0.003579 | 2.24 | 0.309 | 27.02 |
| Error | 2 | 0.003201 | 0.001600 | - | - | 12.08 |
| Total | 8 | 0.026487 | - | - | - | 100.00 |
Table 4 ANOVA for axial vibration of Al6082 alloy.
| Source | D O F | Sum of square | Mean of square | F-Value | P-Value | %Contribution |
| Spindle speed | 2 | 0.0280 | 0.0140 | 2.80 | 0.263 | 35.87 |
| Feed rate | 2 | 0.0370 | 0.0185 | 3.70 | 0.213 | 47.33 |
| DOC | 2 | 0.0030 | 0.0015 | 0.31 | 0.764 | 3.95 |
| Error | 2 | 0.0100 | 0.0050 | - | - | 12.79 |
| Total | 8 | 0.0782 | - | - | - | - |
Table 5 ANOVA for radial vibration of Al6082 alloy.
| Source | DOF | Sum of Square | Mean of square | F-Value | P-Value | %Contribution |
| Spindle speed | 2 | 0.00287 | 0.00143 | 10.25 | 0.089 | 71.40 |
| Feed rate | 2 | 0.00017 | 0.00008 | 0.64 | 0.611 | 4.42 |
| DOC | 2 | 0.00069 | 0.00034 | 2.47 | 0.288 | 17.18 |
| Error | 2 | 0.000280 | 0.00014 | - | - | 6.96 |
| Total | 8 | 0.00402 | - | - | - | - |


Table 6 Response table for means of Tangential vibration.
| Level | Spindle speed (rpm) |
Feed rate (mm/min) |
Depth of cut (mm) |
| 1 | 0.2173 | 0.1927 | 0.2707 |
| 2 | 0.2387 | 0.2150 | 0.2217 |
| 3 | 0.2403 | 0.2887 | 0.2040 |
| Delta | 0.0230 | 0.0960 | 0.0667 |
| Rank | 3 | 1 | 2 |
Table 7 Response table for means of axial vibration.
| Level | Spindle speed (rpm) |
Feed rate (mm/min) |
Depth of cut (mm) |
| 1 | 0.262 | 0.2717 | 0.3493 |
| 2 | 0.3253 | 0.4183 | 0.3043 |
| 3 | 0.3987 | 0.2960 | 0.3323 |
| Delta | 0.1367 | 0.1467 | 0.0450 |
| Rank | 2 | 1 | 3 |
Table 8 shows the significant factor for surface finish, the spindle speed is the dominant factor (60.20%) followed by the depth of cut (14.84%) and the F-test value is 3.11 and the F table value is 3.13 for the spindle speed; therefore this is the significant factor influencing the surface roughness.
Table 8 ANOVA result for surface roughness of Al6082 alloy.
| Source | DOF | Sum of square | Mean of square | F-Value | P-Value | %Contribution |
| Spindle speed | 2 | 5.9607 | 2.9803 | 3.13 | 0.242 | 60.20 |
| Feed rate | 2 | 0.6025 | 0.3012 | 0.32 | 0.760 | 6.08 |
| DOC | 2 | 1.4341 | 0.7170 | 0.75 | 0.570 | 14.48 |
| Error | 2 | 1.9031 | 0.9516 | - | - | 19.22 |
| Total | 8 | 9.9003 | - | - | - | - |
Figure 6 shows the variation of surface roughness corresponding to the input parameters, surface roughness is maximum at 710 rpm spindle speed and minimum at 250 rpm speed. Table 9 and Table 10 show the response table of the mean for radial vibration and surface roughness.

Table 9 Response table for means of radial vibration.
| Level | Spindle speed(rpm) |
Feed rate (mm/min) |
Depth of cut (mm) |
| 1 | 0.03833 | 0.06133 | 0.05233 |
| 2 | 0.06200 | 0.05500 | 0.07300 |
| 3 | 0.08200 | 0.06600 | 0.05700 |
| Delta | 0.04367 | 0.01100 | 0.02067 |
| Rank | 1 | 3 | 2 |
Table 10 Response table for means of surface roughness.
| Level | Spindle speed (rpm) |
Feed rate (mm/min) |
Depth of cut (mm) |
| 1 | 3.287 | 2.270 | 1.657 |
| 2 | 1.697 | 2.383 | 2.147 |
| 3 | 1.453 | 1.783 | 2.633 |
| Delta | 1.833 | 0.600 | 0.977 |
| Rank | 1 | 3 | 2 |
Optimal parameters are performed with the help of signal- to-noise ratio by using smaller is better characteristic condition in Minitab-18 software. Figures 7, 8, 9 and 10 show the main effective plot for the S/N ratio corresponding to the tangential, axial, and radialvibrations and the surface roughness from the main effect plot arrows shows the optimal parameter for the corresponding respected output parameter. Tables 11, 12, 13 and 14 show the response table of signal-to-noise ratio for the tangential, axial vibration and radial vibrations and the surface roughness.

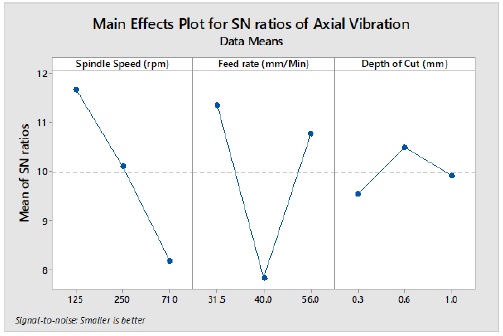


Table 11 Response table for signal-to-noise ratios for tangential vibration.
| Level | Spindle speed (rpm) |
Feed rate (mm/min) |
Depth of cut (mm) |
| 1 | 13.26 | 14.35 | 11.57 |
| 2 | 12.96 | 13.39 | 13.29 |
| 3 | 12.48 | 10.96 | 13.83 |
| Delta | 0.78 | 3.40 | 2.26 |
| Rank | 3 | 1 | 2 |
Table 12 Response table for signal-to noise ratios for axial vibration.
| Level | Spindle speed (rpm) |
Feed rate (mm/min) |
Depth of cut (mm) |
| 1 | 11.667 | 11.357 | 9.543 |
| 2 | 10.103 | 7.823 | 10.489 |
| 3 | 8.178 | 10.768 | 9.916 |
| Delta | 3.490 | 3.534 | 0.946 |
| Rank | 2 | 1 | 3 |
Table 13 Response table for signal-to-noise ratios for radial vibration.
| Level | Spindle speed (rpm) |
Feed rate (mm/min) |
Depth of cut (mm) |
| 1 | 28.33 | 24.62 | 25.84 |
| 2 | 24.23 | 25.41 | 23.44 |
| 3 | 21.92 | 24.44 | 25.19 |
| Delta | 6.41 | 0.96 | 2.40 |
| Rank | 1 | 3 | 2 |
4. Conclusions
The present study describes the influence of machining parameter in face milling operation of Al6082 alloy by considering machine tool vibration and surface roughness as response parameters. Experiments are performed by Taguchi L9 orthogonal array with combination of machining parameters, on conventional vertical milling machine using multiple carbide inserts cutting tool. The machine tool vibration and surface roughness were captured and recorded for each experimental trial. It is observed from the analysis that the tangential and axial vibration of the machine tool is significantly influenced by feed rate whereas radial vibration is by spindle speed. The other response parameter, surface roughness of the machined part is significantly influenced by spindle speed.
The optimum cutting conditions for tangential and axial vibration are found to be 710 rpm of spindle speed, 40 mm/min of feed rate and 0.3 mm of depth of cut. The spindle speed of 710 rpm, feed rate of 56 mm/min and depth of cut of 0.6 mm are found to be optimum cutting conditions for radial vibration. The optimum cutting conditions for better surface finish are found to be similar to that of radial vibration except with lesser depth of cut 0.3 mm. The study provides a platform for an industrial application to select an appropriate combination of cutting parameters to maintain good working condition of the machine tool with enhanced productivity.

