


Servicios Personalizados
Revista
Articulo
 texto en
  Inglés (pdf)
 Artículo en XML
 Referencias del artículo
 Enviar artículo por email
Indicadores
-
 Citado por SciELO
 -
 Accesos
Links relacionados
-
 Similares en
SciELO
Similares en
SciELO
Compartir

 Permalink
Revista mexicana de ciencias agrícolas
versión impresa ISSN 2007-0934
Rev. Mex. Cienc. Agríc vol.7 spe 15 Texcoco jun./ago. 2016
Articles
Estimation of the adoption of innovations in agriculture
1Centro de Investigaciones Económicas Sociales y Tecnológicas de la Agroindustria y la Agricultura Mundial (CIESTAAM)-Universidad Autónoma Chapingo (UACh). Carretera México-Texcoco, km 38.5, Chapingo, México C. P. 56230. (ropg.evaluador@gmail.com; bey.jamelyd@gmail.com).
2Posgrado en Estadística-Colegio de Postgraduados. (martinez.humberto@colpos.mx).
The adoption of innovations is related to the use of technology that allows you to create a productive potential and improve competitiveness. In agriculture, the adoption of the innovation has been attempted account in various ways, however, in most cases was made from simple innovations counts performed. This research proposes a method to estimate the level of adoption of innovations in agriculture. From the analysis of a package of 29 innovative practices promoted by the program sustainable modernization of traditional agriculture in the state of Guerrero, in 2013, an index is calculated by analyzing correlations tetrachoric and main components. The results indicate that an index with specific weights for each innovation better reflects the process of adoption of innovations since the problem of accounting in a simple way the number of innovations made by a producer is eliminated. The main conclusion is that the weighted index of agricultural innovations (IPIA) identifies different intervention strategies based on a more precise level of adoption of innovations to a specific producer estimate.
Keywords: level of innovation; main components; MasAgro; tetrachoric correlation
La adopción de innovaciones se relaciona con el uso de tecnología que permite crear un potencial productivo y mejora de la competitividad. En la agricultura, la adopción de la innovación se ha intentado contabilizar de diversas formas, sin embargo, en la mayoría de los casos se ha realizado a partir de conteos simples de innovaciones realizadas. Esta investigación propone un método para estimar el nivel de adopción de innovaciones en la agricultura. A partir del análisis de un paquete de 29 prácticas innovadoras promovidas por el programa de modernización sustentable de agricultura tradicional en el estado de Guerrero, en 2013, se calculó un índice mediante el análisis de correlaciones tetracóricas y componentes principales. Los resultados indican que un índice con pesos específicos para cada innovación refleja mejor el proceso de adopción de innovaciones pues se elimina el problema de contabilizar en forma simple el número de innovaciones realizadas por un productor. La principal conclusión es que el índice ponderado de innovaciones agrícolas (IPIA) permite identificar estrategias de intervención diferenciadas con base en una estimación más precisa del nivel de adopción de innovaciones para un productor específico.
Palabras clave: componentes principales; correlación tetracórica; MasAgro; nivel de innovaciones
Introduction
The access to knowledge is increasingly recognized as a major determinant of economic growth and innovation. While technological and innovation capabilities have become critical to establish the competitiveness of enterprises (Porta, 2010). COTEC (2001) defines innovation as the ability to turn ideas into products, processes or services or improved the market values, based on knowledge, serves a specific need, increases the capacity of wealth of the company and also has strong social implications. Stoneman and Diederen (1994) indicate the importance of innovation in stating that their use generates productive potential and competitiveness. Meanwhile, Lundvall (2011) highlights the importance of innovation as the ability to learn and develop skills that promotes entrepreneurship and initiative.
Various factors, including: globalization, population growth, the constant demand for more and better food, the demand for energy, preservation of the environment, and others (Carpio, 2000; Pretty et al., 2010); impose new challenges to world agriculture, such as the need to increase food production without losing sight of the efficient use of resources to meet the production needs of the food industry.
In this situation, the Mexican government has proposed various initiatives for capacity building of producers in the Mexican countryside, one of which is the strategic plan for sustainable modernization of traditional agriculture (MasAgro). It is a strategy that focuses its efforts on rural areas maize producers temporarily, through the adoption of sustainable agricultural practices (CIMMYT, 2011a). The Oslo Manual (OECD, 2005) defines a minimum criterion for a company practice is considered innovation, which is new to the company; also mentions that this does not have to be developed by the same company, you can purchase other through the process of diffusion. Based on the above, this research agronomic practices and innovations will be considered.
Identify the level of adoption of innovations producer allows two things: i) the first, inherent in innovation, allows to evaluate the relevance of the innovation to the producer and simultaneously detect the barriers that limit the adoption process; ii) the second, inherent in the producer facilitates identify the particular characteristics by which the producer adopts or not a practice and innovation opportunities that may exist.
In different areas and latitudes they have built various indicators. In Mexico for example have: the human development index, created by the United Nations Development Programme (PNUD-México); the marginality index generated by the National Population Council (CONAPO); the social gap index, produced by the National Council for Evaluation of Social Development Policy (CONEVAL); sustainable development indicator, generated by the National Institute of Statistics, Geography and Informatics (INEGI) and the National Institute of Ecology (INE); Rurality Index (Zamudio et al., 2008).
Generally speaking, an index is a quantitative or qualitative measure derived from a series of observations that can reveal relative positions (Ciegis et al., 2009). The indices imply a methodological compromise between technical feasibility, public availability for use and systemic consistency. Several authors (Ciegis et al . , 2009; Araujo et al . , 2012 ; Jimenez- Valero et al., 2012) report that the indexes must have the following characteristics: credibility, representativeness, legitimacy, relevance and sensitivity to change; plus they should be: objective, understandable, measurable and comparable.
Regarding the measurement innovation, Jimenez-Valero et al. (2012) report that internationally there are studies that attempt to measure innovation, for example in the health sector Hikmet et al. (2008) measure the level of adoption of innovations in hospitals as gross count of using information technology to health. In the business sector Chen et al. (2004) proposed measuring innovation as the number of new technologies that a company had recently developed; meanwhile Tsai and Ghoshal (1998) innovation they measured through the number of new products, services and projects a company developed in a given time.
For the agricultural sector, have a history since the 50s, Fliegel (1956) proposed calculating the rate of adoption of agricultural practices such as the percentage of the practices that a producer could take on the total of all of them; Priya (1962) subsequently calculated the adoption rate as the total number of years that a producer had made several improved practices suggested by the agricultural extension service; Santoyo et al. (2002) raised the rate of good agricultural practices, GAPI for its acronym in English, to assess rural development programs.
In Mexico, Muñoz et al. (2007) proposed a rate of adoption of innovations (InAI) to measure the innovative capacity of a producer; this index (which hereinafter referred to a InAI) is very similar to what Fliegel (1956) proposed. The difference is that the first innovations authors classified into categories based on a technology package and within each category got an InAI, to count the number of innovations that a producer made divided by the total number of innovations that category. At the end of InAI each category are averaged to obtain the InAI producer. This proposal has been mainly used by agents of change aimed at promoting innovation, and researchers (Zarazua et al., 2009; Zarazua-Escobar et al., 2011; Zarazua et al., 2012; Diaz-Jose et al., 2013; Perez et al., 2013; Sanchez et al., 2013) that analyze the adoption process of innovation.
It is clear that adoption rates proposed by Fliegel (1956); Muñoz et al. (2007) make no distinction between innovations, because in all cases it is assumed that all have the same weight. Thus, if two producers A and B perform three innovations have the same level of adoption regardless of whether they are the same or not. However, it has been perceived that a technological package within an innovations are more relevant than others, therefore, the innovations influence differently so the weight of each should be differentiated. Thus, the only possibility that two producers have the same level of adoption is when they perform the same innovations.
Measure the innovative capacity of requires an index that takes into account both the number and the type of innovations that producer performs producer. Thus, this index will be relevant for the design of strategies, processes of interaction and resource allocation in the agricultural sector.
From the above, the objective of this research was to construct an index that measures the level of adoption of innovations through principal component analysis that allows differentiation of the innovations included in a technology package for corn producers in the state of Guerrero.
Materials and methods
Spatial and temporal delimitation
A database was used with information on 552 maize farmers in Guerrero state, obtained from a detailed analysis of actors mapping (MDA). The work consisted of collecting information related to the general characteristics of the culture, practices carried out by the producer, as well as the information source of such practices. The gathering of information was conducted during the months of September and October 2012.
Study innovations
The set of innovations was defined by the International Center for Improvement of Maize and Wheat (CIMMYT) in the framework of the MasAgro strategy, these innovations correspond to good agricultural practices that producers must make to sustainable production and appropriate marketing. About Pretty (2008)) notes that the practices that producers should be recommended to minimize the environmental impact, besides being accessible, effective and enable them to increase their productivity. CIMMYT classifies all innovations in five categories. Table 1 presents the innovations considered in each category and the relative frequency with which they are made by producers of corn.

Analysis of the information
For the proposed indicator, the data processing and statistical analyzes were performed using the Data Analysis and Statistical Software (STATA) package version 10, in the following order:
Coding innovations. The indicator function was used to transform each binary innovation. The value of 1 was assigned if a producer claimed realize innovation and 0 otherwise.
Determination of the specific weights of the categories. The specific weights of the categories as the proportion of innovations were obtained that each category contains with respect to the total innovations. The sum of specific weights is equal to unity.
Determination of the correlation matrix. The tetra choric matrix correlations of innovations in each category was built above the binary nature of the data. Each correlation matrix was transformed to positive semidefinite. It is important to note that in the case of the category of post- harvest technologies is not the correlation matrix is presented because it contains only an innovation.
Determination of the specific gravities of innovations. The technique of principal components analysis was used to obtain the coefficients of the group own innovations for each category. After calculating the ratio (ratio coefficient of each innovation and the sum of all) of each innovation within the relevant category it was performed. The sum of the specific gravities of innovations within each category is equal to unity. It is important to note that in the process of principal component analysis only considered innovations, this implies that in the final equation some innovations had zero coefficient.
Calculation of weighted index of agricultural innovations (IPIA). With specific weights obtained were calculated the IPIA from equation [1]:
Where: IPIA= weighted index of agricultural innovations; Ci= weight of the i-th category; Inj= weight of the jth innovation within the i-th category.
Results and discussion
Description of the study population
The 19.02% of corn farmers do not have some schooling, 57.07% have primary, 17.57% have secondary, 4.89% had high school level and only 1.45% have higher education.
As regards age, 12.86% of the population is under 30 years, 20.47% is within the range of 30 to 40 years, 22.64% are 40 to 50 years, 19.93% from 50 to 60 years and 24.09% are over 60 years. Foturoti et al. (2006) found the academic degree and experience in the activity as determinants for the adoption of innovations factors.
The ownership of the land of the farmers is collective with 72.10%, followed by private property with only 26.27% and 1.63% is leased. The 28.68% of creole corn farmers use improved seeds and the rest, on average planted area is 1.6 hectares per producer and the average yield is 2.77 t ha-1.
Specific gravities of categories
Table 2 shows the specific weights by category are presented as described in materials and methods section.

Correlation analysis
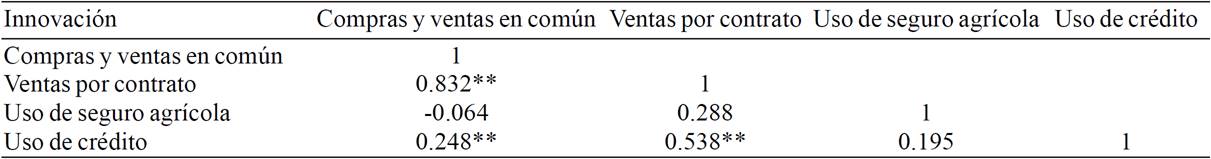
With regard to the category of market and financing, a high positive correlation (Table 3) between innovation contract sales and purchases and sales in common was observed, it is explained by the economies of scale generated by associate producers. A high positive correlation between innovations using credit and contract sales was also found: a large extent, the certainty of sales facilitates the use of credits (Muñoz et al., 2002).
Table 3. Matrix correlations for the category tetrachoric market and financing technology package corn in the state of Guerrero.
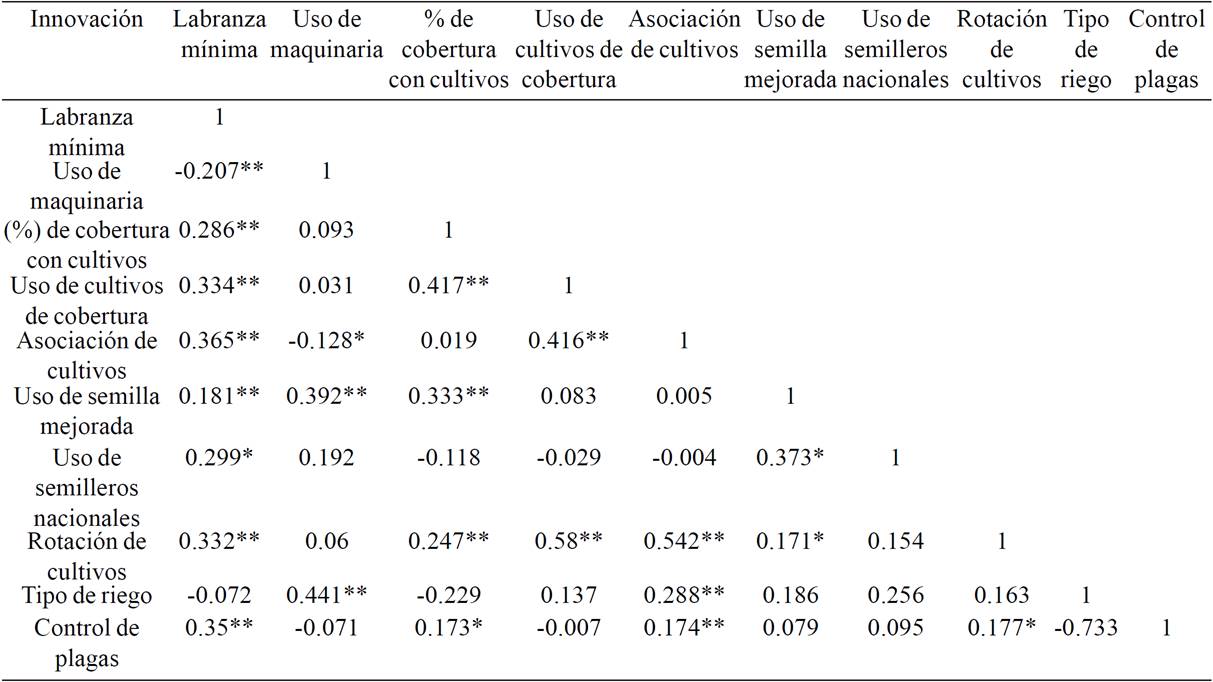
In Table 4, the positive semidefinite matrix of correlations tetrachoric agronomic management category is presented. The correlations show a relationship between innovations: minimum tillage, use of cover crops, crop association and rotation of crops with high significances. This is because these innovations are also easily adoptable that do not involve additional costs to the producer to implement; also it influenced by the fact that these innovations have been promoted by agents of change within the framework of the strategy MasAgro because they are pillars of conservation agriculture (CA) (CIMMYT, 2011c).
Table 4. Matrix tetrachoric correlations for the category agronomic management of corn technological package in the state of Guerrero.
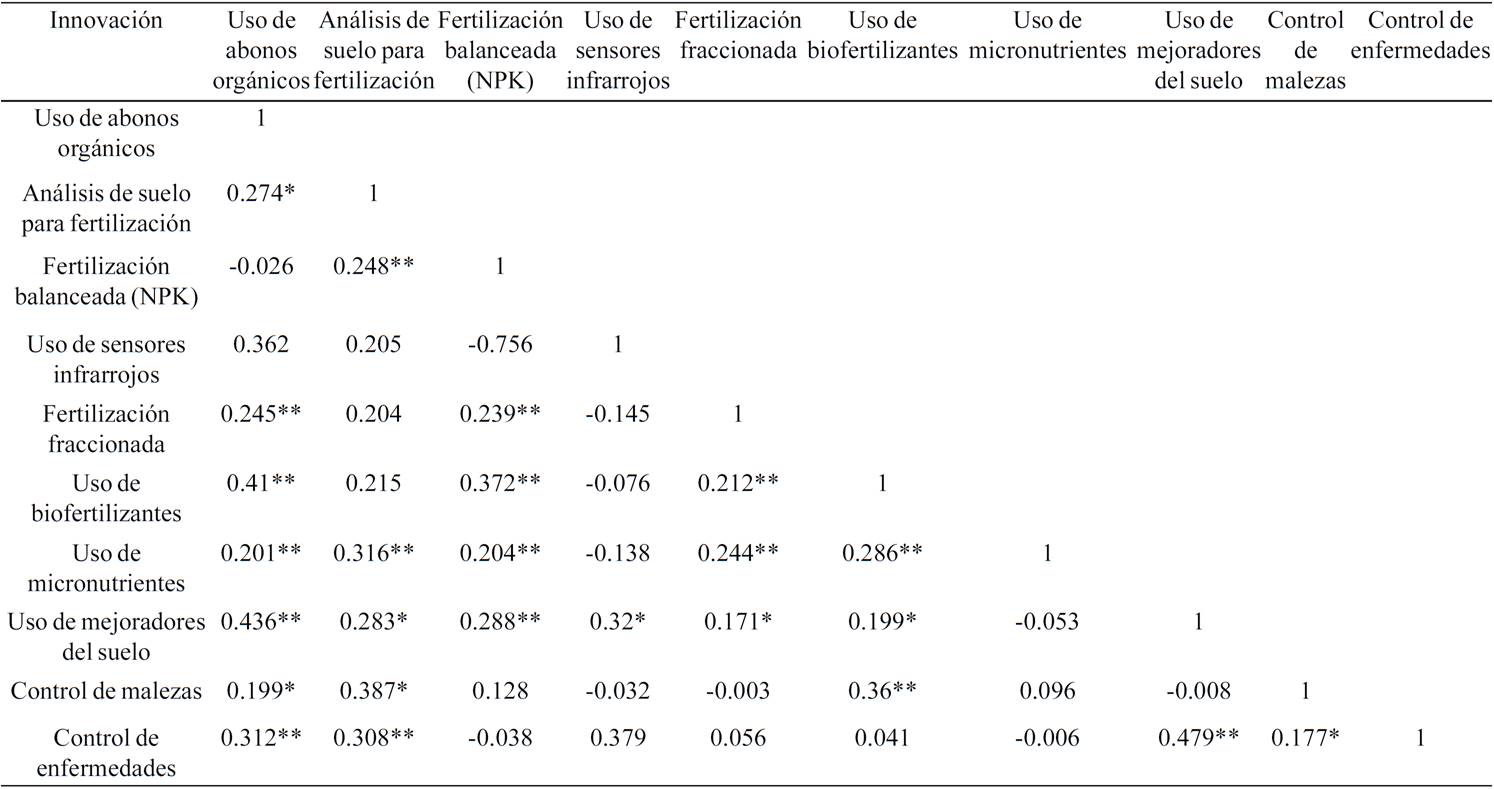
For the category of nutrition, high positive correlations between soil improvers innovation with use innovations of organic fertilizers and disease control in both cases were highly significant (Table 5) were observed. In all significant correlations the relationship was positive, the above motivates think that the innovations included in the nutrition category are appropriate.
Table 5. Matrix tetrachoric correlations for nutrition category of technology package of corn in the state of Guerrero.
The organization and administration category contains only two innovations: organizational consolidation and technical-productive administrative records, tetrachoric coefficient was positive correlation (0.625) with high statistical significance (p≤ 0.01).
Principal component analysis (ACP)
Using the correlation matrix in Table 4, the ACP was made for the agronomic management category, the first three components explaining 63.3% of the total variance were considered. In Table 6, the values of the components and the weight of each presented innovation.

The weight column indicates the relative contribution of each innovation within the category of agricultural management. More weight innovation was the use of improved seed, followed by the use of specialized machinery, other innovations with outstanding weight are the use of national seedbeds and type of irrigation. The relevance of these findings is that if these innovations are practiced by the producers to increase their level of adoption; however, his practice involves additional costs to the producer which conditions its adoption.
Similarly, an ACP was performed using the correlation matrix of market and financing category in Table 3, only the first component, which accounts for almost 55% of the total variance was considered. In Table 7, the values of the first component and the weight of each presented innovation.
Table 7. Main components of the market and financing category and specific gravities for innovation.
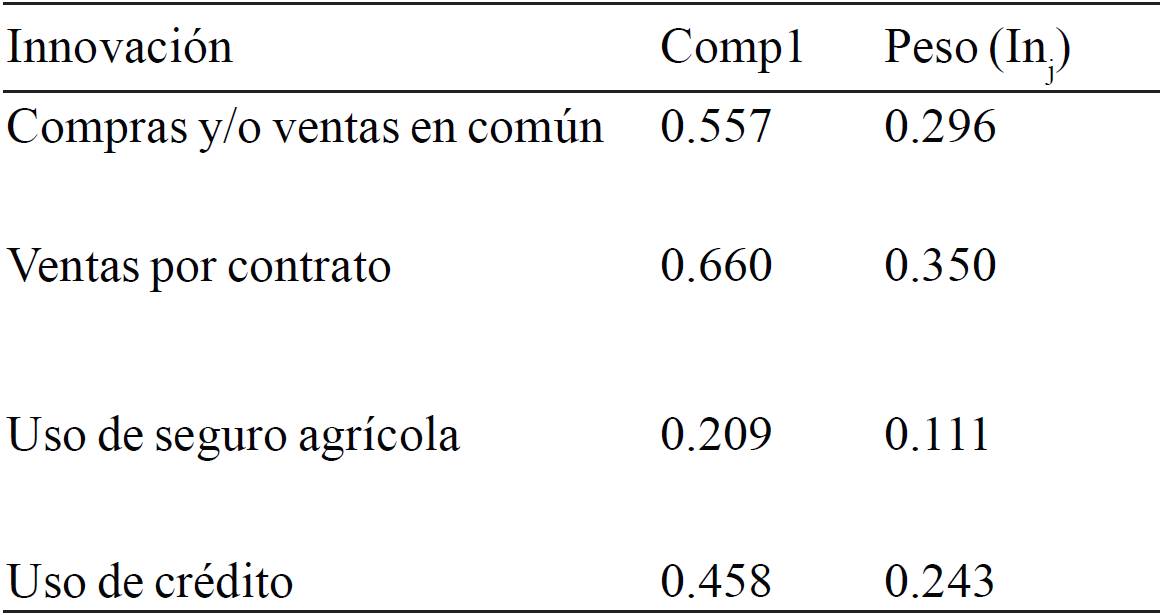
The sales innovation contract had greater weight within this category, particularly is considered very important to have a definite plan for carrying out the sale of its production market, it could be considered to sales innovation contract as the detonator in the adoption of other innovations in this category. The weight of innovation: the use of agricultural insurance is explained by the characteristics of the producers who are elderly and low schooling, in addition to small farms with temporary; Muñoz et al. (2002) point out that producers with relatively large surfaces, irrigation system and financing are the ones who are more likely to buy insurance.
For the category of nutrition Table 5 shows the main components first four because these explain little more than 70% of the total variance were used. The output values components and the weight of each category innovation in nutrition, is presented in Table 8.

Innovation more weight within this category was balanced fertilization with more than 15% of relative contribution, this innovation is interrelated with other innovations in this category as are the analysis of soil, use of fertilizers and use of soil improvers. The practice of these innovations is essential for plants to acquire the necessary nutrients, it promotes MasAgro such innovations because this will allow improvements in yields (CIMMYT, 2011a; CIMMYT, 2011c).
As mentioned, the organization and administration category contains only two innovations: organizational consolidation and technical-productive administrative records. Thus, the ACP produces only one component, which explains just over 81% of the total variance, the value found for these innovations was 0.707. Where the weight for each innovation in this category was 0.5 (Inj).
Weighted index of agricultural innovations (IPIA)
The specific gravity by category (Ci) and specific gravity (Inj) of innovations within each category by equation (1) to calculate the IPIA of each rural producer of corn was used in constructing the index.
Comparison between the weighted index of agricultural innovations and the rate of adoption of innovations
Comparisons were made between IPIA and InAI indices to show the relevance of the proposal. The IPIA presented a range of 0.008-0.835, an average value of 0.293 and a median of 0.275; while the InAI is calculated according to the methodology of Muñoz et al. (2007) had smaller range of variation, with values 0.034-0.724, an average value of 0.251 and a median of 0.241 (Figure 1). This figure shows greater coverage and IPIA symmetry in relation to the InAI; it is also possible to observe in the figure as the IPIA is able to identify those extreme values contrary to what happens with InAI.
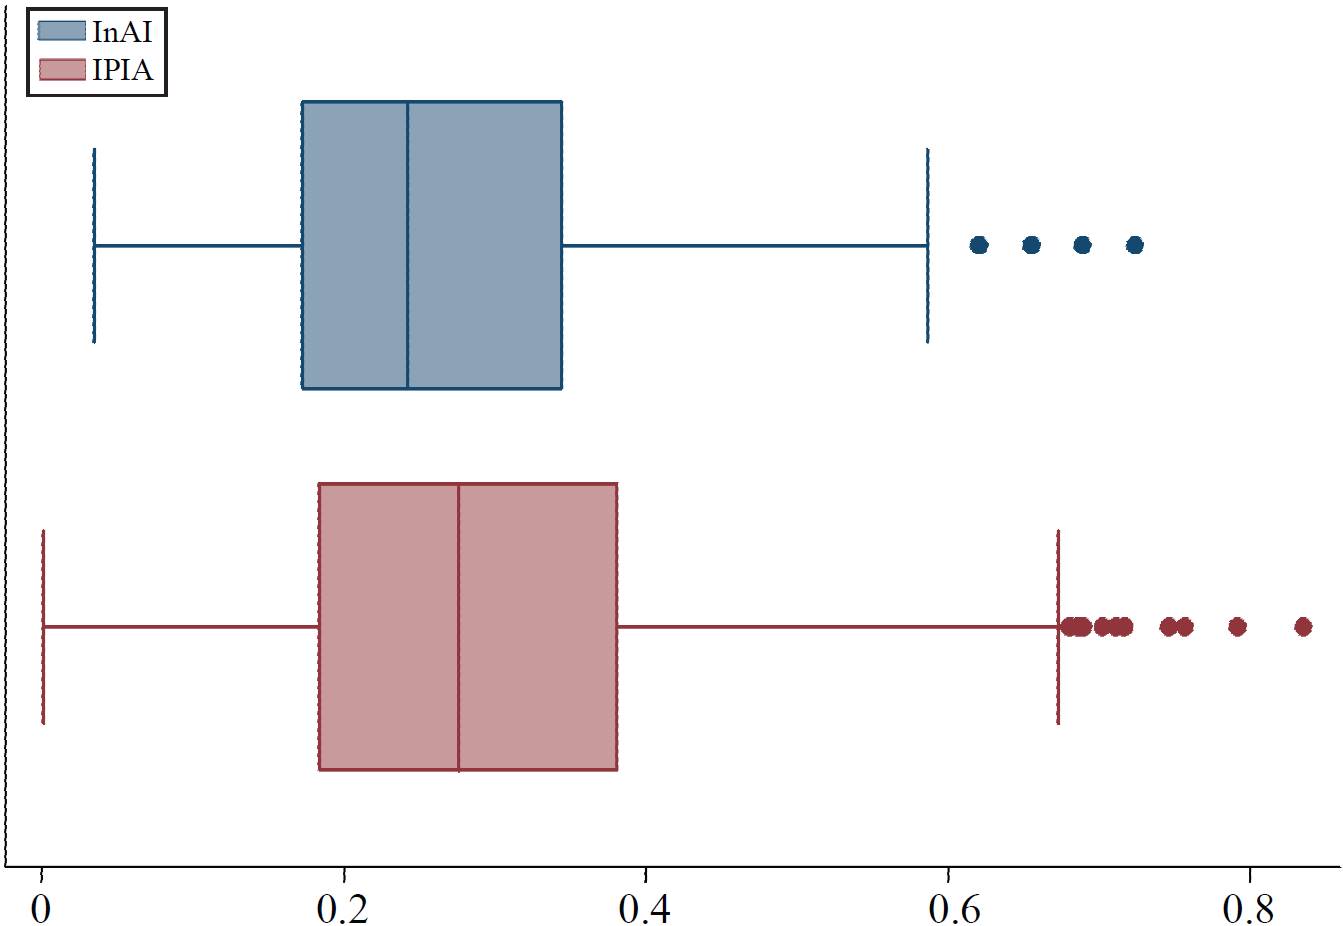
Figure 1. Comparison of the distributions of the level of adoption of maize producers in the rate of adoption of innovations and the weighted index of agricultural innovations.
Another feature to consider is that the InAI is actually a discrete variable and the possible values that can take are jumps in the same magnitude; i.e. the first possible value is given by the ratio 0/29 (when a producer makes no innovation); the second possible value is 1/29 (when a producer makes an innovation); and so on until the last possible value whose ratio is 29/29 (when a producer takes all innovations). These jumps are eliminated with the IPIA because weights for innovation and category are different, giving as a result that the data are continuous. This has gone unnoticed by those researchers who have addressed the adoption process of innovation (Zarazua et al., 2009; Zarazua- Escobar et al., 2011; Zarazua et al., 2012; Diaz-Jose et al., 2013; Perez et al., 2013; Sanchez et al., 2013).; this determines the depth of analysis to determine the effects of adoptions level.
For purposes of further analysis of comparison, Table 9 categorization of the level of adoption of innovations proposed producer. It notes that for both indexes ranging from zero to one.

Using the above categorization, the joint distribution of both indices was compared (Table 10).
Table 10. Comparison of the distribution of the level of innovation assigned by the rate of adoption of innovations and the weighted index of agricultural innovations for corn producers in the state of Guerrero.
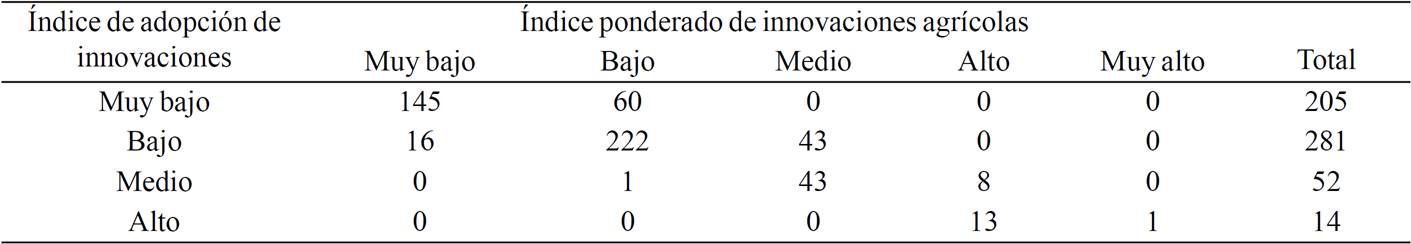
In the Table 10 shows how the level of adoption of producers are distributed according to the index is observed. For example, the InAI ranks at 281 producers a low level; however, IPIA redistributes maintaining at a low level while producing 222 to 16 and 43 were classified into the levels very low and medium respectively. This shows that the InAI does not discriminate innovations that the producer performs while the IPIA does.
Conclusions
The rate of adoption of innovations weighted identifies innovations with greater contributions. This is important because in reality there are key innovations that directly affect the competitiveness of the producer; these innovations can be hidden by integrating an indicator of innovations based on simple counting.
Measuring the proposed innovations considered specific gravities of each innovation. Thus, the rate of adoption of innovations from a producer will depend on what innovations made and not the number of innovations made. For the state of Guerrero, it is recommended to reduce the universe mapped innovations, from the 29 to the 15 innovations which are those that have greater weight in the corn farmers.
Future research could focus on the validation of indicators of adoption of innovations using weights and specific gravities, instead of using simple indicators for designing adoption counts.
Literatura citada
Araújo, L.; Fernandes, E. y Rosado, P. 2012. Índice de desarrollo socioambiental para el estado de Bahía. Revista Problemas del Desarrollo (Mèxico). 43:101-123. [ Links ]
Carpio M., J. 2000. Desarrollo local para un nuevo desarrollo rural. Anales de geografía de la Universidad Complutense (España). 20:85-100. [ Links ]
Chen, J.; Zhu, Z. y Xie, Y. 2004. Measuring intellectual capital: a new model and empirical study. Journal of Intellectual Capital (Uk). 5:195-212. [ Links ]
Ciegis, R.; Ramanauskiene, J. y Startiene, G. 2009. Theoretical Reasoning of the Use of Indicators and Indices for Sustainable Development Assessment. Rodiklių ir indeksų naudojimo įvertinti darnų vystymąsi teorinis pagrindimas (Lituania). 63:33-40. [ Links ]
CIMMYT. 2011a. La iniciativa MasAgro. EnlACe (México). Edición especial. 2:3-7. [ Links ]
CIMMYT. 2011b. Impacto en el campo. EnlACe (México). Edición especial. 2:11-15. [ Links ]
CIMMYT. 2011c. Manejo de parcelas en AC. EnlACe (México). Edición especial. 1:1-44. [ Links ]
COTEC. 2001. Innovación Tecnológica. Ideas Básicas. COTEC. Madrid. 46p. [ Links ]
Díaz-José, J.; Rendón-Medel, R.; Aguilar-Ávila J. y Muñoz-Rodríguez, M. 2013. Análisis dinámico de redes en la difusión de innovaciones agrícolas. Revista Mexicana de Ciencias Agrícolas (México). 4:1095-1102. [ Links ]
Fliegel, F. C. 1956. A multiple correlation analysis of factors associated with adoption of farm practices. Rural Sociology (USA). 21: 284-292. [ Links ]
Foturoti, B. O.; Emah, G. N.; Isife, B. I.; Tenkouano, A. y Lemchi, J. 2006. Prospects and determinants of adoption of IITA plantain and banana based technologies in three Niger Delta States of Nigeria. African Journal of Biotechnology (África). 5:1319- 1323. [ Links ]
Hikmet, N.; Bhattacherjee, A.; Menachemi, N.; Kayhan, V. y Brooks, R. 2008. The role of organizational factors in the adoption of healthcare information technology in Florida hospitals. Health Care Management Science (USA). 11:1-9. [ Links ]
Jiménez-Valero, B.; Suárez-Mella, R. y Medina-León, A. 2012. Dimensiones e indicadores para la evaluación de la innovación en la hotelería. Ingeniería Industrial (Chile). 33:69-76. [ Links ]
Lundvall, B. 2011. Notes on innovation systems and economic development, Innovation and Development (Denmark), 1: 25-38. [ Links ]
Muñoz, R. M.; Santoyo C., H.V. y Altamirano C., J.R. 2002. Mercados e instituciones financieras rurales: una nueva arquitectura financiera rural para México. Universidad Autónoma Chapingo. Chapingo, Estado de México. México. 315 p. [ Links ]
Muñoz, R. M.; Aguilar, Á. J.; Rendón, M. R. y Altamirano, C. J. R. 2007. Análisis de la dinámica de innovación en cadenas agroalimentarias, Chapingo, Estado de México. 72 p. [ Links ]
OCDE. 2005. Guía para la recogida e interpretación de datos sobre innovación. Manual Oslo. Eurostat. 187 p. [ Links ]
Pérez G., R.; Rendón M., R.; Aguilar A., J. y Muñoz R., M. 2013. Innovación en el sector rural de México: planeación y resultados. Revista Análisis Público (Chile) 2:89-107. [ Links ]
Porta, F. 2010. Integración comercial e innovación tecnológica. Aspectos conceptuales y análisis de experiencias, Banco Intermaericano de Desarrollo. [ Links ]
Pretty, J et al., 2010. The top 100 questions of importance to the future of global agriculture, International Journal of Agricultural Sustainability (USA). 8:219-236. [ Links ]
Pretty, J. 2008. Agricultural sustainability: concepts, principles and evidence. Philosophical Transactions of the Royal Society B (UK). 363:447-465. [ Links ]
Priya, B. P. 1962. Peasant values and innovation in India. American Journal of Sociology (USA). 67:552-560. [ Links ]
Sánchez G., J; Rendón M., R.; Cervantes E., F y López T., Q. 2013. El agente de cambio en la adopción de innovaciones en agroempresas ovinas. Revista Mexicana de Ciencias Pecuarias (México). 4:305-318. [ Links ]
Santoyo, V.H., P. Ramírez, y M. Suvedi. 2002. Manual para la evaluación de programas de desarrollo rural. Editorial Mundiprensa, Universidad Autónoma Chapingo-CIESTAAM. Chapingo, México. 245 p. [ Links ]
Stoneman, P. y Diederen, P. 1994. Technology Diffusion and Public Policy. The Economic Journal. (UK and USA). 104:918-930. [ Links ]
Tsai, W. y Ghoshal, S. 1998. Social capital and value creation: The role of intrafirm networks. Academy of Management Journal (USA). 41:464-476. [ Links ]
Zamudio, F. J. S., Corona, A. y A. López, I. D. B. 2008. Un índice de ruralidad para México. (Spanish). Espiral (México). 14:179-214. [ Links ]
Zarazúa-Escobar, J. A.; Almaguer-Vargas, G. y Márquez-Berber, S. R. 2011. Redes de innovación en el sistema productivo fresa en Zamora, Michoacán. Revista Chapingo Serie Horticultura (México). 17:51-60. [ Links ]
Zarazúa, J. A.; Almaguer-Vargas, G. y Rendón-Medel, R. 2012. Capital social. Caso red de innovación de maíz en Zamora, Michoacán, México. Cuadernos de Desarrollo Rural (Colombia). 9:105-124. [ Links ]
Zarazúa, J. A.; Solleiro, J. L.; Altamirano Cárdenas, R.; Castañón Ibarra, R. y Rendón Medel, R. 2009. Esquemas de innovación tecnológica y su transferencia en las agroempresas frutícolas del estado de Michoacán. Estudios Sociales (México). 17:37-71. [ Links ]
Received: February 2016; Accepted: May 2016
 Este es un artículo publicado en acceso abierto bajo una licencia Creative Commons
