


 nueva página del texto (beta)
 Artículo en XML
 Referencias del artículo
 Enviar artículo por email
 Citado por SciELO
  Similares en
SciELO
Similares en
SciELO 
 Permalink
Introduction
The geologic structure of Cuitzeo Lake is in the central part of Mexico (Figure 1), in the Trans Mexican Volcanic Belt (TMVB, Ferrari et al., 2012) within the volcanic zone known as the Michoacán-Guanajuato Volcanic Field (Ferrari, 2000; Gómez-Vasconcelos et al., 2015, 2020). Recent studies of the Cuitzeo Lake region have focused on the geothermal potential of this area (Gómez-Vasconcelos et al., 2021a; Pola et al., 2016; Trujillo-Hernández, 2017). Several geophysical studies reported anomalous behavior probably associated with magmatic ascent, related to the geothermal sources (Guevara-Alday, 2015). These sources are, in turn, related to the extensional phenomena associated with the Cuitzeo Lake graben (Israde-Alcantara & Garduño-Monroy, 1999; Garduño-Monroy et al., 2009). Olvera-García et al., (2020) established that this deep-seated geothermal system is buried under late Miocene-Holocene lacustrine sediments filling an extensional tectonic depression. Here, we focus on 2D and 3D, regional, gravity and magnetic field interpretations in this area, to highlight the main structural traits of the region to a depth of 7 km. Particular attention is given to areas with geothermal potential.
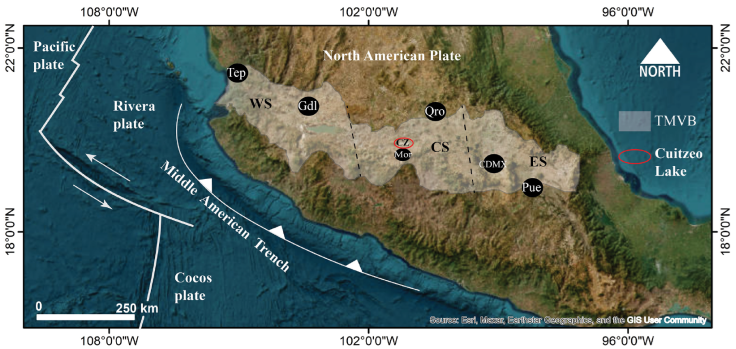
Figure 1 Location of Cuitzeo Lake (red ellipse) in the Central Sector (CS) of the Trans Mexican Volcanic Belt (TMVB, light brown). Parallel, dashed lines limit the sectors of the TMVB. CZ, Cuitzeo Lake. WS, Western Sector. ES, Eastern Sector (based on Correa-Gómez, 2019). Tep, Tepic. Gdl, Guadalajara. Mor, Morelia. Qro, Querétaro. CDMX, Mexico City. Pue, Puebla.
Regional geology
An extensional tectonic regime, with NNW orientation, originated the basin of Cuitzeo Lake in this volcanic region (Gómez-Vasconcelos et al., 2021a; Gómez-Tuena et al., 2007). Volcanic activity in the basin has been continuous since the Early Miocene to the Present; there are more than 50 volcanic chimneys, with associated structures such as scoria cones, lava domes, small shield volcanoes, and fissure lava flows (Israde-Alcantara & Garduño-Monroy, 1999; Garduño-Monroy et al., 2009; Pola et al., 2016; Trujillo-Hernández, 2017; Gómez-Vasconcelos et al., 2020, 2021a;). The mountain landscape is conformed by ignimbrites, lava flows, pyroclastic and volcanoclastic deposits (Pola et al., 2016), overlying a granitic basement (Trujillo-Hernández, 2017). Figure 2 shows the topography of the area, with Cuitzeo Lake exhibiting the lowest, regional elevations.
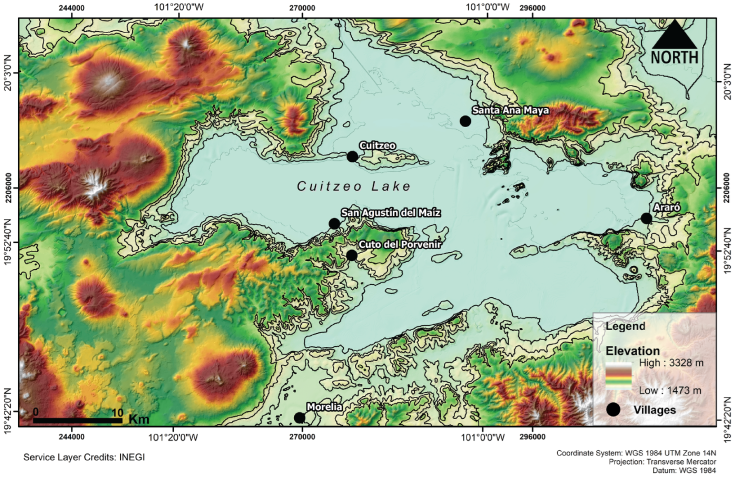
Figure 2 Topography around Cuitzeo Lake. Contours are at 50 m intervals between elevations of 1500 to 2000 m; these contours will be incorporated to the maps for reference. The highest elevation is at 2500 m. The lake is shallow, a few meters deep, and retreats considerably in some areas in the dry season. CU, Cuitzeo. AR, Araró, SAM, San Agustín del Maíz.
Tectonic activity in the central sector of the TMVB is indicated by widespread seismicity and earthquakes (M ≤ 5) with focal mechanisms ranging from transcurrent to normal (Quintanar et al., 2004; Quintanar et al., 2018; Suárez et al., 2019).
The geologic map appears in Figure 3. This map represents the main regional geological units, the dominant geological faults are represented by the black lines. The main rock units are basalts, andesites, tuffs and ignimbrites that belong to the Sierra de Mil Cumbres and some from the Caldera de Atécuaro (Garduño-Monroy et al., 2009). The topography of the area is conditioned by the structures of the Morelia-Acambay Fault System (Garduño-Monroy et al., 2009; Gómez-Vasconcelos et al., 2020; Israde-Alcantara & Garduño-Monroy, 1999) and the inferred Tzitzio-Valle de Santiago Fault. The semigraben and the graben of Cuitzeo can be observed in the central zone. The Morelia Acambay Fault System conditions the blocks of the Cuitzeo graben, mainly conformed by normal and listric faults. In addition, they are the main zones of geothermal fluid ascent as in the case of SAM in the area of Cuitzeo Lake (Garduño-Monroy et al., 2009; Israde-Alcantara & Garduño-Monroy, 1999; Olvera-García et al., 2020).

Data acquisition
Gravity and magnetic data were obtained in the study area; magnetic data correspond to the North America Magnetic Field data set (NAMAG, 2002); they were reduced to the pole according to the standard procedure (Baranod & Naudy, 1964). The Bouguer gravity anomaly (simple) data were obtained from the EIGEN 6C4 satellite-derived data set of the International Centre for Global Earth Models (ICGEM, Barthelmes and Kohler, 2016), with a node separation of .01º. For the topography we used the Digital Elevation Model (DEM) of ASTER (https://gdex.cr.usgs.gov/gdex/) with a 30 m resolution. Bouguer anomaly (BA) was obtained by the classical gravity anomaly minus the attraction of the Bouguer plate, calculated by the spherical approximation of the classical gravity anomaly minus 2πGρH, where the topographic heights H(λ,φ) are calculated from the spherical harmonic model of topography (ETOPO1) used up to the same maximum degree as the gravity field model, with ρ = 2670 kg/m3, and a resolution of 0.01º.
Figure 4 shows the magnetic map of the study area and Figure 5 shows the map corresponding to the gravity distribution. After the inversion process one obtains a distribution of magnetic susceptibilities in the case of the magnetic data, and a density distribution in the case of gravity data (Ellis et al., 2012; MacLeod and Ellis, 2013). Various examples of 3D inversions are available (e.g., Alvarez & Yutsis, 2015; Alvarez & Yutsis, 2017; Guevara et al 2021; Camacho and Alvarez, 2021; Alvarez and Camacho, 2023).
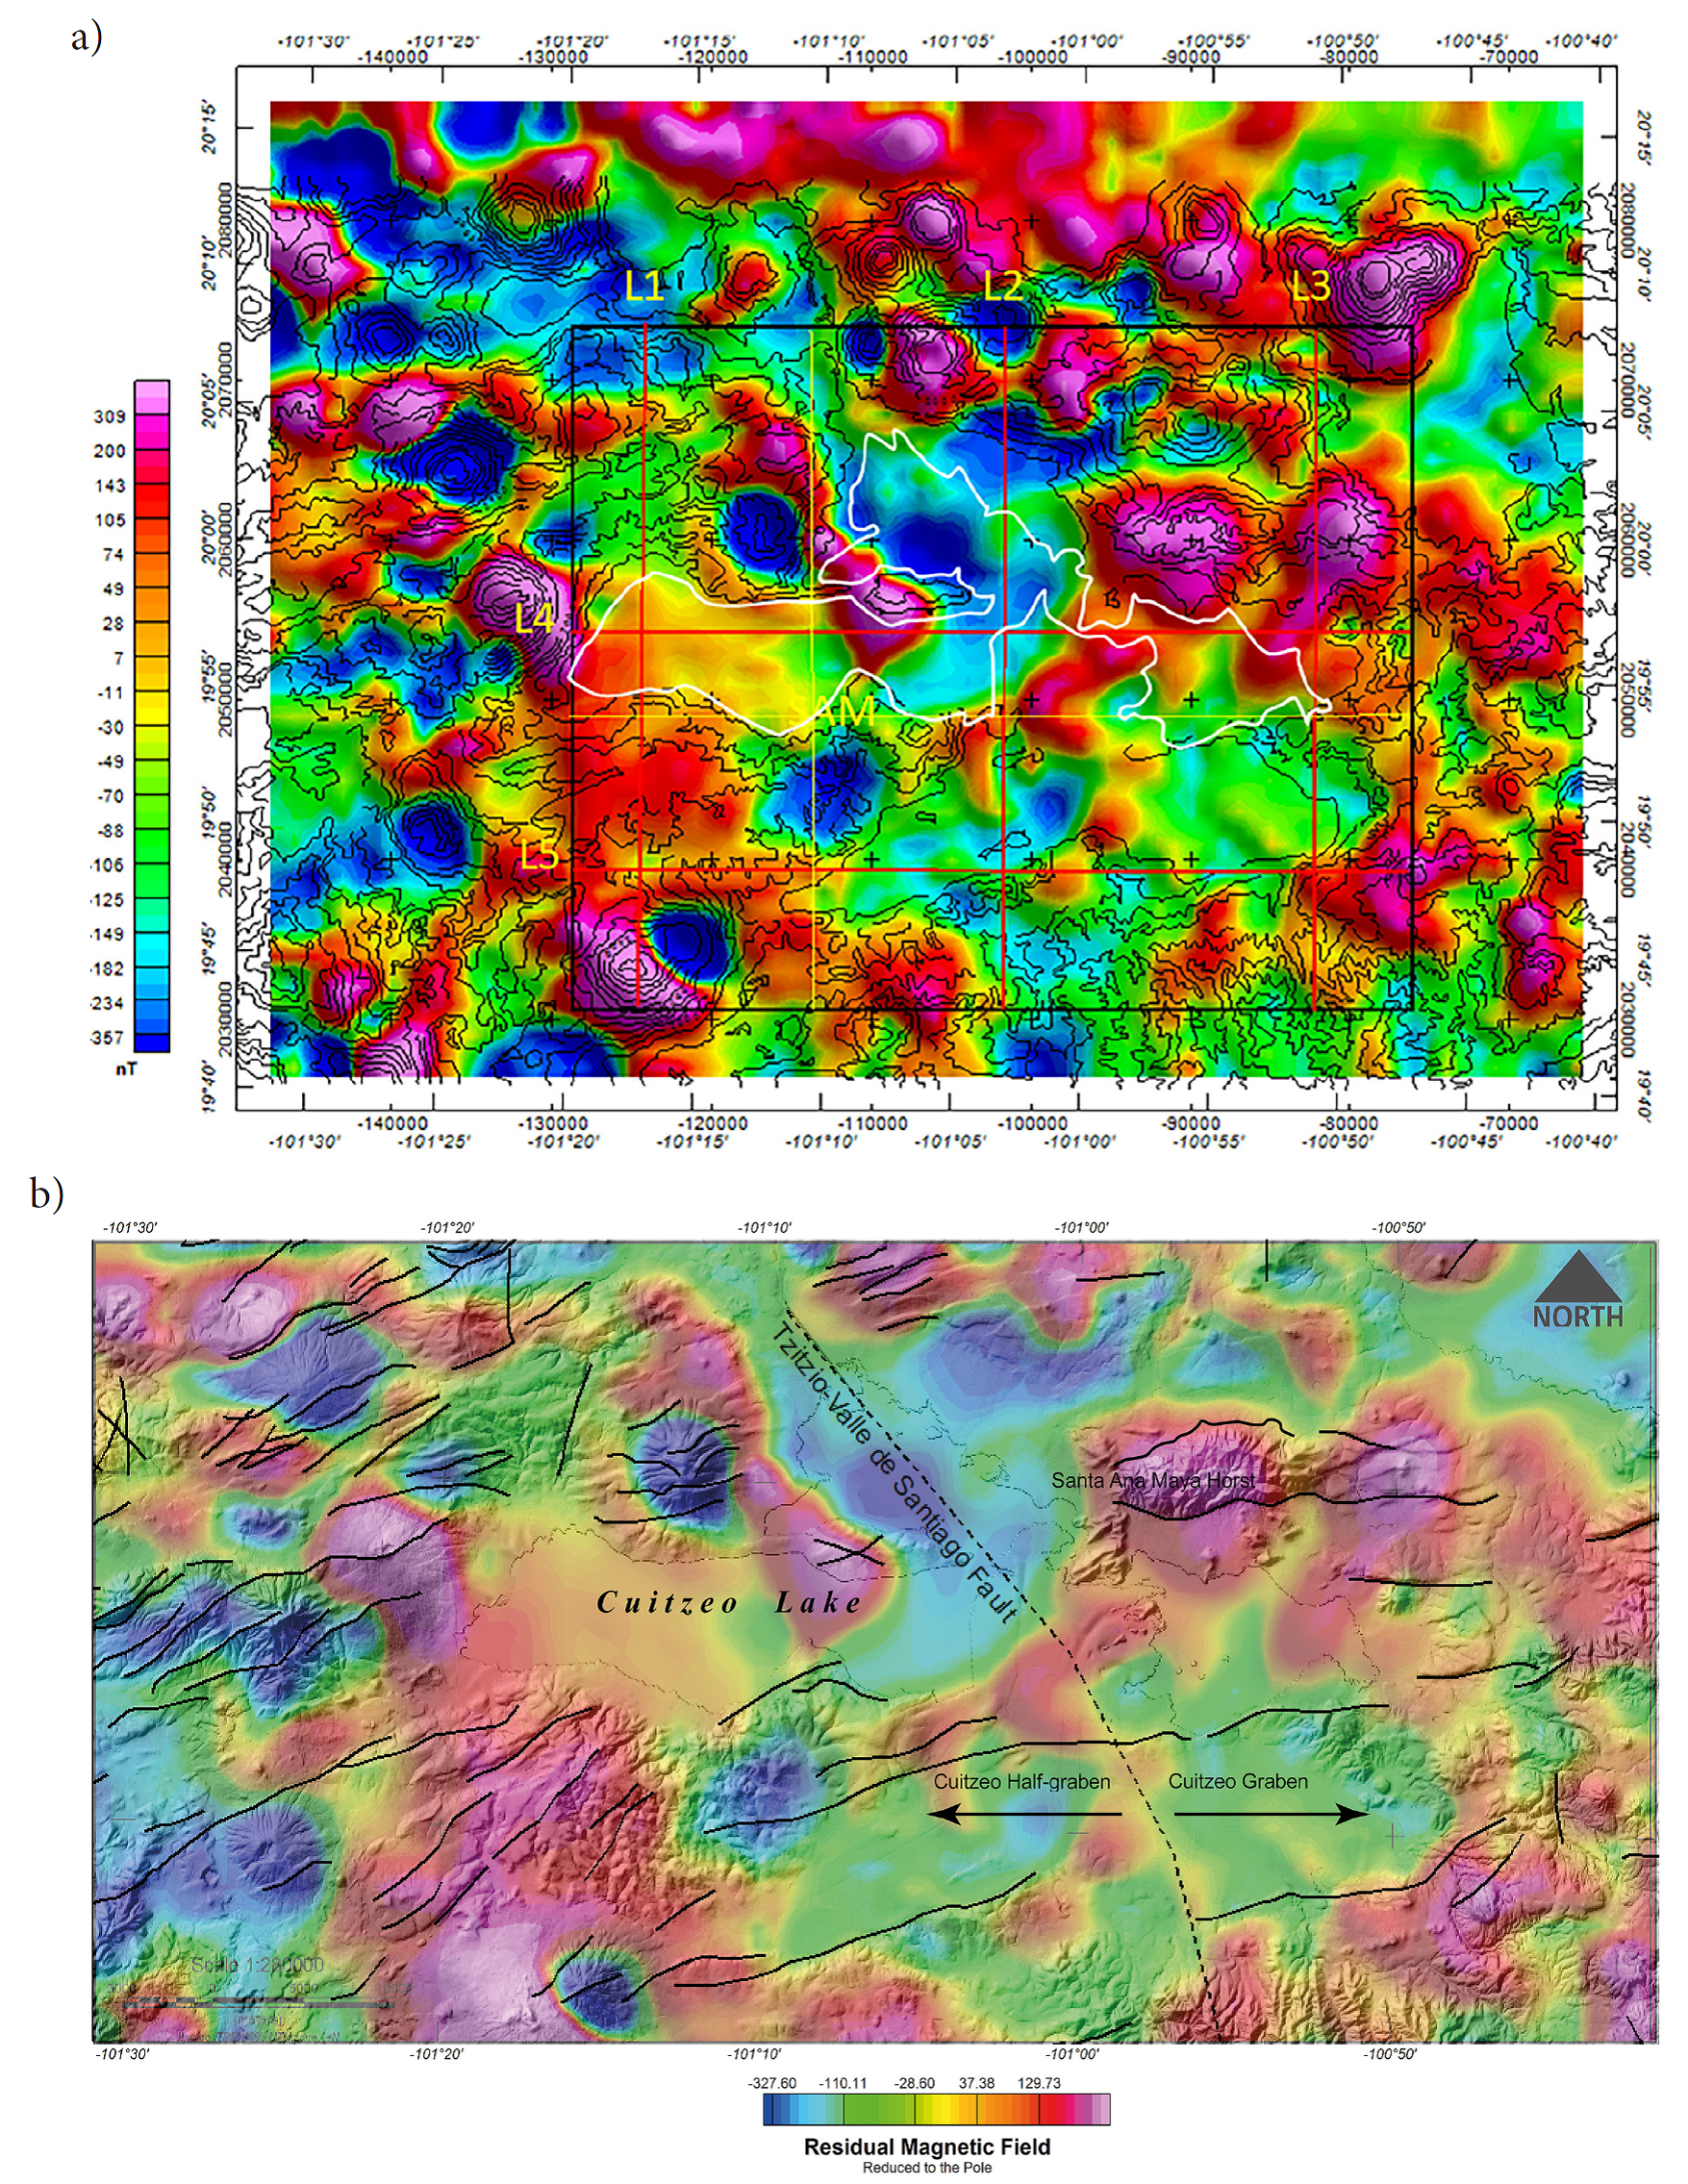
Figure 4 a) Magnetic map reduced to the pole of the Cuitzeo Lake region; elevation contours are shown for correlation, as well as the lake’s outline (white). The black rectangle indicates the region in which a 3D inversion of the magnetic field is performed; the red lines (L1-L5) indicate where magnetic susceptibility cross-sections are obtained from such an inversion. SAM, Location of San Agustín del Maíz at the intersection of the two, perpendicular, yellow lines. b) Magnetic map reduced to the pole (Baranod and Naudy, 1964), superposed to the geologic map in Figure 3. Parameter values of the magnetic field: Inclination 47.60º, Declination 7.47º.
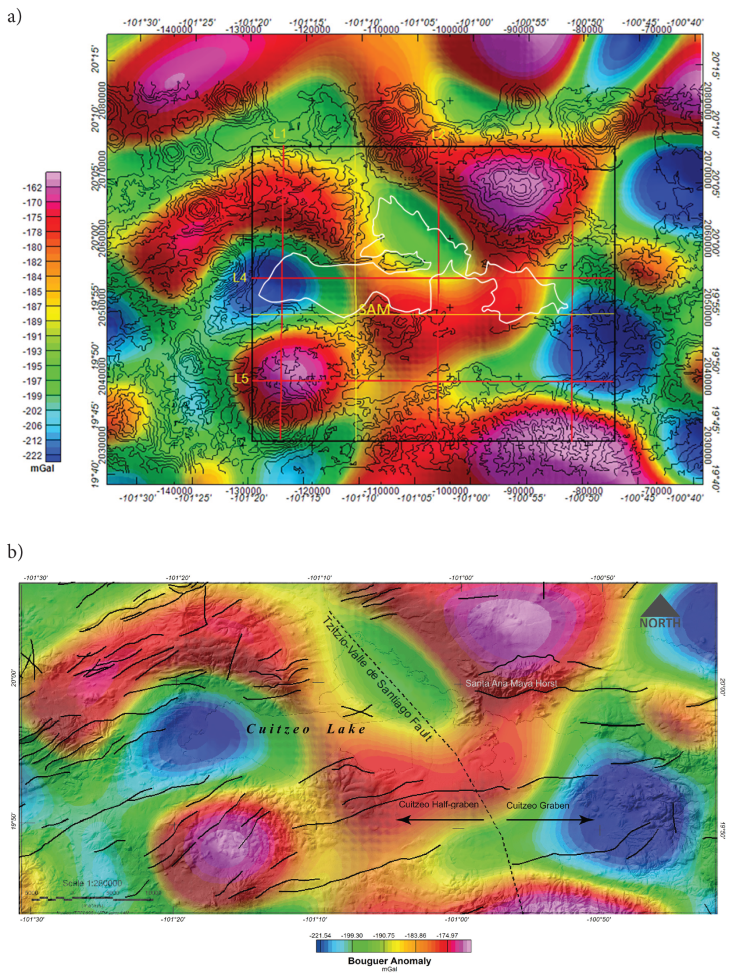
Figure 5 a) Bouguer anomaly (simple) map of the Cuitzeo Lake region; elevation contours are shown for correlation, as well as the lake’s outline (white). The black rectangle indicates the region in which a 3D inversion of the gravity field is performed; the red and yellow lines indicate where density cross-sections are obtained from such an inversion; red and yellow lines are identified as in Figure 4. b) Bouguer anomaly map, superposed on the corresponding portion of the faults in the geologic map of Figure 3.
The 3D inversion
We used the method described by Macleod and Ellis (2013) based on the theoretical considerations of Ellis et al. (2012) to perform the 3D inversions presented here. The code runs in the Oasis Montaj program of Geosoft, where a 3D mesh of parallelepipeds is established in the region to be inverted. The program uses a Cartesian Cut Cell algorithm (CCC) to represent geologic volumes whose values are modified to reach the observed gravity/magnetic response. An Iterative Reweighting Inversion algorithm (IRI, Ingram et al., 2003) is used to match the observed results with the calculated ones within established error limits; in the present cases is 5% of the standard deviation. It is expressed as the measure of errors between paired observations; in this case the gravity or magnetic field observed and the corresponding calculated field:
with
where yi is the prediction and xi is the true value.
The inversion results are provided as densities in g/cm3 when making a gravity inversion, and magnetic susceptibility (SI units) when performing a magnetic inversion. The depth of the inverted volume is proportional to the size of the volume selected for the calculation. Typically, areas of 50 × 50 km2 will attain depths of 5-6 km and greater depths can be obtained at the expense of the resolution. When referring to resolution we must bear in mind that there is the high-resolution of the data used to obtain the Bouguer anomaly in Figure 5a, in the gravity data case, and there is the resolution of the model proper. Models may have different dimensions and different resolutions; in this study we used models of dimensions in the X-Y plane of 1000 m, which we call the model resolution. To optimize computation, a subset of the high-resolution gravity data set is used, selected according to the model resolution, to perform the inversion. Figures 6a and 6b show the inverted volumes of the magnetic and the gravity inversions used in here; the latter shows the gravity station distribution used for that inversion.
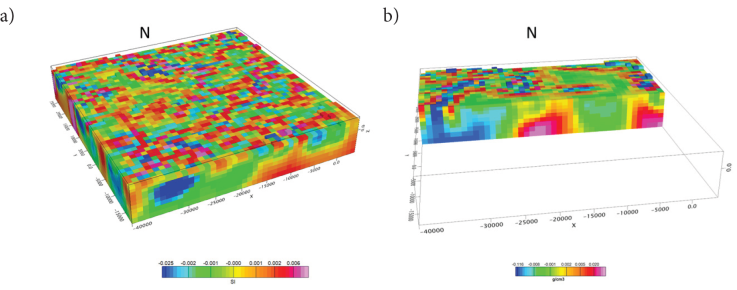
Figure 6 a) Full volume of the inverted model of the magnetic field reduced to the pole (Baranod & Naudy, 1964). b) E-W cross-section of the 3D gravity inversion showing the high-density (reds) and low-density (blues) voxels involved. Similar density cross-sections will be obtained along the yellow and red lines in Figure 5a, for the analysis of the density distribution. The mesh of points above the volume are the gravity stations used in the 3D inversion; the height of the stations is 500 m above the terrain. A similar set was used for inverting the magnetic data. Gravity scale + 2.67 g/cm3, magnetic scale +0.032 SI.
Results
1) San Agustín del Maíz 1000m
We analyze first the region of San Agustín del Maíz (SAM), for its geothermal relevance. Olvera-García et al., (2020) described its geothermal manifestations as distributed in an area characterized by fluvio-lacustrine sediments unconformably resting on volcanic rocks. They attribute the rising of geothermal fluids to permeable rock volumes located at the intersection of geologic fault systems where normal faults interact with transfer faults that together create rock zones of high permeability. High permeability usually implies high porosity and, consequently, low density values; density is one of the two variables that we use in our analysis, the other being the magnetic susceptibility. In the maps of Figures 4 and 5 two, perpendicular yellow lines show the location of two cross - sections that intersect in the vicinity of SAM; the N-S and E-W cross-sections appear in Figures 7 and 8, respectively. In each instance the density section (in g/cm3) appears above, and the magnetic susceptibility (in SI units +0.032 SI.) appears below.
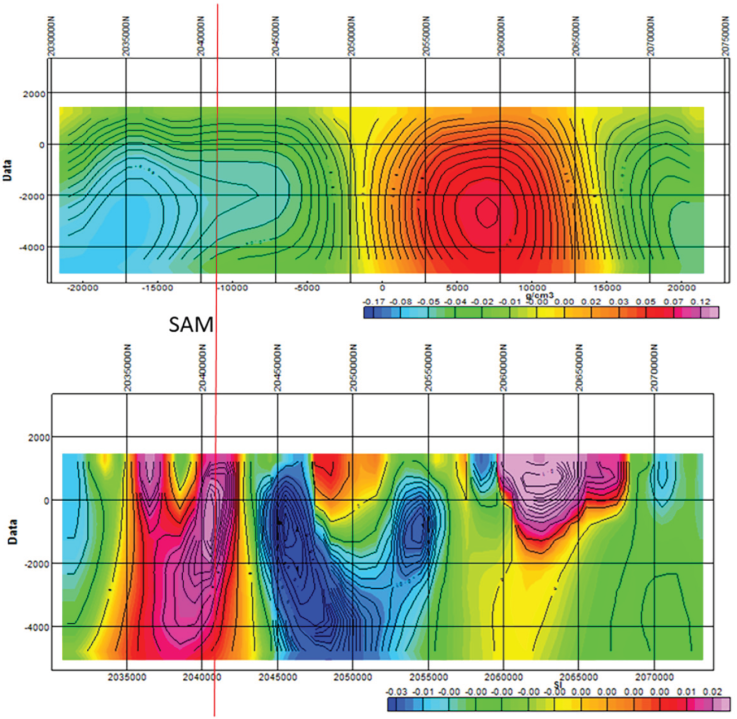
Figure 7 N-S cross-sections obtained from the 3D inversion of the gravity (above) and magnetic data crossing the location of San Agustín del Maíz (thin, red line). See Figures 4 and 5 for the location of the cross-sections. The horizontal scales are matched. Gravity scale + 2.67 g/cm3, magnetic scale +0.032 SI.
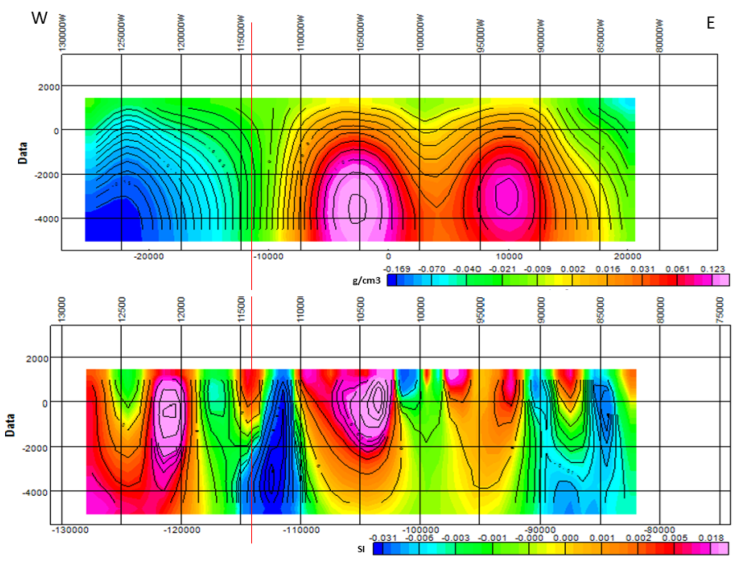
Figure 8 E-W cross-sections obtained from the 3D inversion of the gravity and magnetic data crossing the location of San Agustín del Maíz (thin, red line). See Figures 4 and 5 for the location of the cross-sections. The horizontal scales are matched. Gravity scale + 2.67 g/cm3, magnetic scale +0.032 SI.
In Figure 7, the density cross-section shows an important low-density region centered at -3000 m extending to the N, with a minimum at -2000 m under the location of SAM, suggesting that the low-density region feeds the geothermal manifestations in SAM. The presence of thermal springs and siliceous sinter deposits west of SAM (Olvera-García et al., 2020) tend to confirm our observations. We consider the association of low-density regions with high temperatures as favorable to geothermal sources, since it may contain fluids at high temperatures that decrease magnetic susceptibility, and low-density, porous materials allowing fluid circulation. Continuing northwards, there is a considerable block of high-density material. The magnetic susceptibility cross-section shows a chanel of low-susceptibility, rising from the bottom of the model (-5000 m) that emerges at the location of SAM (thin, red line).
The boundary between the regions of high- and low-susceptibility regions is conspicuosly associated with the normal fault through SAM, reported by Olvera-García et al (2020); the region of minimum susceptibility extends down to -5000 m showing some obliquity and confirming that these are deep-seated faults. Given the associated thermal manifestations in the surface, we conclude that the low-susceptibility of this region arises from materials subject to high temperatures, probably reaching close to the temperature of the Curie isotherm (Ravat, 2000). The simultaneous presence of the low-density material, as shown by the density cross-section, and the outcropping region of low-susceptibility, suggest that the surface geothermal manifestations are fed from a deep source, extending below -5000 m. A bifurcation to the N, of the low- susceptibility conduit is observed starting at -3000 m, which also reaches close to the surface; this region also appears of geothermal potential and should be further analyzed by other means. A good portion of the high-density region is also occupied by high-susceptibility geologic formations; the joint effect of high density and high susceptibility suggests the presence of cold, volcanic materials emplaced significant time ago.
The density low observed in the southern portion of Figure 7, appears to extend westward in Figure 8, constituting a major anomaly in that region. The low-susceptibility region associated with the location of SAM (thin, red line) also appears bifurcated in this cross-section, hinting there is a circular distribution of low-susceptibility materials on the surface. The two density maxima correspond to two high-susceptibility regions. At the esatern end of the line, there is a similar distribution of low-density materials, with a shallow, central, high-susceptibility region, which is occupied by a density section, transitional between high- and medium-density.
We conclude that the density and magnetic susceptibility signatures around SAM are consistent with a region of high temperature of, at least 7 km depth and 20 km in length in the N-S direction, and 15 km in the E-W direction. With the help of X-ray analysis (DRX) Trujillo-Hernández, (2017) concludes that the abundant concentration of hydrothermally altered minerals, as well as the geologic evidence showing a high-degree of fracturing, mainly on the basaltic andesite lava flows, suggest that the chemical components travelled large distances, closing that the transport of hydrothermal fluids occurs mainly by infiltration.
With the experience gained analyzing the responses of the SAM region containing geothermal manifestations, we proceed to the analysis of L1-L5 cross-sections.
2) The N-S Lines
Here we analyze the group of three N-S lines labeled L1-L3 in Figure 4.
L1 is the westernmost line, oriented N-S. The density cross-section exhibits a large negative anomaly well constrained by two high-density regions with vertical boundaries F1, F2; it resembles a graben structure, but lacks an extended graben axis. The lowest density values are close to the 5 km depth, probably linked to the corresponding anomalies in the N-S and E-W cross-sections of SAM (Figures 7 and 8). The central portion of the magnetic susceptibility cross-section shows structural characteristics similar to those of the central anomaly of the density cross-section; that is, it has the same width and depth. The bounding limits F1 and F2 are followed by a low and a high susceptibility region, respectively. From these observations we conclude that the central region of this cross-section is a major anomaly of geothermal potential.
L-2 presents structural characteristics like those observed along L1. There is a main low-density region, not centered but slightly displaced to the N, also bounded by two high-density regions, whose boundaries also reach to the bottom of the cross-section. Given the density similarities between L1 and L2, and their proximity, one would tend to connect the main low-density anomalies; however, from Figure 5a one can see that they are separated by a region of high gravity values, which prevents such a connection. The corresponding region in the magnetic susceptibility cross-section, exhibits a bifurcation of the low-susceptibility region, similar to the one displayed in Figure 7, that surfaces at the F2 boundary, indicating that it also may represent the source of a potential geothermal area. Of particular interest is noting that this isolated anomaly is crossed by the Tzitzio-Valle de Santiago fault (see Figure 3), which may have facilitated the intrusion of a heat source at depth.
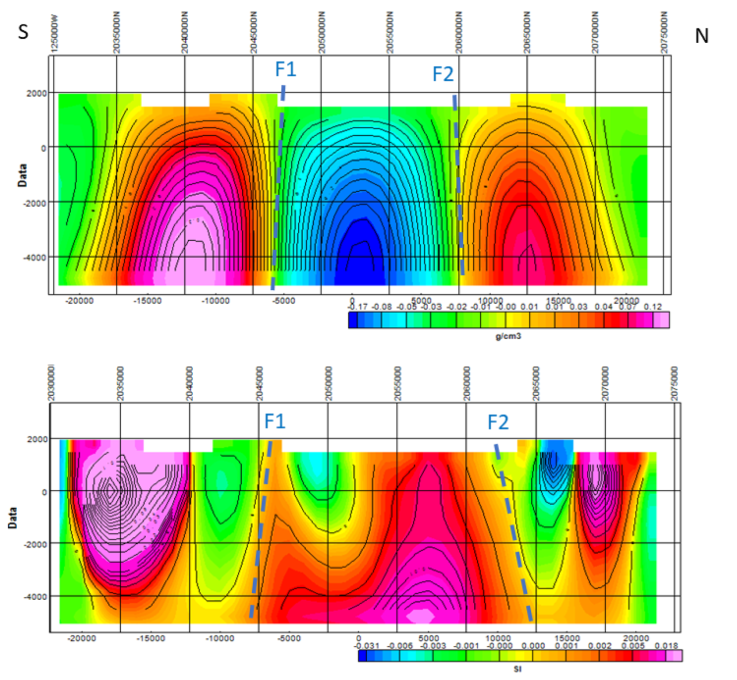
Figure 9 L-1, N-S cross-sections obtained from the 3D inversion of the gravity (above) and magnetic data. See Figures 4 and 5 for the location of the cross-sections. The horizontal scales are matched. F1 and F2 represent boundaries between contrasting properties in the cross-sections. Gravity scale + 2.67 g/cm3, magnetic scale +0.032 SI.
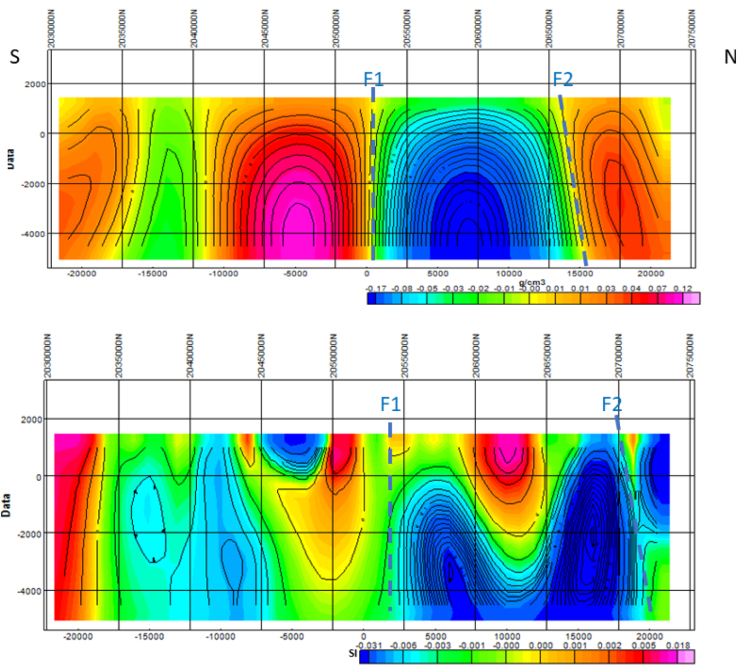
Figure 10 L-2, N-S cross-sections obtained from the 3D inversion of the gravity (above) and magnetic data. See Figures 4 and 5 for the location of the cross-sections. The horizontal scales are matched. F1 and F2 represent boundaries between contrasting properties in the cross-sections. Gravity scale + 2.67 g/cm3, magnetic scale +0.032 SI.
According to Trujillo-Hernández (2017) this fault, that cuts through Cuitzeo Lake, is the most important NNW-SSE construct, defined as an old, buried fold-fault structure, responding to the present stress regime as a right-lateral fault. This system is presently active, cutting from old Early Miocene formations to Recent soils and volcanoclastic formations.
This line samples the Cuitzeo graben (Figure 5b) from S to N. It presents a different behavior from those observed at L1 and L2, since the low-susceptibility region at the center of the section corresponds with a high-density region in the density section, flanked by low-density areas which, in turn, correspond to two high-susceptibility regions.
3) The E-W cross-sections
Lines 4 and 5 in Figure 4 are the two E-W cross-sections that appear in Figures 12 and 13, respectively.
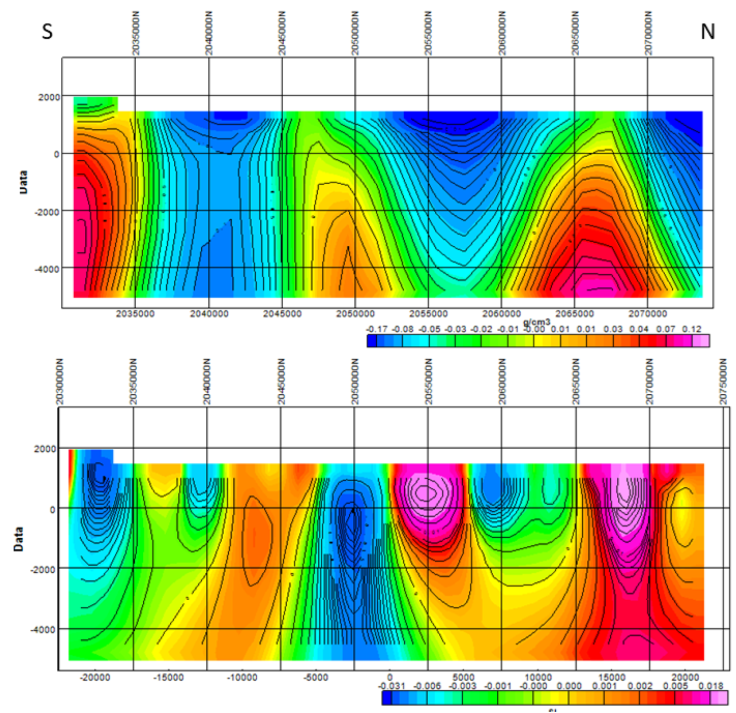
Figure 11 L3 N-S cross-sections obtained from the 3D inversion of the gravity (above) and magnetic data. See Figures 4 and 5 for the location of the cross-sections. The horizontal scales are matched. Gravity scale + 2.67 g/cm3, magnetic scale +0.032 SI.
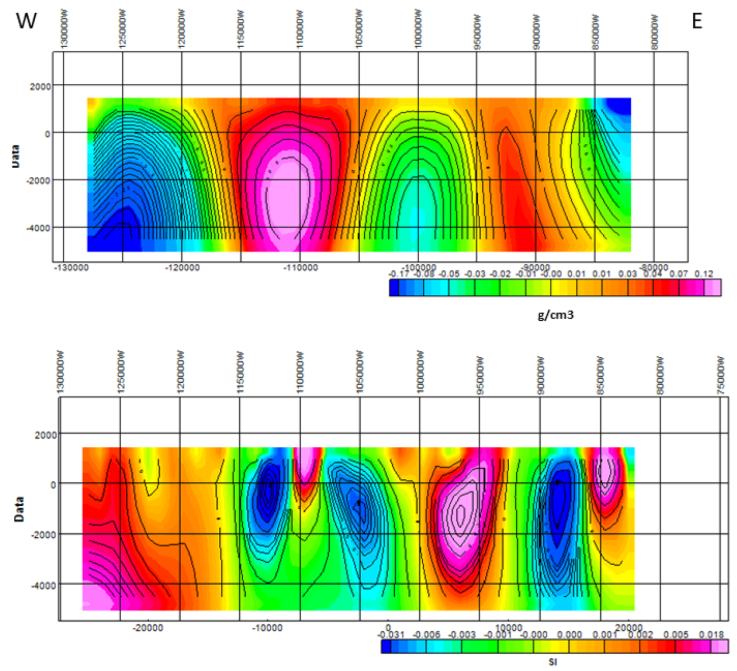
Figure 12 L4 in Figure 4, showing the cross-sections of density and magnetic susceptibility along the E-W direction; the horizontal scales are the same. Gravity scale + 2.67 g/cm3, magnetic scale +0.032 SI.
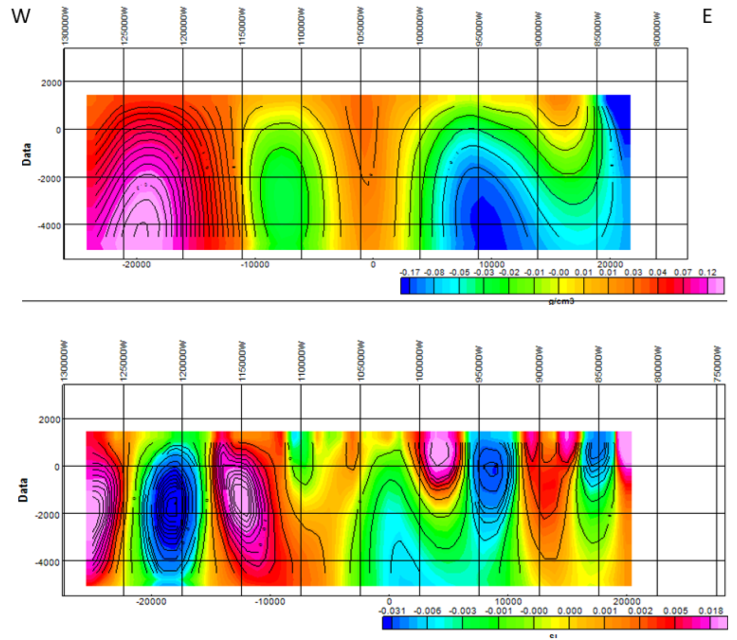
Figure 13 L5 in Figure 4 showing the cross-sections of density (above) and magnetic susceptibility, along the E-W direction; the horizontal scales are equal. Gravity scale + 2.67 g/cm3, magnetic scale +0.032 SI.
L4 crosses the study area from W to E (Figure 4). Regions of low and high density alternate in the cross section, corresponding to the low and high values of the BA; the density cross-section shows that transitions from low- to high-density regions reach vertically the full depth of the inversion (from +2000 m to -5000 m), suggesting a tectonic control of the distribution of geologic materials. The magnetic susceptibilty cross-section shows that the portion corresponding to the high-density section has low-susceptibility regions similar to those observed in SAM (Figure 7), also divided by a small, high-susceptibility region, suggesting that this anomaly distribution occupies a considerabe area of this region. Close to the end of the line (88000E or 100º-53’) in the N side, a negative low-susceptibility region with deep roots reaches the surface; it corresponds to a medium-density region, which could also be considered a potential exploration target for geothermal objectives, since it appears close to the south fault of the Santa Ana Maya horst (Figure 5).
L5 samples the S portion of the study area from W to E. The pattern observed in L4 regarding the vertical boundaries between high- and low-density regions is observed in two thirds of the length of L5, noticing a considerable departure from this behavior in the N portion of this section, where low density distributions predominate. There, the minimum of the low-density portion is located at -4000 m depth; this anomaly outcrops almost directly above this minimum. At the E end of L5 there is another outcropping region of low density, except it has density values like those observed at the anomaly located at -4000 m, making it another potential target for geothermal evaluation.
The magnetic susceptibility cross-section shows a low-susceptibility region well constrained by high-susceptibility regions, extending from the surface to -5000 m depth, corresponding with the high-density region. At the E end of the line, there is a good match of shallow, low-susceptibility regions with the low-density regions reported above as potential geothermal targets, reinforcing such a statement.
4) Geosurfaces
A geosurface is obtained from an inverted volume, as the region in which the volume has a constant value, in g/cm3 if the inverted volume is a density distribution, and in SI units if it is a distribution of magnetic susceptibilities. Geosurfaces complement observations made with the cross-sections.
A set of calculated density geosurfaces is in Figure 14; they range from 2.76 to 2.46 g/cm3; in the calculation, the whole inverted volume is scanned to determine where those density values are located and, then plotted. The blue surfaces are close to the vertical and, in the present case, extend from the surface to the bottom of the inverted volume, or about 7 km in depth. We searched for lower densities, down to 2.46 g/cm3, finding only two locations in which they are present; they are labeled as A1 and A2 in Figure 14. A1 is located close to the geothermal manifestations in SAM, and we submit that this is most likely the heat source feeding these geothermal manifestations. In A2 the green surface is cut to allow looking at the orange surface; below it, we could not locate a magenta surface. A2 is traversed by the Tzitzio-Valle de Santiago fault (Figure 5) and we propose that it should be considered a geothermal exploration target, for its similarity with A1. The geothermal fluids can pass through the impervious cover owing to the persistent tectonic activity maintaining the permeability.
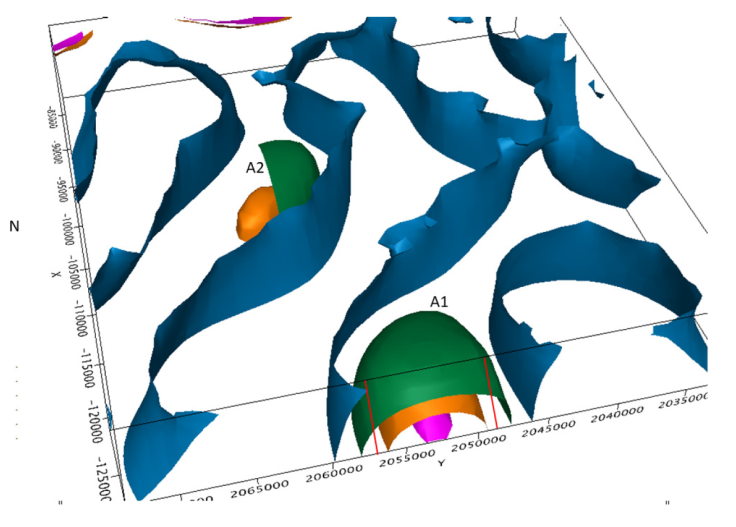
Figure 14 3D display of geosurfaces for various densities (g/cm3): blue (2.76), green (2.66), orange (2.56), magenta (2.46). North is to the left; this view allows to appreciate how low-density varies with depth in anomaly A1; the green geosurface, in anomaly A2, is clipped to allow viewing the orange surface, no magenta surface is present. The brown, dashed line crossing the figure from N to S is the trace of the Titzio-Valle de Santiago fault. The red line is the outline of Cuitzeo Lake.
In Figure 14 there are four geosurfaces of different colors, corresponding to four density values. The geosurfaces in blue call the attention, since they start at the surface and end at the bottom (7 km) of the inverted volume, following vertical, or close to vertical inclinations; furthermore, they are thin, and cross the study area in various directions, restraining the regions of high gravity values, as seen in Figure 15, where we have superposed the geosurfaces to the BA map. We interpret them as vertical, boundary, or transitional regions, between high- and low-density regions, yielding the observed responses. Portions of these boundary surfaces are also present in the cross-sections presented above; in some places they may be identified with faults bounding the low-density regions.
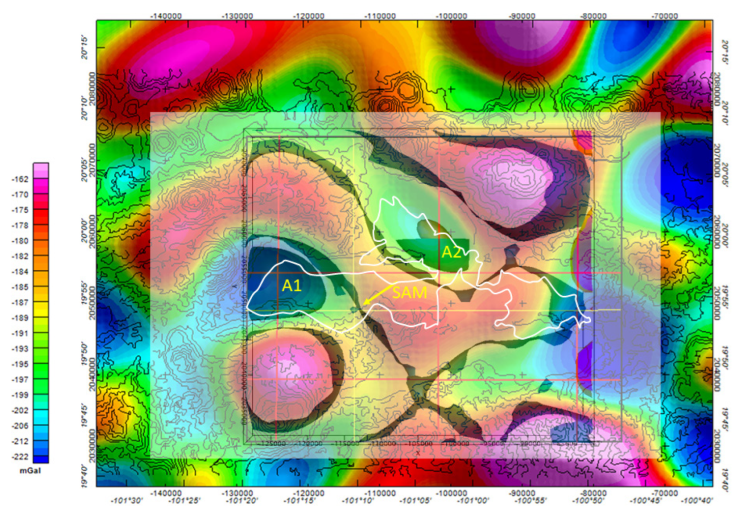
Figure 15 Vertical view of the geosurfaces obtained from the 3D gravity inversion, superposed (gray rectangle) on the BA map. A1 and A2 are the anomalies indicated in Figure 14. Red and yellow lines are labeled in Figure 4. The lake’s outline in white.
If we consider the superposition of the inverted results over the Bouguer anomaly map, in Figure 15, we note i) that the surface geothermal manifestations of SAM are located over one of these blue geosurfaces, and ii) that they are quite close to the anomalous density region A1, shown in section in Figure 14. Since there are only two anomalies with low-density characteristics in the inverted 3D region, A1 and A2, we infer that they are potential heat sources for geothermal fluids. The proximity of anomaly A1 to SAM, also illustrated in the density cross-section of Figure 6, tends to validate our inference. Although there appear to be no surface, geothermal manifestations in the region of anomaly A2, it should be considered a potential exploration target; the center of the anomaly is located 11 km E of Cuitzeo del Porvenir town, over the Tzitzio-Valle de Santiago fault (see Figure 3).
Figure 16 shows the vertical superposition of density geosurfaces, with some transparency, and susceptibility prisms of values between 0.042 and 0.012 SI. We observe two branches (NW and SE) and a central channel between them, oriented SW-NE; the latter shows a minor presence of prisms with such values. At present we cannot offer a hypothesis about the reason for this peculiar susceptibility distribution. The NW branch exhibits concentrations of these prisms in the rim of A1 (at SAM) and in the location of A2 (see Figure 15), allowing the association of these susceptibility concentrations with such anomalous regions. The largest concentration of prisms in the SE branch may be associated with the eastern portion of L4 (Figure 12).

5) 2D model
To complement these results and discussion, we calculated several 2D models to ascertain the regional structural characteristics of the area; an example appears in Figure 17 displaying the resulting model along L1. It shows that andesitic formations dominate the region and comprise the high-density regions, whilst the central portion contains conglomerates and sediments of approximately 500 m depth, overlaying a volcanic formation. The deepest layer is the granitic basement. Andesites appear to be the geologic formations sealing the geothermal fluids heated by intrusions. Tectonic movements and geologic faults must create the paths through which these fluids reach the surface at several locations. In particular for this model, the SW-NE fault system identified in Figure 3 intersecting Cuitzeo Lake, with one of its components going through SAM region, appears to be the one controlling fluid migration.
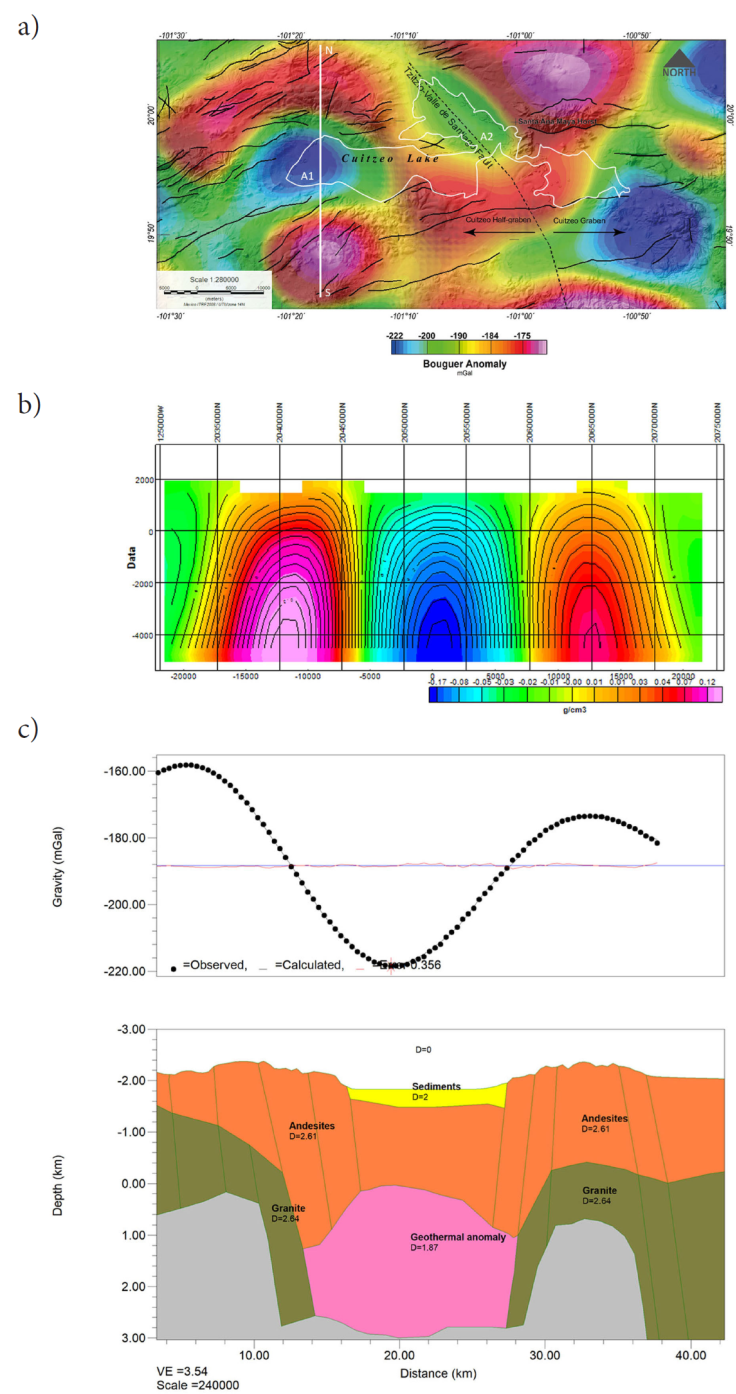
Figure 17 Two-dimensional gravity model along L1. a) N-S line L1 in which the model is calculated; volcanic products dominate the background. The Bouguer anomaly is superposed to a topography map (Figure 5) where several locations are identified, b) cross-section derived from the inverted density volume with a resolution of 1000 m, and c) 2D model 5 km in depth identifying geologic formations along the cross-section; distributions of Miocene to Quaternary andesitic lavas and dacitic ignimbrites described in Figure 3. A region, designated geothermal anomaly, is emplaced below sea level (0 m elevation) coinciding with A1 in Figure 14; an intrusive body may be responsible for the graben-like structure in the surface, and for the location of a low-density, high-temperature region. We define the geothermal anomaly as the joint occurrence of heated regions, fluid sources, and confining geologic structures.
Conceptual model
A conceptual model is shown in Figure 18, of an intrusive body causing the materials and fault distribution in the model of Figure 17, particularly the downward displacement of the region corresponding to Cuitzeo Lake. This intrusive is also the heat source for the geothermal manifestations. Motion along geologic faults would assist the flow of geothermal fluids reaching the surface.
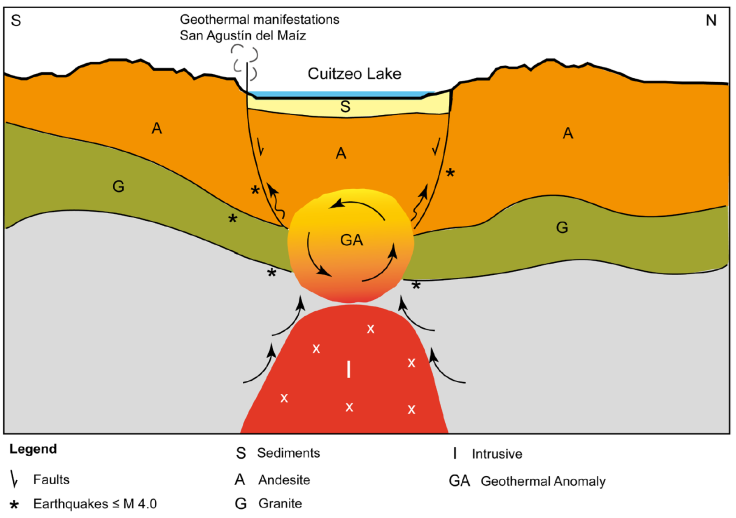
Figure 18 Conceptual model of the geothermal system feeding San Agustín del Maíz, in Cuitzeo Lake. The intrusive body heats the geothermal anomaly; its emplacement induces motion along the fault system, which in turn generates small magnitude earthquakes. Units described as sediments, andesite, and granite are only indicative of the type of rocks located in those regions. The gray region represents basement rocks containing an igneous intrusion I.
Conclusions
The 3D inversion of gravity and magnetic data provided volume distributions of density and magnetic susceptibility that reproduced the observed fields within 5 percent of the respective standard deviations. From these results, we extracted cross-sections and geosurfaces that allowed the location of regions of potential geothermal interest. Analysis of two perpendicular cross-sections at a location with surficial geothermal manifestations (SAM) provided criteria that were used to analyze the whole inverted volume. We established that vertical boundaries between neighboring density and magnetic susceptibility regions, often extended throughout the entire thickness of the cross-sections (7 km), suggesting that such boundaries may be associated with deep geologic faults. We propose that the SW-NE trending fault system in Figure 3, is responsible for geothermal fluid migration in the SAM region. With these results, however, we cannot establish a uniform criterium, such as the association of low-density regions with regions of low susceptibility, to establish the existence of geothermal sources. We found zones in which, in addition to the above combination, regions of high density and low magnetic susceptibility, or high density and high susceptibility, may also represent potential geothermal targets in the surveyed region. More research is needed in this direction to characterize regions of geothermal potential. Concurrence of other geologic and geophysical methods will help refine the location of geothermal targets.
We conclude that the detection of geothermal exploration targets, using gravity and magnetic fields, is viable when adequate data sets are used; however, we recognize that, given the nature of the potential fields, results should be taken only as indications of the existence of such regions. Additional exploration methods should complement the results presented in this contribution. The advantage of using Potential Methods in exploration geophysics is that data is often available free, and large areas can be explored with limited resources before more costly methods can be applied. Data resolution should also be of primary concern when using this methodology; higher-resolution data sets will allow for a finer location of potential targets.

