


 nueva página del texto (beta)
 Inglés (pdf)
 Artículo en XML
 Referencias del artículo
 Enviar artículo por email
 Citado por SciELO
  Similares en
SciELO
Similares en
SciELO 
 Permalink
PACS: 75; 65; 64
1.Introduction
Cervical cancer is a disease whose cases are increasing in women over 30 years becoming the most common cancer in mexican women. Cervical cancer is a malignant tumor that starts in the cervix and the Pap test is the easiest way to detect it. This test involves inserting a vaginal speculum that allows us to look at the cervix and take a sample of cells, which are analyzed to identify whether they are normal or show any alteration. Early detection is critical to the patient’s life so that the implementation of new, more reliable, faster and less invasive techniques is critical to address this public health problem.
In recent years, the health and academic institutions have been committed to the challenge of eliminating the suffering and death by cancer, harnessing the power of nanotechnology to radically change the way to diagnose, treat, and prevent cancer. In the particular, biomedical research has taken the lead in integrating nanotechnology through a variety of programs.
In nanotechnology, the nanoparticles have impacted strongly on biomedical research. In the case of the metal nanoparticles, the interaction between electromagnetic radiation and particle presents special characteristics due to quantum effects that occur in these systems. In particular, metal nanoparticles support localized surface plasmon that determine its unique optical properties. The resonant excitation of the plasmon produces a huge enhancement of the electromagnetic field in the vicinity of the nanoparticle surface. This phenomenon has interesting applications in optical spectroscopy, particularly Raman scattering1.
Raman spectroscopy provides a highly specific molecular information and allows analysis of mixtures composed of several components. In Raman spectroscopy, a laser beam excites molecules in the samples and an inelastic scattering effect of the incident photons is observed resulting in a change in their energies (Raman shift). A spectrometer counts the scattered photons and measures the intensity and energy change or Raman shift of the resultant light in units of per centimeter. Nevertheless, this technique has the disadvantage of low intensity in the signal. Nanotechnology impacts strongly on the Raman spectroscopy due that in the presence of nanoparticles, the Raman signal is enhanced to the levels sufficient to detect a single molecule. Therefore, Surface-Enhanced Raman Scattering (SERS) is currently recognized as a detection technique extremely sensitive with high levels of molecular specificity1,2. Thus in biomedical research, SERS technique has been applied to study the biochemical components inside breast cancer single living cells (3), differentiated intestinal epithelial cells4 and escherichia coli cells5 by depositing into them gold, silver or ZnO nanoparticles. Our research group already applied the technique in serum samples with colloidal gold and silver nanoparticules6. Particularly strong field enhancement can be observed when colloidal nanoparticles form colloidal clusters.
Conventional Raman spectroscopy technique has showed to be an excellent technique to detect the breast cancer using biopsies7 and serum samples (8), cervical cancer (9), leukemia (10), neuroblastoma and ganglioneuroma (11). Similarly, SERS technique has been used for gastric (12) and breast (13) cancer detection based on blood plasma and combining with membrane electrophoresis, Lin et al(14) developed a method for cancer detection.
In these works, Principal Component Analysis (PCA) is used to classify the Raman and SERS spectra. PCA is a way of identifying patterns in data, and expressing the data in such a way as to highlight differences. When the principal component loading are plotted as a function of different variables, they reveal which variable accounts for the greatest difference.
In this paper we propose the use of nanotechnology in biomedical research and in particular, metal nanoparticles are used in the detection of degenerative diseases using serum samples. This is the first report in the cervical cancer detection based on serum SERS.
2. Method
The serum samples were obtained from 14 patients who were clinically diagnosed with cancer and 14 healthy volunteer controls from Instituto Mexicano del Seguro Social in Guadalajara and León cities. The age of patients at diagnosis was between 18 and 50 years. None of the patients were under chemotherapy cancer treatment. In most cases, the hospitals provided the serum samples already prepared and few blood samples were centrifuged in our laboratory to obtain serum. Written consent was obtained from the subjects, and the study was conducted according to the Declaration of Helsinki.
For SERS technique, a same amount (1 ml) of serum and colloidal silver nanoparticles were mixed in a vial. For a better distribution of the nanoparticles in the serum and as an attempt to attach them to serum constituent molecules, the vial containing the mixture was subjected three times to ultrasound for 10 minutes, leaving to stand for 1 hour after each sonication. Finally, we performed the Raman measurements of obtained mixture.
We tried different concentrations of nanoparticles (0.25, 0.5, 0.75, 1.0, 1.25 and 1.5 ml) in 1 ml of serum sample, resulting 1 ml the optimal amount.
In order to measure the Raman spectra of the serum sample with silver nanoparticles (SERS spectra), a drop of 40
Different sizes of silver particles (10, 20, 40, 60, and 80 nm) were analyzed determining that the nanoparticles 40 nm were those that showed better SERS spectra of the serum samples. Thus, the silver nanoparticles 40 nm were used in this study of cervical cancer detection. The nanoparticles were purchased from Sigma Aldrich and Ted Pella, Inc. companies. The silver nanoparticles contained sodium citrate as stabilizer.
About 10 SERS spectra were collected of each serum sample focusing the laser at different points of the samples with an exposure of 20 seconds per spectrum. A total of 287 SERS spectra with 143 spectra from 14 control patients, 144 spectra from 14 cervical cancer patients. Details of the samples used in the study are shown in Table I.

After measuring all SERS spectra in the presence of nanoparticles, the mean spectrum of each group was calculated and analyzed to obtain general biochemical information for each data group and identify the enhanced Raman bands or regions15,16.
Raw SERS spectra were processed by carrying baseline correction, smoothing, and normalization to remove noise, sample florescence, and shot noise from cosmic rays17 and then analyzed using PCA y LDA.
3. Results and discussion
SERS study have also been performed on serum samples from cervical cancer and control patients using colloidal silver nanoparticules of 40 nm. Due to its chemical inactivity, silver should be the more suitable metal for mixing with serum samples. Like Kneipp et al(18) shown, we observed that when the laser is focused on the regions where silver colloidal clusters are formed good SERS enhancement factors are obtained. Figure 1 shows the comparison of a conventional Raman and SERS spectrum, observing clearly enhanced Raman bands. In order to obtain these spectra from the serum of one patient, we took a certain amount of the sample and measured conventional Raman spectrum shown in Fig. 1 and another quantity of the same serum was taken for being prepared with silver nanoparticles of 40 nm according to what was described in the methodology section, obtaining the SERS spectrum shown in Fig. 1. Raman shift range that showed strongly enhanced bands was 600-1800

In Fig. 1, we observed those strongly enhanced bands as 446 (Glutathione), 526 (Tryptophan), 809 (Tyrosine), 839 (Tyrosine), 897 (COC str), 938 (Skeletal str
Once that showed that the SERS technique works, SERS spectra of all samples were measured and obtained the mean SERS spectra of the cervical cancer and control samples to identify the main biomolecules that allow us to discriminate between control and cancer samples. Figure 2 shows the mean SERS spectra of the control and cervical cancer samples, observing some differences between them.

As in the study of cervical cancer using conventional Raman spectroscopy (9), the control serum spectrum (Fig. 2) showed the presence of high amounts of carotenoids indicated by peaks at 1002, 1155, 1167, and 1523
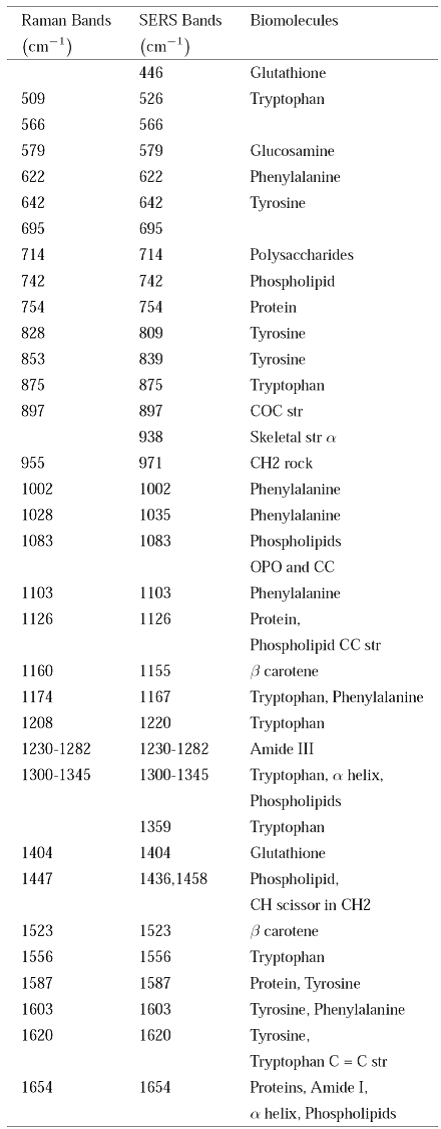
Table II shows the main bands observed in the control and cervical cancer SERS spectra and the corresponding assignment of biomolecules (15,16). Also, Table II shows these bands of the conventional Raman spectrum (Raman bands) with their corresponding shifts (SERS bands) due SERS effect, so as those which remained unchanged (see Figs. 1 and2).
Table II Main bands observed in control and cervical cáncer serum spectra and corresponding assignment of biomolecules.
By applying PCA-LDA to all measured spectra is another more objective way to check if there are real differences between the cervical cancer and control samples. Basically, PCA allows discriminating between control and cancer samples based on the differences existing between the bands that constitute each one of the 287 spectra. These differences between the bands of spectra indicate biochemical differences between samples. The selected region of 600-1800

In this study, as we know a priori how many groups there are and which samples correspond to each group, we applied a multivariate technique, linear discriminant analysis (LDA), to our PCA result as a technique acting in a supervised manner. LDA identified the two most natural groups separated by the dotted line shown in Fig. 3. By analyzing the official results reported by hospital pathologists, the point group on the left the line (or blue dots) can link to the group of spectra from cervi cancer patients and the group on the right of the line (or the red dots) can link to the group of spectra from control patients.
By observing Fig. 3, the sensitivity and specificity of our test method can be calculated. Sensitivity characterizes the ability of the test method to detect the disease in diseased subjects and specificity characterizes the ability of the test method to detect the absence of disease in healthy subjects. As 16 of the 144 spectra from the cancer serum samples were misclassified as control ie 16 blue points are in the region of control spectra (on the right the line) and only 17 of the 143 spectra from the control serum samples were misclassified as cervical cancer i.e. 17 red points are in the region of cervi cancer spectra (on the left the line), our control and cervical cancer samples were correctly classified with 88 % sensitivity and 88 % specificity.
In order to demonstrate that SERS and PCA-LDA are suitable and efficient for discriminating cervical cancer from the control group, PCA was applied using cross-validation. In cross-validation, the data is randomly split into two sets, a training set and a test set. In this approach, one sample (testing data) at a time was left out and PCA was applied after data reduction. Fourteen components for smoothing without baseline correction spectra and 14 components for smoothing with baseline correction spectra were considered for this analysis. In both cases, we were able to observe the two large groups of spectra as what we have obtained in Fig. 3. The sensitivity and specificity for data with smoothing and baseline correction and for smoothed data without baseline correction were about 88 %.
The position of relevant difference between spectra was computed by plotting the firsts principal components as a function of the wave number. In our case, Fig. 4 shows the second principal component and the principal differences between groups are represented by peaks with higher intensity. Nevertheless, several of these high peaks could be representing natural biochemical differences among only control patients, thereby, according to Gonzalez et al.,(9) to know the real molecular differences between the control samples and cancer, first it is necessary to know the natural molecular differences between only the control samples and then discard them from the molecular differences between the control samples and cancer. In order to know these natural differences, we plot the second principal component versus the wave number between the 143 control spectra. Figure 4 shows control-control plots with the position of relevant differences between the control patients and control-cancer plots with the position of relevant differences between the control and cervical cancer patients using the second principal component, PC2. By discarding the most intense peaks matching between the control-control and control-cancer plots (e.g., peak 692

4. Conclusion
Surface enhanced Raman spectroscopy using silver nanoparticle of 40 nm was applied to analyze blood serum from cervical cancer patients and healthy volunteer controls. SERS allowed short exposures and chemicals present at low concentration could be identified. Like to the study of cervical cancer detection using conventional Raman spectroscopy, the SERS study confirmed that the main molecular differences were glutathione, tryptophan,

