1. Introduction
Scintillators have high light yield, good energy resolution, high gamma-ray absorption coefficient, fast luminescence decay time, and chemical stability. They have been playing a major role in many fields of radiation detection, including medical imaging, security, astrophysics, diffraction, nondestructive testing, geophysical, and resource exploration1-5. There are different scintillators designed for radiation and applications depending on the type of radiation and material compositions.
NaI(Tl) detectors have been widely used in many fields over the last 60 years6.The Cerium doped Lanthanum bromide, LaBr3(Ce), is one example of the new generation of inorganic scintillators and offers significantly better resolution (2.7%-3.3% at 662 keV) relative to sodium iodide, becoming an alternative to it7,8. The europium-doped alkaline earth halide, SrI2(Eu2) is a scintillator material that can provide energy resolution comparable to that of LaBr3(Ce) offering a new option for gamma-ray detection and spectroscopy9,10. GAGG:Ce (gadolinium aluminium gallium garnet-structural notation of Gd3Al2Ga3O12:1% Ce) is a relatively new single-crystal scintillator that entered the scintillator market in the current decade and continuously attracts a lot of attention11,12.
All radiation detectors require accurate calibration for the correct performance. In energy calibration, it is essential to identify and determine the activity of the involved isotopes. However, the determination of the activity amount is necessary to calibrate the efficiency of the detector. The efficiency calibration is one of the most important characteristics of a detector and can be a demanding task, especially for complex and extended source geometries13. Thus, research has been focused on the development of computational techniques to perform efficiency calibration along with experimental measurements. Monte Carlo (MC) simulation method is one of these computational techniques. This technique allows the extrapolation of simulations to obtain the efficiency curves of the sources that are difficult or impossible to obtain in a laboratory13,14. The purpose of this work is to present the calibration factors of 2"×2" NaI(Tl) scintillation which are important for nuclear investigations and in all experimental studies in radiation measurement. The energy and energy resolution calibrations of the NaI(Tl) scintillation detector system were obtained from experimental measurement with different fitting functions used in both calibrations. In the efficiency calibration, we are interested in the full-energy peak efficiency because of the variation of the energy-dependent efficiency and the change of the detector-to-source distance-dependent. The detector efficiency was also evaluated using Geant4 based GATE simulation. The results obtained from the experimental and simulation are compatible with each other, thus giving us a fast way for efficiency calculations for any detector system through GATE simulation code. Thus, the simulation model modified into the novel scintillation detector systems such as LaBr3, GAGG(Ce) and SrI2. The detector characteristics like geometry, chemical, and optical properties were modified in the simulation code according to the scintillation properties.
2. Methods
Experimental setup
The experimental measurement was performed at the Department of Physics of Ankara University in Turkey. The acquisition of the energy spectra from radiation sources was accomplished using a 2"x2" ORTECs ScintiPack Model 296 NaI(Tl) detector with 7% nominal energy resolution at 662 keV. The ScintiPack Photomultiplier Base (Model 296) has a low-power, adjustable, high-voltage supply, an active bias network, and a spectroscopy preamplifier in one compact package. It was coupled to an ORTECs 572A Model amplifier, which was connected to DigiBASE (Ortec) multi-channel analyzer and the MAESTRO 32 multichannel analyzer (MCA) emulation software. The software was used for the data acquisition, display of the acquired γ-ray spectra, and initial spectra analysis: peak evaluation, peak area calculation, and specifying energy. The standard NaI(Tl) gamma spectrometry equipment using in the experiment is shown in Fig. 1.

Figure 1 Schematic representation of the experimental setup. The NaI(Tl) detector is encapsulated with standard Aluminium housing after thin reflector.
Once encapsulated, the NaI(Tl) detector was irradiated with 241Am, 22Na, 137Cs, 60Co and 152Eu radioactive sources. 137Cs, 60Co and 152Eu were point radioactive sources and 241Am, 22Na were cylindrical volume sources. The specific properties of the radioactive sources used in the experiment are given in Table I.
Table I Main features of the sources used in the experiment and modeled in the simulation.
| Radionuclide | Photon Energy (ke V) | Current Activity (kBq) (Fe. 2020) | Half-Life (year) | Emission Probability % |
|---|---|---|---|---|
| 241Am | 59.54 | 367.87 | 432.2 | 35.92 |
| 22Na | 511 | 29.76 | 2.60 | 178 |
| 1274.5 | 99.94 | |||
| 137Cs | 661.66 | 35.10 | 30.07 | 85.1 |
| 60Co | 1173.24 | 38.49 | 5.27 | 99.87 |
| 1332.51 | 99.97 | |||
| 152Eui | 121.78 | 33.08 | 13.52 | 28.58 |
| 344.28 | 26.50 | |||
| 1408.01 | 21.01 |
Each measurement was done in a period of 15 minutes records to minimize the statistical error of the peak area. The calibration procedure of scintillation detectors used for gamma spectrometry usually consists of energy, energy resolution, and efficiency calibrations. These calibrations permit the correct identification and determination of the activity of the concerned isotopes8,13,15. However, if necessary, calibration time, cascade, geometric, self-absorption effect calibrations should also be considered.
Energy calibration
Energy calibration is the first step of calibration in gamma spectroscopy before its usage in radiation detection. The energy calibration is a relationship between the channel number and the known energy peak of the radioactive source. The calibration parameters and their relations are
where, C is the channel number, p0 and p1 are fitting parameters that calculated by a linear fit function. The fitting parameters obtained from the experimental data are p0 = 17.77, p1 = 0.95 as illustrated in Fig. 2.
Energy resolution calibration
The energy resolution is another important parameter of a gamma-ray spectrometer; depending mainly on the detector material properties, it quantifies how well the detector can discriminate between gammas of similar energies. The energy resolution of a detector R is characterized by full-width at half maximum (FWHM) of the specified energy peak. It is expressed as follows;
where E0 is the specific energy of the related peak. The FWHM is given in units of energy, while the energy resolution is expressed as a percentage. The energy resolution function is related to energy as;
where the values of a and b are determined by a least-squares fit. Figure 3 shows the curve fits and experimental values for the energy resolution. The obtained energy resolution function from this figure is
Efficiency calibration
The last major calibration procedure for a gamma-ray spectrometer is the efficiency calibration, which accounts for the relationship between the number of counts under the peak and the activity of a radioactive source. The experimental efficiency of a detector at energy E, calculated using the following formula:
where N is the number of counts of the photopeak for the specifying energy, t is the acquisition time, P is the photon emission probability for each interested radionuclide, A is the current activity of the radionuclide.
Determining the gamma counting efficiency of the detector system for all gamma energies in the experiment is almost impossible due to the limited number of single-energy gamma-emitting radioisotopes16,17. The analytical equation for detector efficiency can be defined as a function of 𝑥 and 𝑦 by using the fitting function given in below17-20:
Here,
In Eq. (7), Eγ expressed as the gamma energy, E1 and E2 defined as a low energy constant (at 100 keV) and a high energy constant (at 1000 keV), respectively. Meanwhile, the total gamma count yield at high energy is represented by t4, t5, and t6; it is determined by t0, t1 and t2 parameters in Eq. (6) at low energy. t2 can be ignored and 𝑡 3 is represented by the region between the low and high energy efficiency zone. The high t3 parameter means that the rotation between the two regions is sharp, the low one indicates that there will be a slower rotation18.
GATE simulation code
Monte Carlo method makes it possible to characterize detector parameters by simulating the interactions of radiation with matter8,13,21-23. This method has a wide variety of application areas such as radiation field, medical physics, detector and reactor design, and high energy physics. GATE is a simulation toolkit that applies in nuclear medicine, such as PET, SPECT, CT, optical imaging, radiotherapy, and the design of medical imaging devices. It encapsulates the Geant4 libraries and consists of several hundred C++ classes24.
GATE simulation code is used in this study. Firstly, the NaI(Tl) detector geometry was determined in the GATE simulation in accordance with the materials and thickness shown in Fig. 4a). The representation of the cylindrical NaI(Tl) detector was modeled in Geant4 as given in Fig. 4b). The 2"×2" cylindrical NaI(Tl) scintillator was surrounded by a 0.185 mm thick MGO reflector (air defined for the LaBr3). The modeled detector geometry of the GATE simulation was positioned inside an aluminum capsule with a thickness of 0.5 mm. After the detector geometry was modeled, the other important parts of the simulation were defined, such as system identification, modeling of radioactive sources, specifying the physics list, sensitive detector concept, digitizer (signals measured by the detector after interacting with radiation), and defining the outputs required for recording the signals measured in the detector. The result obtained from the GATE simulation tools were compared with the literature using the Monte Carlo N-Particle eXtended (MCNP-X) code25 and the other Monte Carlo techniques.
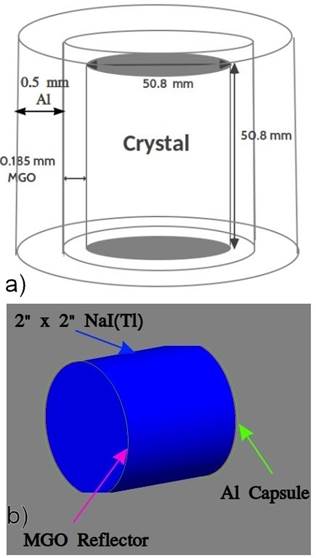
Figure 4 a) The thickness of each part of the NaI(Tl) detector modeled in the GATE simulation and the geometry of the materials. The 0.185 mm thick MGO reflector was defined as air when modeling the LaBr313. b) The visualization of cylindrical and 2"x2" dimensions of the NaI(Tl) detector in Geant4.
3. Results
The energy spectrum found with 137Cs emitting 662 keV of gamma radiation energy in the GATE simulation was compared with the experimentally measured spectrum as shown in Fig. 5. At the full energy peak of the 662 keV, both the experimental and simulated spectra are in acceptable agreement. However, there are some differences in the Compton continuum below 450 keV, most likely due to the disproportionate scintillation efficiency of the NaI(Tl) crystal in the low energy region21,26. The second reason for the difference could be about the variation of the light yield per unit deposited energy, which is not constant and not considered in the simulation code21. In the energy region between 0.15 and 0.25 MeV, the backscatter peak is not reproduced by the Monte Carlo simulation. This peak is caused by Compton scattering of gamma-rays from from materials in the experimental area. The MC model simulates only detector-
source system, rather than the entire experimental setup and environment21,23,27. The emitted Ba X-ray at (30 keV following the intrinsic transformation of 137Cs is seen in the experimental measurement. However, it is not visible in the simulation because it was not taken into account in the Monte Carlo simulation code.
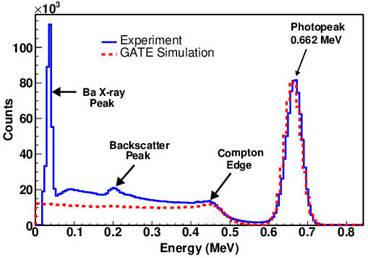
Figure 5 Comparison of experimental and simulated energy spectra obtained from NaI(Tl) detector at 662 keV for 137Cs source.
The efficiency values of the cylindrical NaI(Tl) detector were obtained with a Geant4-based GATE simulation program in the energy range of 60 keV to 1408 keV photon energy and were also experimentally measured. Radioactive sources with different shapes were placed 2, 4, 5, 6, 8, and 10 cm away from the detector surface. Efficiency values, for different photon energies and source-to-detector distances obtained by experiment and simulation, are listed in Table II.
Table II Table of effificiency values of the cylindrical NaI(Tl) detector obtained by experiment and simulation at various source-detector distances for different photon energies (from 59 keV to 1408 keV) and the literature comparison.
| Photon Energy (keV) | Distance (cm) (±∆)ii | εGATE (%)iii | εexp (%) | εMCNP (%)21 | RD |
|---|---|---|---|---|---|
| 2 | 8.656 | 8.608 | 13.04 | 0.554 | |
| 4 | 4.226 | 4.259 | - | 0.791 | |
| 59.54 | 5 | 3.137 | 3.878 | - | 0.464 |
| 6 | 2.404 | 2.263 | - | 6.229 | |
| 8 | 1.523 | 1.411 | - | 7.937 | |
| 10 | 1.071 | 1.012 | - | 5.828 | |
| 2 | 11.577 | 11.175 | 4.79 | 3.597 | |
| 4 | 5.708 | - | - | - | |
| 121.8 | 5 | 4.153 | 4.117 | - | 0.874 |
| 6 | 3.144 | - | - | - | |
| 8 | 1.969 | - | - | - | |
| 10 | 1.341 | - | - | - | |
| 2 | 5.626 | 5.832 | - | 3.532 | |
| 4 | 2.849 | - | - | - | |
| 344.3 | 5 | 2.206 | 2.222 | - | 0.720 |
| 6 | 1.656 | - | - | - | |
| 8 | 1.091 | - | - | - | |
| 10 | 0.758 | - | - | - | |
| 511 | 2 | 3.556 | 3.617 | - | 1.686 |
| 5 | 1.399 | 1.431 | - | 2.236 | |
| 2 | 2.474 | 2.639 | 3.05 | 6.252 | |
| 4 | 1.214 | 1.201 | - | 1.082 | |
| 661.6 | 5 | 0.918 | 0.896 | - | 2.455 |
| 6 | 0.719 | 0.699 | - | 2.861 | |
| 8 | 0.475 | 0.473 | - | 0.423 | |
| 10 | 0.338 | 0.328 | - | 3.059 | |
| 2 | 1.319 | 1.376 | 1.44 | 4.142 | |
| 4 | 0.726 | 0.669 | - | 8.520 | |
| 1173.2 | 5 | 0.529 | 0.526 | - | 0.570 |
| 6 | 0.433 | 0.405 | - | 6.914 | |
| 8 | 0.269 | 0.271 | - | 0.738 | |
| 10 | 0.192 | 0.181 | - | 6.077 | |
| 1274.5 | 2 | 1.129 | 1.084 | - | 4.151 |
| 5 | 0.433 | 0.406 | - | 6.650 | |
| 2 | 1.139 | 1.065 | 1.27 | 6.948 | |
| 4 | 0.560 | 0.533 | - | 5.066 | |
| 1332.5 | 5 | 0.412 | 0.400 | - | 3.000 |
| 6 | 0.334 | 0.316 | - | 5.696 | |
| 8 | 0.223 | 0.210 | - | 6.190 | |
| 10 | 0.154 | 0.142 | - | 8.451 | |
| 2 | 1.063 | 1.026 | - | 3.606 | |
| 4 | 0.531 | - | - | - | |
| 1408 | 5 | 0.404 | 0.393 | - | 2.799 |
| 6 | 0.317 | - | - | - | |
| 8 | 0.209 | - | - | - | |
| 10 | 0.148 | - | - | - |
The term RD in Table II is defined as the relative difference between efficiency obtained from the GATE simulation code and from the experiment. It is expressed by the following formula:
The efficiency calibration depends on the source-to-detector distance, source size and shape, and the materials surrounding the source. Therefore, the variation of the energy-dependent efficiency and the change of the detector-source distance-dependent full-energy peak efficiency is meaningful. Figure 6 shows the full-energy peak efficiencies for photons in the energy range up to 1408 keV when the sources are located at 2 cm (Fig. 6a) and 5 cm (Fig. 5b) away from the cylindrical NaI(Tl) detector. The comparison between the full-energy peak efficiencies measured in the experiment and simulated in GATE shows good agreement across the energy range studied.
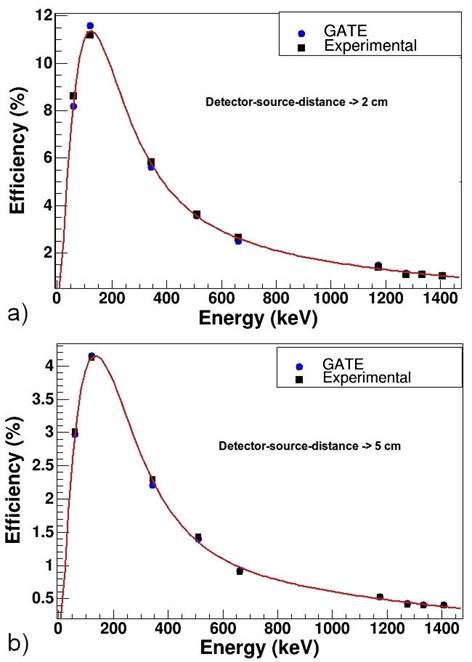
Figure 6 Measured and simulated full-energy peak efficiency percentage of the detector for locating at a) 2 cm and b) 5 cm.
The fitting parameters of the detector efficiency in Eq. (6) for cylindrical NaI(Tl) are obtained from Fig. 6. Table III shows these parameters for 2 cm and 5 cm detector-to-source-distance.
Table III The fitting parameters of detector efficiency in Fig. 6 is obtained from the analytical equation Eq. (6).
| Fitting Parameters for the Analytical Equation | ||||||||
|---|---|---|---|---|---|---|---|---|
| t0 | t1 | t2 | t3 | t4 | t5 | t6 | ||
| 2 cm | GATE Experiment | 10.06 | 0.97 | -2.49 | 10.02 | 8.84 | -0.99 | 4.04 |
| 10.01 | 0.62 | -2.26 | 10.58 | 9.02 | -0.99 | 4.62 | ||
| 5 cm | GATE Experiment | 9.34 | 0.94 | -2.59 | 10.59 | 8.00 | -0.99 | 3.00 |
| 9.00 | 0.75 | -2.39 | 10.00 | 8.00 | -0.99 | 4.99 | ||
The full-energy peak efficiency of the NaI(Tl) detector for various source-to-detector distances obtained by the GATE simulation and experiment is shown in Fig. 7a) and 7b), respectively.
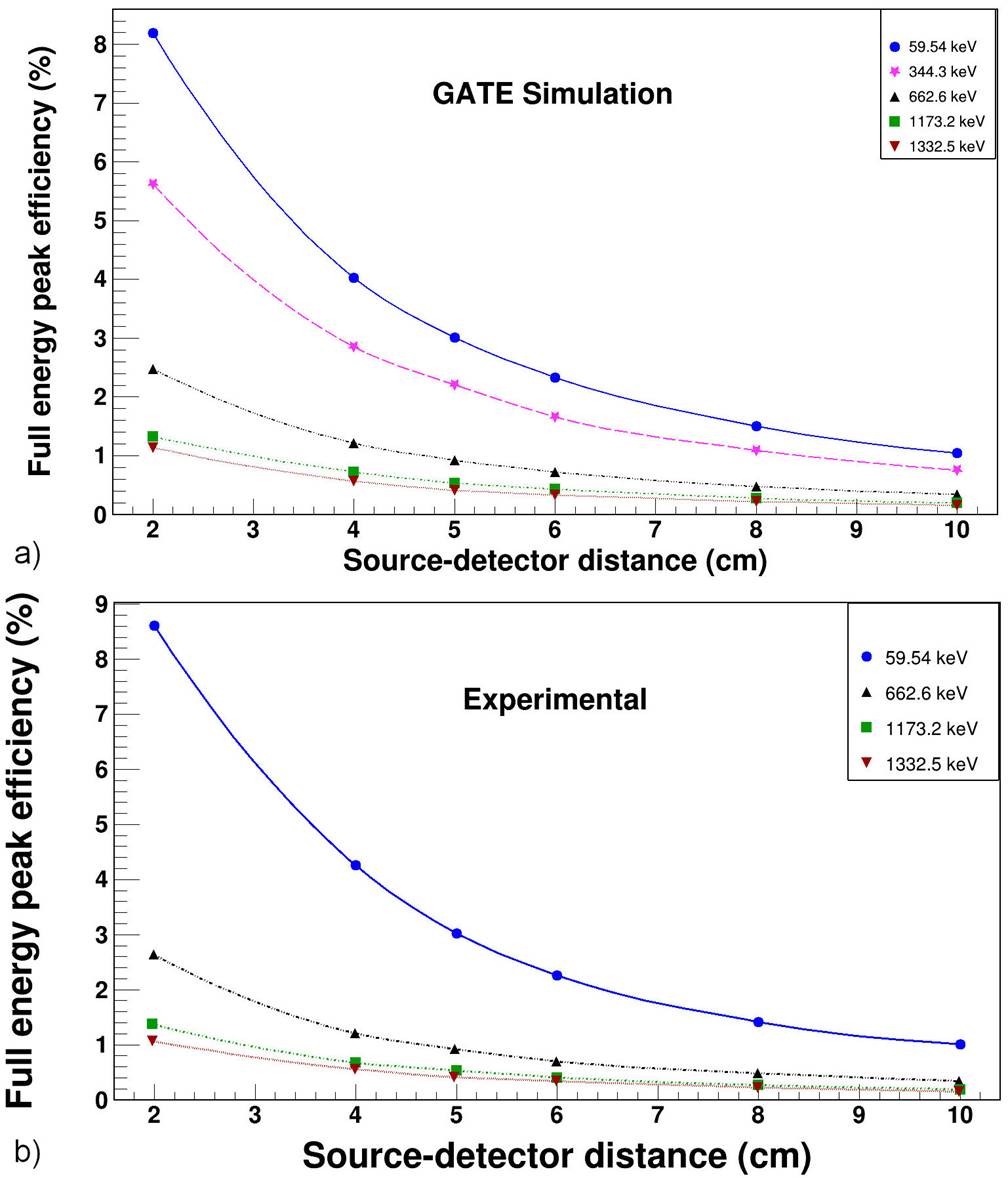
Figure 7 The full-energy peak efficiency values versus source-to-detector distance (between 2-10 cm) obtained by a) GATE simulation and b) experimentally measurement in the photon energy range from 59.5 keV to 1332.5 keV.
Following the literature, it can be seen that the efficiencies decrease exponentially as the distance to the detector surface increases2,28. However, this exponential decline varies depending on the energy of the gamma. While the exponential reduction coefficient for 59 keV was 2.247, it was found to be 0.169 for 1332 keV (Fig. 8). That may explain why there is very high efficiency in simulation calculations for 59 keV in the literature. It is observed that, for the efficiency calculation, a millimetric detector-source-distance shift effect at low energy is 13.3 times greater than at high energy.
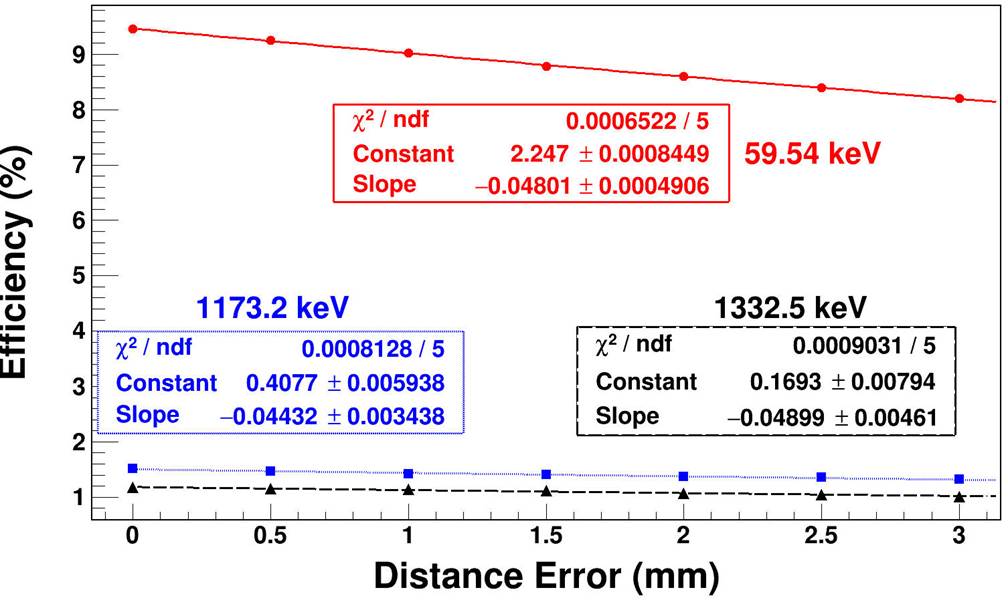
Figure 8 Exponential reduction coefficient for 59, 1173, and 1332 keV photons based on millimeter distance. These results obtained from the simulation by changing the source-to-detector position on the millimetric scale.
In GATE simulation, the modeling code for NaI(Tl) was modified for the new scintillation materials. A 2”x2” cylindrical LaBr3 (Ce) detection system was included in the simulation, and then the efficiency values compared with the literature. The values given in Table IV are the comparison of the results obtained from MCNP-X8, Monte Carlo and experimental13, and GATE.
Table IV The comparison of the efficiency values for the cylindrical LaBr3 detector (2"×2") with similar studies in the literature.
| Radionuclide | Photon Energy (keV) | Distance (cm) | εGATE (Present work) | εMCNP-X21 | εMC13 | εexp13 |
|---|---|---|---|---|---|---|
| 241Am | 59.54 | 5 | 3.93 | 3.95 | 3.09 | 3.0 |
| 133Ba | 302.85 | 5 | 2.29 | 2.34 | 2.01 | 2.0 |
| 356.01 | 5 | 1.98 | 2.05 | 2.01 | 1.8 | |
| 137Cs | 661.66 | 5 | 1.34 | 1.45 | 1.31 | 1.3 |
| 60C | 1173.24 | 2 | 2.22 | 2.48 | 2.15 | 2.1 |
| 1332.51 | 2 | 2.06 | 2.20 | 1.90 | 2.0 |
In addition, the various novel detection system is modeled with help of a GATE simulation. The efficiency values are obtained for different photon energies, from 60 keV to 1408 keV in the case of 5 cm detector-source-distance (Table V). We aim to compare the percentage of the full-energy peak efficiencies for new-generation detection systems with NaI(Tl). Therefore, isotropic point gamma-ray source with 4000 Bq activity is defined in the simulation in this part. The peak efficiency results for various scintillation detectors are listed in Table V.
Table V The percentage of peak efficiency values obtained using GATE simulation for the new generation detectors.
| εGATE | ||||
|---|---|---|---|---|
| Photon Energy (keV) | NaI(Tl) | LaBr3 | SrI2 | GAGG |
| 60 | 4.9190 | 4.7230 | 5.0255 | 4.8611 |
| 80 | 4.9277 | 4.8011 | 5.0301 | 4.9154 |
| 100 | 4.8314 | 4.7613 | 4.9133 | 4.8904 |
| 300 | 2.7453 | 2.9013 | 3.0422 | 3.6252 |
| 600 | 1.2307 | 1.4827 | 1.4951 | 2.2081 |
| 662 | 1.1069 | 1.3406 | 1.3501 | 2.0559 |
| 800 | 0.9035 | 1.1498 | 1.1278 | 1.7981 |
| 1173 | 0.5782 | 0.8001 | 0.7888 | 1.3459 |
| 1332 | 0.5147 | 0.7087 | 0.6823 | 1.2290 |
| 1408 | 0.4854 | 0.6777 | 0.6663 | 1.1849 |
The fitting parameters of the detector efficiency curves obtained for different scintillations are as shown in Fig. 9 and Fig. 10. In Fig. 9, the percentage of the full-peak efficiency values for NaI(Tl) are compared with LaBr3 and GAGG detector systems. The efficiencies value for GAGG is much better than other scintillations, especially for high energetic photons. According to the values in Table V, the gamma efficiencies for LaBr3 and SrI2 detectors are very close to each other. The highest gamma efficiency was found for the GAGG scintillator as shown in Fig. 9 and 10. This will provide effective results in laboratory measurements and in areas where scintillation detector systems are widely used such as medical imaging.
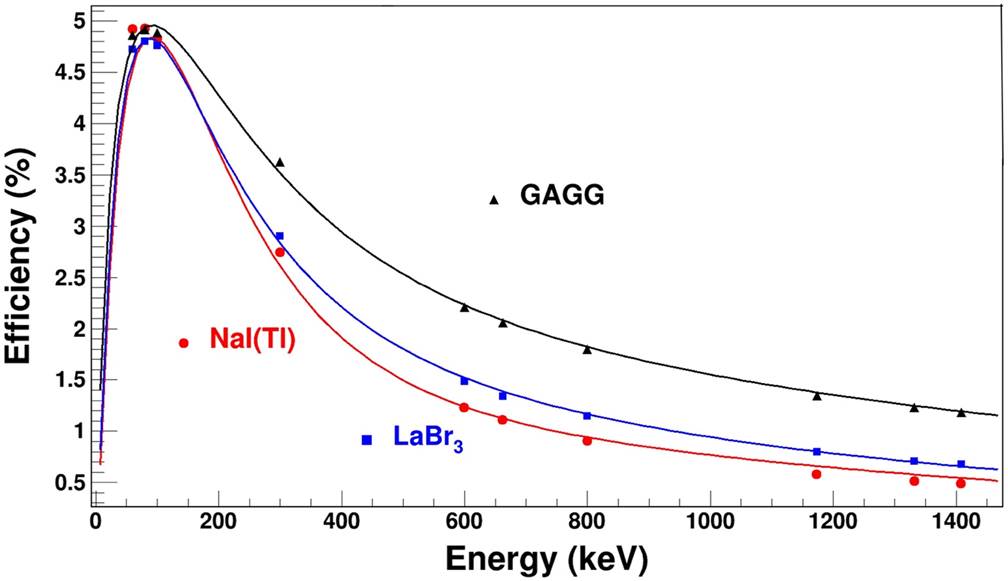
Figure 9 The percentage of the full-energy peak efficiency curve for NaI(Tl) and new scintillation detection systems with their fitting parameters.
4. Discussion
In this study, we presented a complete calibration (energy, energy resolution, and efficiency calibrations) of 2” x 2” NaI(Tl) scintillation detector, widely used in gamma-ray spectrometry. The energy-channel relation was found to be a first-degree polynomial function by using experimental data. The energy resolution function was related to the energy in exponential reduction. In terms of the efficiency calibration, Geant4-based GATE simulation code was developed to validate real gamma-ray spectra and efficiency measurements; subsequently, simulation results were compared with the experimental values. Experimental efficiencies and fitting parameters are in good agreement with calculated values obtained from the simulation. It can be seen that the efficiencies decrease exponentially with the increasing distance from the detector face, in agreement with the literature. However, this exponential decline varies depending on the energy of the gamma-rays. That may explain why there is a higher efficiency in the simulation than the measured value for 59 keV in the literature. The effect of a millimetric detector-source-distance deviation on detector efficiency at low energy is 13.3 times more than at high energy. In this study, we obtained the efficiency calibration parameters for NaI(Tl) in three different ways using experimental, simulation, and analytical approaches.
The NaI(Tl) scintillator is widely used in many fields, however, new scintillation detectors with better properties are beginning to replace it. A previous simulation code was modified to accommodate new generation scintillation systems. The calculated efficiency value in GATE for < is consistent with the literature. Different new scintillation detector systems were also modeled in the simulation, and the parameters used in the analytical equation of the efficiency curve were obtained. GAGG is a new detector system that gives promising results in energy and time resolution studies in the literature. There is, to the extent of the authors’ knowledge, any work related to the gamma-efficiency of the GAGG and comparing novel scintillators. Among all detectors, the highest gamma efficiency was found for GAGG. This will improve laboratory measurements and areas where scintillation detector systems are commonly used, such as medical imaging.


 nueva página del texto (beta)


