


 nueva página del texto (beta)
 Inglés (pdf)
 Artículo en XML
 Referencias del artículo
 Enviar artículo por email
 Citado por SciELO
  Similares en
SciELO
Similares en
SciELO 
 Permalink
INTRODUCTION
The estuarine lagoon ecosystems are recognized as complex ecological structures derived from diverse aquatic environments, because mainly the exchange of water and organisms with the sea and the discharge of fresh water from the rivers that drain into their micro-basins (Snedden et al., 2013; Aguirre-León et al., 2014). These conditions generate a high primary productivity derived from phytoplankton, mangroves, and submerged vegetation because of the subsidies they receive through fluvial discharges and tidal exchange (Paerl & Justic, 2013). These factors determine the magnitude of secondary production by various faunal groups, including an important diversity of coastal fish (Díaz-Ruiz et al., 2018; Aguirre-León et al., 2020).
In these systems, studies on spatial and temporal variations of the ichthyofauna and their relationship with environmental variables have highlighted their importance as breeding, feeding, protection or reproduction areas for the development of the life cycles of coastal fish, many of which are fishing resources (Rodríguez-Varela et al., 2010; Castillo-Rivera et al., 2017; Díaz-Ruiz et al., 2018; Raz-Guzman et al., 2018; Aguirre-León et al., 2014, 2021). The ecological behavior of species and its relationship with environmental variables are also reflected in changes in species richness, distribution and abundance in space and time (Barletta et al., 2005, 2008; Aguirre-León et al., 2018).
The coast of Veracruz has several coastal lagoons (Lara-Domínguez et al., 2011), some are part of Protected Natural Areas or Ramsar Sites that place them in an ecological condition of high priority regarding the management and conservation of their biodiversity. Among these, the Sontecomapan lagoon belongs to the “Los Tuxtlas” Biosphere Reserve (CONANP, 2006), is also a Ramsar site (FIR, 2004). This lagoon is characterized by its biological richness, since it is used by a wide variety of fish during their life cycles, many of which are marine and freshwater fish for local consumption (Rodríguez-Varela et al., 2010; Aguirre-León et al., 2018; Beltrán-García et al., 2019). Despite the economic importance of these resources, ecological studies on the fish community in this system are currently still scarce. Therefore, this study complements and enriches the information on the knowledge of the fish community in the Sontecomapan Lagoon and provides greater understanding to harmonize its use and conservation as soon as possible in the Tuxtlas region.
The focus of this study encompasses a spatio-temporal analysis of the fish community, for which the following objectives were proposed: 1) Analyze the richness diversity, evenness, and community dominance, 2) Determine the density, biomass, and average weight in the system, 3) Identify the types of fish inhabitants present in the system and the trophic categories of the community, 4) Analyze the environmental factors that condition the ecological behavior of fish assemblages.
MATERIALS AND METHODS
Study Area: The Sontecomapan lagoon, located south of Veracruz (018º 32’ N, 095º 02’ W) (Fig. 1) belongs to the Los Tuxtlas Biosphere Reserve (CONANP, 2006). It was declared a Ramsar Site in 2004 (FIR, 2004) due to the degree of conservation of its mangroves and recognized worldwide as a Biosphere Reserve within the “Man and the Biosphere” program of UNESCO (MAB) in October 2006 (MAB, 2010). The system is approximately 12.0 km long and 1.5 km wide, with an area of 8.9 km2 and a complex geomorphology. It is shallow (average 2.0 m) with mixed sediments from sand to silt-clay. It communicates with the sea through a tidal channel and its sea mouth that is 5.0 m deep and 137.0 m wide (Esquivel & Soto, 2018). A considerable volume of water from the Coxcoapan, Yuhualtijapan, Basura, La Palma, and El Sábalo rivers drain into the system (FIR, 2004). The system presents a saline gradient with values from 34.6 to 0.0 UPS from the marine inlet to the headwaters of the rivers. The water temperature varies from 21.0 to 30.7 oC. Dissolved oxygen changes from 2.0 to 8.6 mg/L. The depth from 1.0 to 5.5 m and the transparency from 0.2 to 2.9 m (Aguirre-León et al., 2018). The climate is warm-humid, with an annual rainfall of 3 000 to 4 000 mm. The average extension of the climatic seasons goes from June to September for the rainy season, from October to February for the cold fronts called “Nortes” and from March to May for the dry season (Soto-Esparza & Giddings, 2011). The system presents varied aquatic environments from surrounding vegetation of Rhizophora mangle and Avicennia germinans in brackish and low salinity areas and submerged vegetation of Ruppia maritima (Carmona-Díaz et al., 2004).
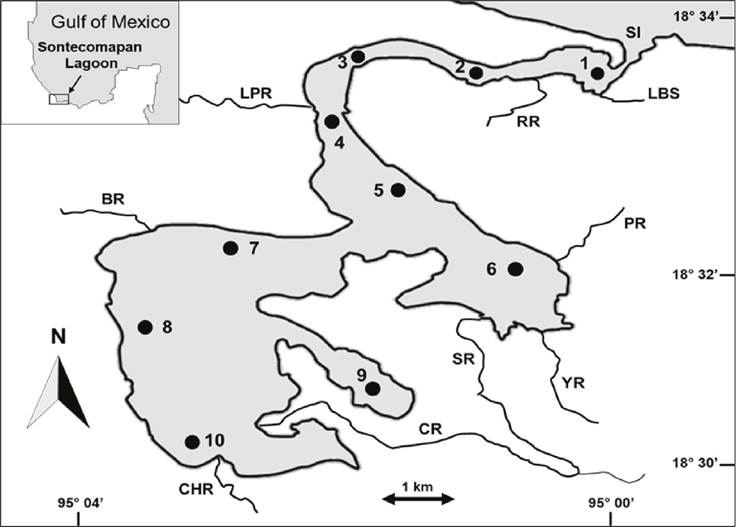
Figure 1 Sontecomapan Lagoon System, Veracruz. The location of sampling stations (•), the main physiographic features of the study area and rivers draining into the system are noted. Palma River (LPR), Basura River (BR), Chuniapan River (CHR), Coxcoapa River (CR), Sábalo River (SR), Yuhualtijapan River (YR), Pollos River (PR), La Boya Stream (LBS), Sontecomapan Inlet (SI).
Sample collections: Data from this study were collected in October 2017 (O17), February 2018 (F18), October 2018 (O18) and January 2020 (J20), and combined with a data set from a previous work conducted in October 2014 (O14), February 2015 (F15), October 2015 (O15) and February 2016 (F16) (Aguirre-León et al. 2018). In both studies, the fish collection was carried out in 10 sites of the system (Fig. 1), with a shrimp trawl net 5.0 m long, with a working mouth of 2.5 m and a mesh size of 1.8 cm. These catches were made by trawling for 10 minutes as a standard effort at an average speed of two knots and covering an average trawl area of 1,500 m2. The same methodology was used for samples collected from 2014 to 2020, two repetitions for each site and month were made, for a total of 160 captures.
Fish samples were preserved with a 10% formaldehyde solution in labeled plastic bags for later processing in the laboratory. Collected specimens were deposited as vouchers at the fish collections of Coastal Ecology and Fisheries Laboratory (UAM-Xochimilco). In addition, the physicochemical parameters at the surface and at the bottom were recorded at each sampling site using a YSI 85 multiparameter, these were: salinity (UPS), temperature (°C), and dissolved oxygen (mg/L), as well as transparency and depth (m).
Laboratory activities: Taxonomic identification of the species was carried out using identification sheets and descriptions based on the work of Castro-Aguirre et al. (1999), Carpenter (2002) and Miller et al. (2009). The taxonomic arrangement of the species was based on Nelson et al. (2016) and the authority and current nomenclature of these was corroborated in Fricke et al. (2021). Each species was counted and weighed with an Ohaus digital balance (precision 0.01 g). The parameters of diversity H´ (Shannon-Weaver, 1963), species richness D (Margalef, 1969), evenness J´ (Pielou, 1966), as well as those of abundance, density (ind./m2), biomass (g/m2) and average weight (g/ind.) of the community were estimated as described by Aguirre-Léon et al. (2020). The dominant species were determined using the Importance Value Index (IVI= N%+ P%+F%) with the ANACOM program (De la Cruz-Agüero, 1994). The different fish inhabitants of the community were identified following the criteria of Elliott et al. (2007) and Potter et al. (2015), which are classified as: ES = estuarine species, MED = marine estuarine-dependent, MEO = marine estuarine-opportunist and FS = freshwater species. The fish were grouped into trophic categories, their diet was examined through the literature, and they were classified following the criteria proposed by Elliott et al. (2007) and Froese & Pauly (2022) in: zooplanktivorous (ZP), species that feed predominantly on plankton; omnivores (OM), species that feed on plants, epifauna and infauna; detritivores (DE), species that feed mainly on detritus and /or microphytobenthos; piscivores (PI), fish that feed on nektonic invertebrates and finfish; zoobenthivore (ZB), fishes that feed on invertebrates associated with the substratum.
Statistical analysis: The ecological parameters of the community were compared between sites and months of study. Its average and standard deviation on these scales were calculated for each parameter. Parametric and non-parametric analysis of variance was used to indicate statistically significant differences. Previously, the assumptions of normality were evaluated using the D’Agostino Omnibus test, as well as the homogeneity of variances using the Modified Levene Equal Variance test (Levene, 1960). When necessary, logarithmic transformations were performed. When the assumptions of normality and equality of variance were met, the ANOVA-F test was used, and the Tukey test to determine between which sites or months there were differences. When these assumptions were not met, the Kruskal-Wallis-H test and the Z multiple test were used to determine these differences (Zar, 2010). These analyses were performed using the STATISTICA 13 program (StatSoft, Inc., 2013). A significance level of P < 0.05 was considered for all these analyses (Heiman, 2014).
The sampling effort was validated by estimating species accumulation curves based on the non-parametric estimators Chao2, Jackknife1, Jackknife2 and Bootstrap (Magurran, 2004). These estimators were selected for their precision in evaluating the total species richness, based on species presence-absence records, and because they allow estimating the rarity of species based on incidence (unique and duplicate species) (Willott, 2001). An abundance database of species by sites and sampling months was used. The construction of these curves was made with 9 999 randomizations using the statistical program Primer-E (Magurran et al., 2011; Clarke & Warwick, 2014).
Canonical correspondence analysis (CCA) was used to define the fish assemblages and their correlation with the environmental factors of the system, for which matrices were constructed with the relative numeric abundance of the species and the average values of physicochemical parameters (salinity, temperature, dissolved oxygen, depth, and transparency) by sites and months of sampling (ter Braak & Verdonschot (1995). The inter-set correlations derived from this analysis were used to determine the environmental variables that had the greatest effect on species composition, distribution, and abundance (McGarigal et al., 2000; ter Braak & Smilauer, 2002). This analysis was configured with the MVSP program (Multivariate Statistical Package), version 3.22 (KCS, Inc., 2013).
RESULTS
Fish community composition: A total of 6 916 individuals were captured during the study for an overall of 23 families, 35 genera and 50 species identified. Five families had the highest number of species, Carangidae and Gerreidae with six each and Engraulidae, Centropomidae and Lutjanidae with four each, (Table 1). For this study Chaetodipterus faber (Broussonet, 1782) (Ephippidae) and Pomadasys ramosus (Poey,1860) (Haemulidae) collected in February and October 2018 respectively, are new records for the system. According to the non-parametric species accumulation curves (Fig. 2) the expected average richness could be 66 species. The representativeness of the sampling varied between 56 (65%) for Bootstrap and 73 (92%) for Jackknife2 of the expected species. Therefore, 16 species would be missing to complete the current list of this study.
Table 1 List of the fish species collected in the Sontecomapan lagoon system, Veracruz.
| Families | Species | AB | Number | N % | Weight | W % | Freq. % | IVI (%) | CI | CT |
|---|---|---|---|---|---|---|---|---|---|---|
| Dasyatidae | Hypanus sabinus (Lesueur, 1824) | Hs | 9 | 0.13 | 4946.65 | 6.51 | 1.03 | 7.67 | MED | ZB |
| Engraulidae | Anchoa hepsetus (Linnaeus, 1758) | Ah | 1 | 0.01 | 4.75 | 0.01 | 0.13 | 0.15 | MED | PL |
| Engraulidae | Anchoa lamprotaenia Hildebrand, 1943 | Aa | 39 | 0.56 | 54.03 | 0.07 | 1.42 | 2.06 | MEO | PL |
| Engraulidae | Anchoa mitchilli (Valenciennes, 1848) | Am | 47 | 0.68 | 70.01 | 0.09 | 1.94 | 2.71 | MED | ZB |
| Engraulidae | Cetengraulis edentulus (Cuvier, 1829) | Ce | 19 | 0.27 | 45.20 | 0.06 | 0.26 | 0.59 | MEO | ZP |
| Ariidae | Ariopsis felis (Linnaeus, 1766) | Af | 117 | 1.69 | 2734.97 | 3.60 | 5.81 | 11.11 | MED | ZB |
| Ariidae | Cathorops aguadulce* (Meek, 1904) | Ca | 891 | 12.88 | 22353.0 | 29.42 | 13.57 | 55.87 | ES | ZB |
| Synodontidae | Synodus foetens (Linnaeus, 1766) | Sf | 2 | 0.03 | 90.53 | 0.12 | 0.26 | 0.41 | MEO | PI |
| Batrachoididae | Opsanus beta (Goode & Bean, 1880) | Ob | 8 | 0.12 | 2263.20 | 2.98 | 1.03 | 4.13 | MED | ZB |
| Mugilidae | Mugil curema Valenciennes, 1836 | Mc | 7 | 0.10 | 329.84 | 0.43 | 0.39 | 0.92 | MED | OM |
| Belonidae | Strongylura marina (Walbaum, 1792) | Sm | 4 | 0.06 | 229.15 | 0.30 | 0.39 | 0.75 | MED | ZB |
| Belonidae | Strongylura notata (Poey, 1860) | Sn | 7 | 0.01 | 68.45 | 0.09 | 0.13 | 0.23 | MEO | ZB |
| Scorpaenidae | Scorpaena plumieri Bloch, 1789 | Sp | 1 | 0.01 | 286.90 | 0.38 | 0.13 | 0.52 | MEO | ZB |
| Centropomidae | Centropomus ensiferus Poey, 1860 | Cn | 4 | 0.06 | 70.70 | 0.09 | 0.26 | 0.41 | MEO | PI |
| Centropomidae | Centropomus parallelus Poey, 1860 | Cp | 58 | 0.84 | 1576.26 | 2.07 | 3.49 | 6.40 | MED | ZB |
| Centropomidae | Centropomus pectinatus Poey, 1860 | Ct | 16 | 0.23 | 470.02 | 0.62 | 0.90 | 1.75 | MED | ZB |
| Centropomidae | Centropomus undecimalis (Bloch, 1792) | Cu | 26 | 0.38 | 984.20 | 1.30 | 1.94 | 3.61 | MED | ZB |
| Carangidae | Caranx crysos (Mitchill, 1815) | Cc | 21 | 0.30 | 310.06 | 0.41 | 1.03 | 1.75 | MED | PI |
| Carangidae | Caranx hippos (Linnaeus, 1766) | Ch | 1 | 0.01 | 22.14 | 0.03 | 0.13 | 0.17 | MEO | PI |
| Carangidae | Caranx latus Agassiz, 1831 | Cl | 1 | 0.01 | 22.54 | 0.03 | 0.13 | 0.17 | MEO | PI |
| Carangidae | Chloroscombrus chrysurus (Linnaeus, 1766) | Cy | 2 | 0.03 | 3.40 | 0.00 | 0.26 | 0.29 | MEO | PI |
| Carangidae | Hemicaranx amblyrhynchus (Cuvier, 1833) | Ha | 7 | 0.10 | 24.37 | 0.03 | 0.78 | 0.91 | MED | PI |
| Carangidae | Selene vomer (Linnaeus, 1758) | Sv | 4 | 0.06 | 60.70 | 0.08 | 0.39 | 0.53 | MEO | ZB |
| Lutjanidae | Lutjanus analis (Cuvier, 1828) | La | 5 | 0.07 | 208.67 | 0.27 | 0.65 | 0.99 | MEO | ZB |
| Lutjanidae | Lutjanus apodus (Walbaum, 1792) | Lp | 3 | 0.04 | 52.90 | 0.07 | 0.39 | 0.50 | MEO | ZB |
| Lutjanidae | Lutjanus griseus (Linnaeus, 1758) | Lg | 34 | 0.49 | 1865.94 | 2.46 | 3.62 | 6.56 | MED | ZB |
| Lutjanidae | Lutjanus synagris (Linnaeus, 1758) | Ls | 8 | 0.12 | 136.34 | 0.18 | 0.65 | 0.94 | MEO | ZB |
| Gerreidae | Diapterus auratus Ranzani, 1848 | Da | 622 | 8.99 | 3955.10 | 5.21 | 6.33 | 20.53 | MEO | ZB |
| Gerreidae | Diapterus rhombeus* (Cuvier, 1829) | Dr | 3898 | 56.36 | 17629.3 | 23.20 | 13.18 | 92.74 | MED | ZB |
| Gerreidae | Eucinostomus argenteus Baird & Girard, 1855 | Ea | 64 | 0.93 | 349.43 | 0.46 | 1.81 | 3.19 | MED | ZB |
| Gerreidae | Eucinostomus gula (Quoy & Gaimard, 1824) | Eg | 42 | 0.61 | 581.87 | 0.77 | 1.94 | 3.31 | MED | ZB |
| Gerreidae | Eucinostomus melanopterus (Bleeker, 1863) | Em | 138 | 2.00 | 992.04 | 1.31 | 7.75 | 11.05 | MED | ZB |
| Gerreidae | Eugerres plumieri (Cuvier, 1830) | Eu | 505 | 7.30 | 9110.53 | 11.99 | 9.17 | 28.47 | MED | ZB |
| Haemulidae | Rhonciscus crocro (Cuvier, 1830) | Rc | 1 | 0.01 | 105.16 | 0.14 | 0.13 | 0.28 | MEO | PI |
| Haemulidae | Pomadasys ramosus (Poey, 1860) | Pr | 1 | 0.01 | 124.70 | 0.16 | 0.13 | 0.31 | MEO | ZB |
| Sparidae | Archosargus rhomboidalis (Linnaeus, 1758) | Ar | 1 | 0.01 | 59.20 | 0.08 | 0.13 | 0.22 | MED | OM |
| Sparidae | Archosargus probatocephalus (Walbaum, 1792) | Ap | 4 | 0.06 | 381.29 | 0.50 | 0.39 | 0.95 | MEO | OM |
| Polynemidae | Polydactylus octonemus (Girard, 1858) | Po | 14 | 0.20 | 267.54 | 0.35 | 0.78 | 1.33 | MED | ZB |
| Sciaenidae | Bairdiella ronchus (Cuvier, 1830) | Br | 10 | 0.14 | 457.48 | 0.60 | 0.65 | 1.39 | MED | ZB |
| Cichlidae | Mayaheros urophthalmus (Günther, 1862) | Mu | 1 | 0.01 | 14.00 | 0.02 | 0.13 | 0.16 | FS | ZB |
| Eleotridae | Dormitator maculatus (Bloch, 1792) | Dm | 3 | 0.04 | 19.23 | 0.03 | 0.13 | 0.20 | ES | DE |
| Eleotridae | Eleotris pisonis (Gmelin, 1789) | Ep | 1 | 0.01 | 0.50 | 0.00 | 0.13 | 0.14 | ES | PI |
| Eleotridae | Gobiomorus dormitor Lacepède, 1800 | Gd | 2 | 0.03 | 121.40 | 0.16 | 0.26 | 0.45 | ES | ZB |
| Gobiidae | Gobionellus oceanicus (Pallas, 1770) | Go | 46 | 0.67 | 599.36 | 0.79 | 3.23 | 4.68 | MEO | OM |
| Ephippidae | Chaetodipterus faber (Broussonet, 1782) | Cf | 2 | 0.03 | 197.45 | 0.26 | 0.13 | 0.42 | MEO | OM |
| Paralichthyidae | Citharichthys spilopterus Günther, 1862 | Cs | 152 | 2.20 | 1057.56 | 1.39 | 7.49 | 11.08 | MED | ZB |
| Paralichthyidae | Etropus crossotus Jordan & Gilbert, 1882 | Ec | 1 | 0.01 | 3.43 | 0.00 | 0.13 | 0.15 | MEO | ZB |
| Achiridae | Achirus lineatus (Linnaeus, 1758) | Al | 64 | 0.93 | 612.85 | 0.81 | 4.26 | 6.00 | MED | ZB |
| Achiridae | Trinectes maculatus (Bloch & Schneider, 1801) | Tm | 7 | 0.10 | 29.60 | 0.04 | 0.52 | 0.66 | MEO | ZB |
| Tetraodontidae | Sphoeroides spengleri (Bloch, 1785) | Ss | 1 | 0.01 | 28.05 | 0.04 | 0.13 | 0.18 | MEO | ZB |
| TOTALS | 6916 | 100 | 75982.0 | 100 | 100 | 300.00 |
Importance Value Index (IVI): * dominant species. Community inhabitant (CI): MED = marine estuarine-dependent, MEO = marine estuarine-opportunist, ES = estuarine species, FS = freshwater species. Trophic category (CT): PL = planktivore, OM = omnivore, DE = detritivore, PI = piscivore, ZB = zoobenthivore. Abbreviations (AB) used in Figure 5 are shown.
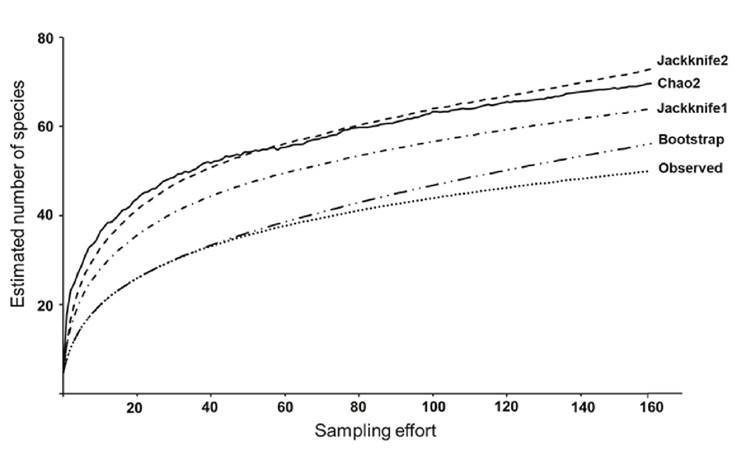
Figure 2 Estimated accumulation curves of fish species caught in the Sontecomapan Lagoon System. The trends of the different statistical tests calculated are indicated.
Spatial and temporal variation of diversity: The spatial analysis of average values of diversity H’, richness D and evenness J’, is integrated in Figure 3 (A, B, C). A similar trend was observed in the three mentioned indices with higher average values towards the tidal channel zone of the system (H´= 1.52±0.26, D = 1.92±1.22; J´= 0.82±0.34), and the lowest towards the interior of the system and areas of greater fluvial influence (H´= 1.07±0.43, D = 1.43±0.53, J´= 0.53±0.18). The spatial trend of these indices was related to the low number of species and the dominance of some of them in the system, there were no significant differences between sites for these parameters (P > 0.05). The average temporal changes of H’, D and J’ are indicated in Figure 3 (D, E, F). The temporal trend in the three indices was similar with few variations between months. The highest averages of H’ (1.51±0.41), D (2.15±0.67) and J’ (0.76±0.14) occurred in February 2018, October 2018, and January 2020, respectively. The values of H´ per month tend to be low, less than 2.0, with statistically significant differences, F (7,150) = 2.88, P = 0.0102, Tukey test indicated that they were between February 2016 - February 2018 (P = 0.0403) and February 2016 - January 2020 (P = 0.0457). The D index was equally low, with statistically significant differences between months, F (7,150) = 4.23, P = 0.0006), Tukey test indicated that they were between February 2014 - October 2018 (P = 0.0215), February 2016 with October 2017 (P = 0.0191), with February 2018 (P = 0.0120) and with October 2018 (P = 0.0013).
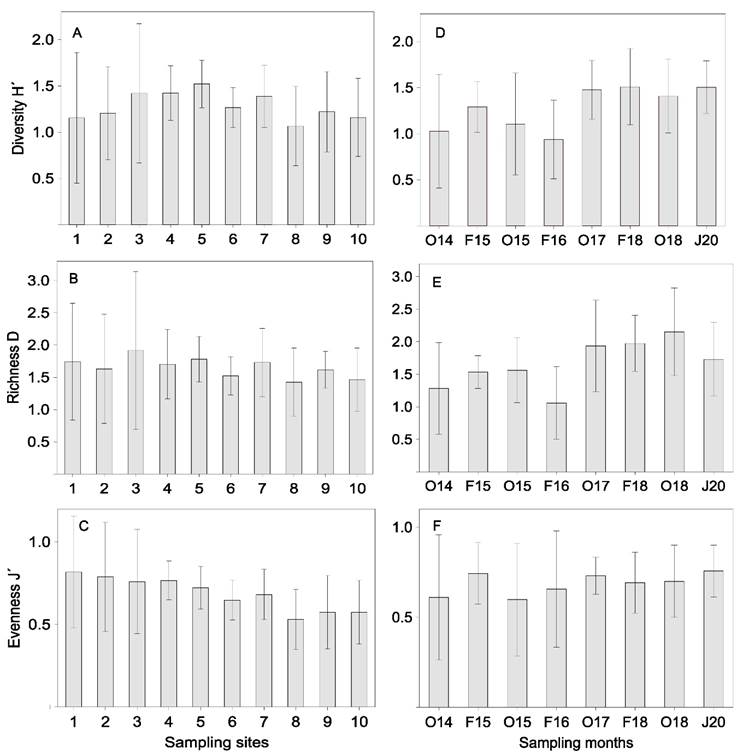
Figure 3 Spatial and temporal average values (± 1 SD) of the diversity indices H’, D and J’ for the fish community in the Sontecomapan Lagoon System.
Spatial and temporal variation of abundance: On a spatial scale, the average behavior of density, biomass, and average weight of the community is shown in Figure 4 (A, B, C). The highest average density value (0.062 ind./m2±0.09) was recorded at site 10, biomass (0.43 g/m2±0.30) at site 8 and average weight (32.9 g/ind.±27.3) at site 1. The lowest were density (0.002 ind./m2±0.002) and biomass (0.067 g/m2±0.08) at site 2 and average weight (8.9 g/ind.±8.7) at site 1. Significant statistical differences were found for the density, H (9,160) = 47.68, P < 0.001, the Z test showed that they were between the sites 1-8 (P = 0.0103), 1-9 (P = 0.0031) y 1-10 (P = 0.0064). Also, between sites 2-7 (P = 0.0430), 2-8 (P = 0.0067), 2-9 (P = 0.0020) y 2-10 (P = 0.0041). And between the sites 3-9 (P = 0.0212), and 3-10 (P = 0.0398). Likewise for biomass H (9,160) = 29.36, P = 0.0006, the Z test indicated that they were between the sites 1-8 (P = 0.0414), 2-5 (P = 0.0475) and 2-8 (P = 0.0321). The changes of these parameters in temporal scale are observed in Figure 4 (D, E, F). The average trends of these three parameters are similar over time. The highest averages in density (0.055 ind./m2 ±0.08) and biomass (0.379 g/m2±0.24) were presented in October 2015 and October 2018 respectively and for the average weight (22.2 g/ind.±21.8) in February 2015 and (22.4 g/ind.±27.46) in October 2017. No significant differences were found between months for these parameters (P > 0.05).
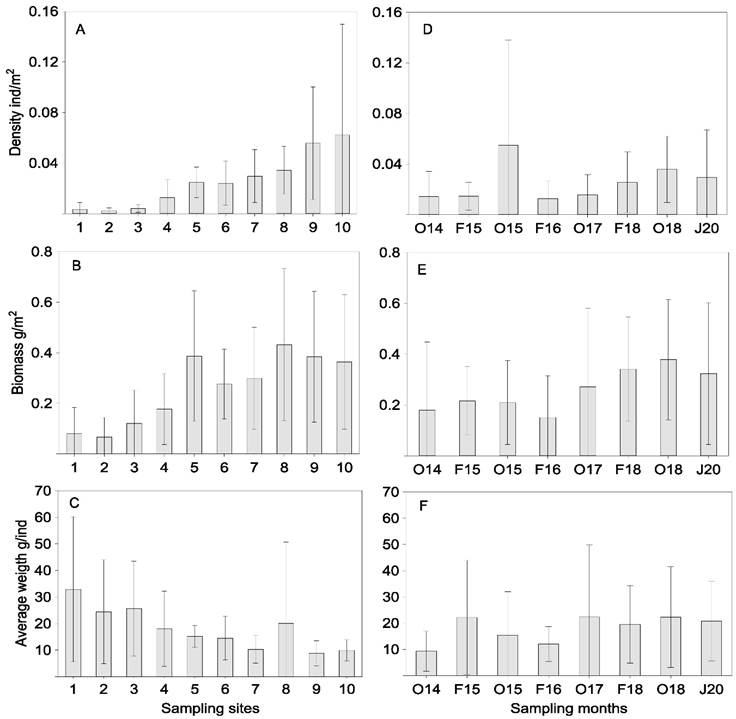
Figure 4 Spatial and temporal average values (± 1 SD) in density, biomass, and average weight for the fish community in the Sontecomapan Lagoon System.
Dominant species, community inhabitants and trophic categories: Two species were dominant, Diapterus rhombeus (Cuvier, 1829) (IVI = 92.7%) and Cathorops aguadulce (Meek,1904) (IVI = 55.9%) together represented 69.2% in number (4 789 individuals) and 53% in weight (40. 2 kg) of the total catch of the community, with frequencies of occurrence of 63 to 65% (Table 1). Other less abundant and smaller species that also contributed significantly to the community were Eugerres plumieri (Cuvier, 1830) and D. auratus Ranzani,1848. The behavior of the ecological inhabitants of the community is related to the environmental dynamics of this system, indicating that 23 species (46%) were marine estuarine-opportunists (MEO) such as Anchoa lamprotaenia Hildebrand, 1943, and 22 (44%) marine estuarine-dependent (MED) being the best represented D. rhombeus for its wide distribution in this lagoon. The estuarine species (ES) was represented by 4 species (8%) where C. aguadulce stands out with the widest distribution in the system. The only freshwater species (FS) collected was Mayaheros uropthalmus (Günther, 1862).
The fish community was composed of five trophic categories, 3 planktivorous species (6%) (ZP) being the most abundant Anchoa lamprotaenia Hildebrand, 1943, 1 detritivorous (DE) (2%) which was Dormitator maculatus (Bloch, 1792), 5 omnivores (OM) (10 %) such as Gobionellus oceanicus (Pallas, 1770) and Archosargus probatocephalus (Walbaum, 1792). Also 9 piscivores (PI) (18%), standing out for their abundance Caranx crysos (Mitchill, 1815) and Hemicaranx amblyrhynchus (Cuvier, 1833), as well as 32 zoobenthivores (ZB) (64%) such as Achirus lineatus (Linnaeus, 1758), Centropomus parallelus Poey, 1860 and Lutjanus griseus (Linnaeus, 1758).
Fish-habitat assemblages: The canonical correspondence analysis (CCA) (Fig. 5) shows the relationship between abundance of species, environmental variables, and sampling sites. The first two ordination axes had a total accumulated variance of 52%: axis 1, 40% and eigenvalue of 0.263 and axis 2, 12% and eigenvalue of 0.081. The most important factors in the distribution of the species for axis 1 were transparency (r = 0.881), depth (r = 0.664) and salinity (r = 0.639). Those that had the highest correlation with axis 1 corresponded to the estuarine-opportunist and estuarine-dependent marine inhabitants (Table 1) with minimal abundance associated with site 1 (marine inlet) of the system as Scorpaena plumieri Bloch, 1789, Caranx hippos (Linnaeus,1766) and Archosargus rhomboidalis (Linnaeus,1758). Another group of species from the two previous inhabitants with lower to intermediate abundance were distributed in sites 2 to 4 (tidal channel) such as Sphoeroides splengeri (Bloch, 1785), A. lamprotaenia, Synodus foetens (Linnaeus, 1766), C. faber and Strongylura marina (Walbaum, 1792), as well as the four species of the genus Lutjanus, the most abundant being L. griseus. Also, the species of the genus Eucinostomus, highlighting E. melanopterus and others as A. lineatus and Citharichthys spilopterus Günther, 1862. For axis 2, the main factors were salinity (r = -0.528) and dissolved oxygen (r = 0.479). The species that showed correlation with axis 2 correspond to the marine estuarine-dependent and estuarine inhabitants with minimum to maximum abundance, as the dominant species D. rhombeus and C. aguadulce. Some species of this assemblage with low abundance were associated with sites 5 and 7 with intermediate to low salinities such as Centropomus pectinatus Poey, 1860, C. parallelus, Bairdiella ronchus (Cuvier, 1830), Opsanus beta (Goode & Bean, 1880), Polydactylus octonemus (Girard,1858) and P. ramosus. Other species distributed on the site 8 with intermediate dissolved oxygen values were Gobiomorus dormitor Lacepède,1800, Trinectes maculatus (Bloch & Schneider, 1801), Cetengraulis edentulus (Cuvier, 1829), Strongylura notata (Poey, 1860) and D. maculatus. Sites 6 and 9 associated with axis 1 and site 10 with axis 2, represent the environment with less salinity, transparency, and depth due to fluvial influence in which marine dependent or opportunist and freshwater species were distributed with minimal abundance such as C. latus Agassiz, 1831, A. hepsetus (Linnaeus, 1758), Mugil curema Valenciennes, 1836, Etropus crossotus Jordan & Gilbert, 1882 and M. uropthalmus.
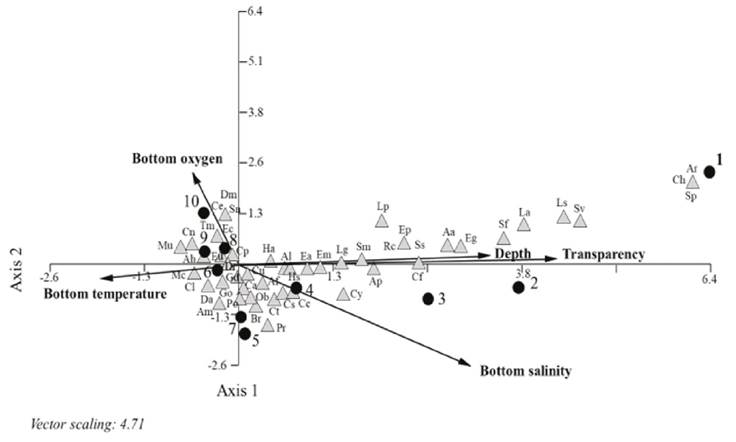
Figure 5 Canonical Correspondence Analysis Plot of species abundance, environmental variables, and sampling stations in the Sontecomapan Lagoon System. Arrow length and direction indicate the relative importance of environmental variables. Species abbreviations (AB) are listed in Table 1.
DISCUSSION
This paper integrates ecological information related to previous studies that have described the composition of fish species in the Sontecomapan Lagoon in different environments of this system (Aguirre-León et al., 2018). This study not only updates species richness, but also provides new estimates of species distribution, diversity, and abundance at spatial and temporal scales. In addition, multivariate statistical methods are used to determine the influence of physicochemical variables on the spatial patterns of the parameters just mentioned, as well as to establish the behavior of species assemblages. This determined the importance of carrying out complementary studies on the ecological structure of the community in this coastal system.
The studies that have been carried out in Sontecomapan from 1983 to 2017 have only integrated lists of the species present with some annotations on the hydrology of the system without further ecological analysis (Rodríguez-Varela et al., 2010; Castillo-Rivera & Lara-Domínguez, 2018). In this way, the present study increases the current knowledge about the richness of species in the Sontecomapan lagoon system, adding two new records to the system, C. faber and P. ramosus, so that the total reaches more than 120 species identified in 37 years. According to the models of the accumulation curves, the richness of species in this lagoon showed that the number of species collected during the sampling period was close to the estimated average value, which validates the fishing effort used in this study. However, the results suggest that the number of species in the Sontecomapan Lagoon can be increased by carrying out systematic sampling during the dry and rainy months, since a great variety of species use different habitats of the system for various biological activities and that they are related with the environmental changes in the different climatic seasons. In several studies it has been observed that environmental variables such as salinity and temperature have a great influence on the composition of species for different times of the year (Barletta et al., 2003, 2005; Arceo-Carranza et al., 2010; Díaz-Ruiz et al., 2018). Therefore, it is suggested to continue with additional studies in this lagoon, integrating environmental factors with ecological and biological aspects of the species to have a more complete interpretation of the results obtained here.
In tropical lagoon systems, the use of various habitats by fish species is known, determined by complex responses to environmental and biological factors, which is reflected in seasonal changes in community structure such as diversity, abundance, and biomass of fish (Barletta et al., 2005; Bouchereau et al., 2008; Vilar et al., 2011; Cowan et al. 2013; Aguirre-León et al., 2020).
In this study, it was observed that the changes in diversity and species richness were similar with high values in the connection channel and the middle part of the system, where the greatest number of euryhaline and stenohaline species of the families Carangidae, Gerreidae, Engraulidae, Centropomidae and Lutjanidae occurred, which represent 48% of the species in the community. This behavior is linked to the influence of the tide and salinity variations, which was reflected in the decrease in diversity with the salinity gradient towards shallow and turbid areas of fluvial influence, but with high values in the abundance of species such as D. rhombeus and C. aguadulce. Authors such as Barletta et al. (2005), Velázquez-Velázquez et al. (2008), Vaslet et al. (2010), Cowan et al. (2013) have also observed this inverse relationship between evenness and dominance in other similar tropical systems. Diversity is also related to depth, freshwater discharge and precipitation that condition the hydrology and transparency of the lagoon (Aguirre-León et al., 2014; Castillo-Rivera et al., 2017; Molina et al., 2020). During the months of study, the behavior of the diversity and richness of species was also related to the seasonal variations of salinity and temperature, as well as the exchange of species of the marine component. This behavior of the mentioned indices was reflected in the significant differences found for H and D between the months of this study. This behavior is like that reported in other coastal lagoons of the Gulf of Mexico, where it has been found that the temporality of the diversity indices is also related to changes in the tide between day and night, the dynamics of nutrients and an increase in primary production (Díaz-Ruiz et al., 2003; Arceo-Carranza et al., 2010; Castillo-Rivera et al., 2017). It is considered that the values of diversity and richness of species in Sontecomapan are low or similar when compared to other coastal systems of Veracruz such as the Tamiahua lagoon (Díaz-Ruiz et al., 2003), the Chica-Grande lagoon (Aguirre-León et al., 2014), the La Mancha lagoon (Díaz-Ruiz et al., 2018) and the El Ostion lagoon (Aguirre-León et al., 2020). This downward trend in the values of the diversity indices of fish communities has been observed in the last 20 years on the coast of Veracruz (Aguirre-León et al., 2018).
Variations in abundance are also influenced by changes in the environmental conditions of the system and by seasonal migrations of the species during their life cycles (Arceo-Carranza et al., 2010; Medina-Gómez et al., 2015; Díaz-Ruiz et al., 2018; Aragón-Flores et al., 2021). Other authors such as Azevedo et al. (2007) and Arceo-Carranza et al. (2010), have reported similar abundance patterns in other coastal systems related to environmental conditions and the seasonal migration of species linked to their life cycles. In the present study, salinity, temperature, and dissolved oxygen were related to variations in the abundance of fish populations. In the Sontecomapan lagoon, the average values of density and biomass showed a similar trend in space with an inverse relationship to the salinity gradient. This behavior of the indicated density and biomass was reflected in the significant differences found for these parameters between sampling sites. This is due to the dominance of D. rhombeus and C. aguadulce in low salinity areas, in addition to other species with intermediate abundance such as D. auratus, E. melanopterus, E. plumieri and C. spilopterus, which together incorporate greater biomass to the environment of fluvial influence. In studies carried out in estuarine lagoon systems, a similar behavior has been observed in the abundance of fish species, indicating that salinity variations act as a “control” factor that determines the presence of dominant species (Barletta et al., 2008; Molina et al., 2020; Sosa-Lopez et al., 2007; Aguirre León et al., 2020; Castillo-Rivera & Morgado-Dueñas, 2022). The average weight was inverse to the previous indicators, in this case towards the environments with the highest salinity where species of greater size and weight with less abundance were recorded, such as H. sabinus, A. felis and several species of the Centropomidae family that use them depending on the biological stages that return to the system. Azevedo et al. (2007), Arceo-Carranza et al. (2010), Perera-García (2011), Hernández-Vidal et al. (2014), have reported similar abundance patterns in other coastal systems related to environmental conditions and the seasonal migration of species linked to their life cycles. On a temporal scale, it was observed that during the months of October the highest density is represented by D. rhombeus and C. aguadulce and the highest average weight by E. plumieri, A. felis, H. sabinus (Lesueur, 1824) and O. beta with individuals of large sizes and greater weight. The variations in abundance observed are due to the use of the different habitats regulated by climatic changes that control the biology of the species, so there are patterns of preferential use in environments with the greatest saline influence and freshwater influence, which is reflected in the structure and dynamics of the community (Able, 2005; Cowan et al., 2013; Perera-Garcia et al., 2011; Reyes-Ramirez et al., 2017).
The CCA analysis made it possible to integrate and interpret information on the ecological behavior of the different fish species that use the system during their life cycles linked to hydrological changes. The spatial and temporal distribution and abundance of fish is an expression of the adaptations that they have developed, whether they are dominant or rare species. The fish-habitat analysis shows how the different fish components respond to the environment, largely related to the gradients of environmental variables that they optimize at the different stages of their biological cycles, as well as to the specific nutritional needs of the fish (Barletta et al., 2005; Pérez-Rufaza et al., 2007; Cowan et al., 2013, Potter et al., 2015). In Sontecomapan lagoon, studies on fish assemblages and their relationship with the environment are very scarce (Aguirre-León et al., 2018). In the present study, the information and ecological analysis on these is expanded, observing that of the 50 species that make up the community, the dominance of D. rhombeus and C. aguadulce prevails as marine estuarine-dependent and estuarine inhabitants, respectively, with zoobenthivores feeding habits. There is no retrospective information on the dominant species of Sontecomapan as part of their fish assemblages, however in other coastal systems of the Gulf of Mexico, these two species have been dominant in previous studies in recent decades (Aguirre-León & Díaz-Ruiz, 2000 y 2006; Pineda-Peralta et al., 2016; Castillo-Rivera et al., 2017; Aguirre-León et al., 2020). The environmental factors that determine to a greater extent the structure of fish assemblages in Sontecomapan are salinity, transparency, and depth, to a lesser extent, dissolved oxygen, and temperature. The fish assemblages that are distributed according to the environments for the lagoon included in different proportions the different types of fish inhabitants recognized for coastal systems (Elliott et al., 2007; Potter et al., 2015). However, those of marine estuarine-opportunist and estuarine-dependent predominate and, to a much lesser extent, estuarine and freshwater species. These inhabitants are grouped into the five trophic categories present in the system, with omnivores and zoobenthivores predominating. Some species of the assemblages of this lagoon that characterized the environment of greater salinity and transparency like marine inlet and tidal channel, were the marine stenohaline and occasional species, A. lamprotaenia, S. plumieri, S. spengleri, and other marine euryhaline species with low abundance such as Lutjanus apodus (Walbaum, 1792), L. synagris, Eucinostomus gula (Quoy & Gaimard, 1855) and Rhonciscus croco (Cuvier, 1830). These species mainly belong to piscivores, zoobenthivores, and zooplanktivores consumers. In the environment with intermediate salinities and less transparency, the dominant species D. rhombeus and C. aguadulce predominated, and a significant proportion of marine euryhaline species where the species C. parallelus and C. undecimalis (Bloch, 1792) stand out as zoobenthivores. In the environment with the greatest fluvial influence, a combination was recorded mainly of estuarine, marine estuarine-dependent species and scarcely the freshwater ones, being omnivorous and detritivorous consumers. The presence of such fish assemblages with similar proportions among community components, consumer types and dominant species have also been observed in several coastal systems of the Gulf of Mexico (Sheridan & Minello, 2003; Pérez-Rufaza et al., 2007; Arceo-Carranza et al., 2010; Aguirre-León et al., 2014; Arceo-Carranza & Chiappa-Carrara, 2015; Castillo-Rivera et al., 2017; Díaz-Ruiz et al., 2018; Aguirre-León et al., 2020).
The analysis of the results in the Sontecomapan lagoon allows us to visualize changes in the structure and function of the fish community related to the use of habitats at different times by the species. These patterns of use during their life cycles are related to the hydrological and climatic changes of the ecosystem. It is recognized that knowledge of the integrated environmental and ecological processes is extremely important to understand the health status of the system. This is based on spatial and temporal patterns of richness, diversity, and abundance, especially for this lagoon that lacks systematic information, despite being part of a Biosphere Reserve. Therefore, the Sontecomapan lagoon system requires more information that contributes to the conservation of fish diversity in the future as a protected natural area.

