


 nueva página del texto (beta)
 Inglés (pdf)
 Artículo en XML
 Referencias del artículo
 Enviar artículo por email
 Citado por SciELO
  Similares en
SciELO
Similares en
SciELO 
 Permalink
Introduction
Tourism is considered an important activity that generates foreign exchange. An industry that stimulates public and private infrastructure investments generates direct and indirect jobs and promotes productivity and trade. Its multiplier effect is recognized through direct, indirect, and induced impacts on other sectors and industries, promoting the development of local economies. It has also contributed to solving macroeconomic problems such as unemployment and currency instability.
Between 2009 and 2019, real growth in international tourism receipts outpaced global GDP growth. Total industry exports reached 1.7 billion USD. According to United Nations World Tourism Organization (UNWTO), tourism accounted for 7% of global exports and 28% of service exports (UNWTO, 2021). Moreover, it reached the third position in exports after fuels and chemical products. In 2019, the world’s ten most important tourist destinations received 40% of international arrivals, and the ten largest income generators represented 50% of total tourism income (UNWTO, 2021). In 2020, with the appearance of COVID-19, the tourism industry showed the biggest decline in years, ending a stage of sustained and almost uninterrupted growth. Because of COVID-19, tourists’ perception of risk and uncertainty increased considerably. Tourism indicators were unstable after the closure of 150 destinations at the beginning of 2020. Tourist arrivals fell by 67 million, with losses of US$80 billion in exports and higher prices in transport and accommodation (UNWTO, 2020).
Tugcu (2014) considers that this relationship can be affected by the economic structures of each country, sectoral interrelationships, historical background, and the context associated with political, environmental, sociological, ecological, and economic structures. The complexity between tourism development and economic growth is also associated with the synergies and interdependencies established (Tugcu, 2014). Badulescu et al. (2018) state that tourism activity generates adequate returns despite political and economic uncertainty. Therefore, the tourism industry is more likely to be stable in the long term despite a general stagnation of the economy (Aratuo & Etienne, 2019). The UNWTO (2021) recognizes France, Spain, the United States, China, Italy, Turkey, Mexico, Thailand, Germany, and the United Kingdom as the top ten world destinations according to international tourist arrivals. This group of countries receives 40% of global arrivals. Of these countries, the United States, Spain, France, the United Kingdom, Italy, Germany, and China are also among the top ten destinations based on international tourism receipts. The ten main countries generating income represent 50% of the total international tourist income (UNWTO, 2021). This percentage for the year 2018 was distributed in the sample countries as follows: Australia (6.54%), China (5.81%), France (9.73%), Germany (6.25%), Italy (7.12%), Japan (5.95%), Spain (10.75%), United States (31.10%), and the United Kingdom (7.55%) (UNWTO, 2021).
According to the literature reviewed in the following Section, the exchange rate and economic growth are expected to have a positive influence on tourism demand (see, for example, Işık et al., 2020; Navarro-Chávez et al., 2022). That is, greater economic growth or a depreciation of the exchange rate generates greater demand for tourism. Uncertainty has a negative impact on tourism; but greater uncertainty reduces travel plans (see, for example, Gozgor & Ongan (2017); Işık et al., 2020).
In econometric terms, it is essential to consider cross-section dependence problems. In this case, the PCSE and the heteroskedasticity methods can be a solution because they are considered robust to compare contemporary correlation problems between time series and cross-sectional data (Hurtado (2018); Bailey and Katz (2011)).
This paper aims to determine the relationship between tourism demand and economic growth, real exchange rate, and EPU in Australia, China, France, Germany, Italy, Japan, Spain, the United States, and the United Kingdom from 1998 to 2018.
According to the literature review, there is no evidence on the effect of these variables jointly on tourism (neither on the relationship among uncertainty and tourism demand) in these main tourist countries. Specifically, this research contributes to the literature on tourism in the following aspects: 1) it studies the joint influence of economic growth and the EPU on demand for tourism in the world’s leading destinations for international tourism according to international tourist income; 2) it applies a panel data analysis that takes cross-section dependence into account; 3) in addition, the heterogeneous causality relationships between these variables and the demand for tourism are studied. Knowing the influence of these variables can be helpful for the design of policies that contribute to strengthening tourism demand in these countries. It is important because tourism is one of the most dynamic activities, and these countries are the main tourist destinations worldwide.
The article is structured as follows: in addition to the introduction, Section 2 briefly describes the literature review; in Section 3, the methodology is explained; in Section 4, the main results are presented; in Section 5, the results are discussed; and finally, Section 6 includes the conclusions and implications.
Literature Review
Tourism is a phenomenon that generates the movement of people to towns, cities, countries, or places outside their usual environment for personal or commercial/professional purposes (UNWTO, 2008). Tourists pay for goods and services such as food, drinks, accommodation, fuel, transportation, entertainment, etc., which allow them to enjoy their free time and survive in different environments (Rigol, 2009). It is considered that economic variables such as travel cost, exchange rate, level of disposable income, etc., are directly related to consumers’ desire for travel decisions and the demand for tourism-related products (Fletcher et al., 2017; Netto & Lohmann, 2016). However, other variables can also affect tourism demand. Since the crisis of the 1930s, according to Keynes (1936), economic uncertainty was one of the essential elements that determined economic behavior and stock prices.
The global economic scenario is uncertain and very sensitive to the uncertainties generated by economic policy decisions of all actors and governments, which can affect the size of the general economic activity (Işık et al., 2020). Therefore, this uncertainty can influence consumers’ travel and vacation plans, which affect tourism demand (Işık et al., 2020).
The empirical studies of panel data investigating the link between economic growth and tourism are collected in four hypotheses. First, tourism leads to the economic growth (TLEG) hypothesis, considering that tourism affects economic growth.
Some studies validating this hypothesis are: Fahimi et al. (2018) for Barbados, Cuba, Cyprus, the Dominican Republic, Fiji, Haiti, Iceland, Malta, Mauritius, and Trinidad and Tobago; Zhu & He (2021) for 29 provinces of China; Pegkas (2020) for Greece; Wijijayanti (2021) for eight countries in Southeast Asia; and Hristov-Stančić et al. (2022) for Serbia.
In the economy-driven tourism growth (EDTG) hypothesis, political, economic, and social conditions promote tourism development. Some works that validate this hypothesis are: Martins et al. (2017) for 218 countries; Badulescu et al. (2018) for Bulgaria; Croatia, Czech Republic, Estonia, Hungary, Latvia, Lithuania, Poland, Romania, Slovakia, and Slovenia; Aratuo & Etienne (2019) for six tourism subsectors in the United States; Gričar et al. (2021) for Montenegro; and Sari-Hassoun et al. (2021) for Algeria.
The third feedback hypothesis maintains that there are bidirectional causality relationships. Some studies have supported it, such as: Dogru & Bulut (2018) for Croatia, Greece, France, Italy, Slovenia, Spain, and Turkey; Rasool et al. (2021) for Brazil, Russia, India, China, and South Africa; Anagnostou et al. (2021) for the eurozone countries; Gounder (2022) for the Republic of Mauritius.
The fourth is the neutrality hypothesis, which indicates that tourism does not affect economic growth. Some studies have validated this last hypothesis, for example, Çaglayan et al. (2012) for 135 countries, Mérida and Golpe (2014) for Spain, and Haller et al. (2021) for 29 countries of the European Union.
As mentioned above, uncertainty has also been a variable that affects tourism demand. The literature relates political instability with terrorism, political conflicts that affect peace, social unrest, strikes, and conflicts, such as crises, wars, hostilities, government changes and coups, political violence, and insecurity. Authors such as Gozgor and Ongan (2017) investigate the effects of EPU on direct tourism sales, concluding that a higher level of EPU leads to decreases in tourism spending by domestic tourists in the United States. Işık et al. (2020) investigate the efficiency and impact of the EPU index in predicting tourism demand in the United States.
Aloui et al. (2021) evaluate the effect of political risk and economic instability on tourist arrivals in Tunisia. Wu et al. (2021) study the impact of EPU on tourism in the BRIC countries, Brazil, Russia, India, and China. Gholipour et al. (2022) state that the increase in uncertainty in Canada, Russia, Spain, and the United Kingdom decreases tourist flows from these countries to African countries. Navarro-Chávez et al. (2022) study the tourism demand of nine main OECD countries in Mexico and point out that the effects of the EPU on demand are adverse in developed countries, while for emerging economies the relationship is positive. More recently, Sharma and Khanna (2023) find a negative relationship in the short term between uncertainty and tourism, but in the long term, this relationship is positive is positive for the 19 countries that were included in the analysis.
According to the literature, the exchange rate is one of the traditional variables affecting tourism behavior. For example, Khoshnevis and Khanalizadeh (2017) analysed international tourist arrivals to the US from 14 countries, and their results show that the real exchange rate significantly affects international tourism demand. Regarding the demand for tourism from the countries United States-Mexico-Canada Agreement (USMCA), Işık et al. (2020) find a positive relationship between the exchange rate and the demand for tourism from Mexico and Canada to the United States. Navarro-Chávez et al. (2022) study the tourism demand of nine main OECD countries in Mexico. These authors find a positive relationship between the exchange rate and the demand for tourism in both the developed and emerging countries studied. According to the reviewed literature, it is expected that the exchange rate and economic growth have a positive influence on tourism demand, while uncertainty affects it negatively. A higher income level or a depreciation of the exchange rate stimulates the demand for tourism, while uncertainty reduces tourist travel plans.
Methodology
This research includes annual data from 1998 to 2018. The World Tourism Organization recognizes France, Spain, the United States, China, Italy, Turkey, Mexico, Thailand, Germany, and the United Kingdom as the top ten world destinations according to international tourist arrivals in 2019 (UNWTO, 2021). However, the top ten countries by tourism income are on the same list except for Mexico and Thailand, these being replaced by Japan and Australia. According to the above criteria, the panel comprises nine coun- tries, except Thailand, because they do not have economic policy uncertainty variable data. The countries selected in the study sample are also identified among the top ten main destinations according to international tourist income.
The panel data study is composed of four variables. The dependent variable is the international tourism receipts (ITR), and the independent variables are gross domestic product per capita (GDP), the real exchange rate (ER), and EPU. Natural logarithms were applied to the variables, and the econometric model is shown below:
where i indicates the cross-section, which includes the eight countries in the sample; t is the period of the data, from 1998 to 2018;
Data on ITR (dollars at current prices), GDP (dollars at constant 2010 prices), and ER (Real Effective Exchange Rate Index, 2010 = 100) were taken from the World Bank (https://datos.bancomundial.org/). EPU is an index taken from The Policy Uncertainty (https://www.policyuncertainty.com/global_monthly.html). Data for Australia, China, France, Germany, Italy, Japan, Spain, the United States, and the United Kingdom were retrieved online in October 2021.
Cross-sectional dependence
Recent studies indicate a high probability that the variables of the panel data models show cross-section dependence (De Hoyos & Sarafidis, 2006; Gómez & Rodríguez, 2020; Navarro-Chávez et al., 2022). This problem responds to unobserved components, frequent shocks, spatial or spillover effects, the magnitude of correlations between the cross-sections, and the nature of the depen- dence itself (Baltagi & Pesaran, 2007; De Hoyos & Sarafidis, 2006). Interdependence or transversal dependence in panel data is generated by competition, direct effects, externalities, and other factors (Xu et al., 2016).
Panel data exhibit cross-sectional dependence in estimation results, generally becoming inconsistent and biased. Pesaran (2004) suggests an error cross-section (CD) dependence test applica- ble to dynamic heterogeneous panels characterized by short T (the panel’s time dimension) and large N (the cross-sectional dimension). Pesaran’s (2004) test has the non-dependence of the cross-section as a null hypothesis. Its asymptotic distribution is also expected in panels with small samples.
Unit Root
Baltagi & Pesaran (2007) point out that the first generation unit root and cointegration tests may not be adequate with the assumption of cross-sectional independence. Pesaran (2007) addresses the cross-sectional dependence problem by augmenting the standard DF (or ADF) regressions through the lagged level series and their cross-sectional averages and using the individual series in the first differences. The unit root tests proposed by Pesaran take place in the simple augmented averages of ADFs of independent cross-sections, known as CADFs. In this way, unprecedented asymptotic results associated with individual CADF statistics are achieved, and their simple averages are identified as the IPS augmented cross-section test (CIPS).
Westerlund cointegration test (2007)
Persyn & Westerlund (2008) highlight the importance of using panel cointegration techniques to consider the time series and cross-section dimensions. However, Westerlund (2007) comments that some studies fail to reject the null hypothesis of no cointegration despite the theory indicating strong cointegration relationships. This author proposed null hypothesis tests of non-cointegration based on structural and non-residual dynamics without common factor restrictions. The Westerlund cointegration test has additional advantages: it is based on the normal distribution; it considers autocorrelation and heteroscedasticity; it supports cross-section dependence within or between panel units; it is suitable for small samples; and it has high power compared to residue-based cointegration tests; in addition, it allows to significantly reduce the distortions resulting from the use of the asymptotic normal distribution (Chrid et al., 2021).
Long-term model
Some methods have been proposed to estimate the long-term parameters in nonstationary panels. For example, the FMOLS estimator is de- scribed by Phillips and Moon (1999). FMOLS was initially designed to provide optimal estimates of cointegrating regression. The method modifies the least squares to consider the effects of series correlation and endogeneity in the regressors that result from a cointegration relationship. The FMOLS proposal is a semi-parametric estimation method that corrects the bias in finite samples of the Ordinary Least Square (OLS) estimator caused by the serial correlation of cointegration errors and endogeneity in the regressors. The result is an asymptotically unbiased and completely efficient estimator.
In the presence of cross-section dependence, one of the methods used is the PCSE, which allows a better inference of the estimates with cross-section dependence. Furthermore, this method includes efficient variance and covariance estimators under different heteroscedasticity and autocorrelation problems (García Santana, 2020). Therefore, it is considered a method with accurate results, even in complicated panel error structures (Aparicio & Márquez, 2005). Furthermore, the PCSE method is considered robust regarding contemporary correlation problems between time series and cross-sectional data, as well as heteroskedasticity (Hurtado, 2018; Bailey & Katz, 2011). The presence of cross-section dependence and serial correlation presents a problem because most common panel data estimators do not control for them simultaneously (Reed & Ye, 2011). Two possible solutions are the FGLS estimator proposed by Parks (1967) and the PCSE estimator proposed by Beck and Katz (1995). However, according to Reed & Ye (2011), the latter estimator is substantially better than the former. Therefore, the FMOLS, PCSE, and FGLS will be used in this investigation to allow for robustness in the results.
Causality test
When there is a long-term equilibrium relationship between the variables, there must be a causality relationship in at least one direction (Granger, 1988). The Panel Vector Error Correction Model (PVECM) is estimated to know the variables’ short- and long-term causality relationships. Besides, the Dumitrescu & Hurlin (2012) test allows us to contemplate the dimensions of heterogeneity, which include the heterogeneity of the causality relationships and the heterogeneity of the regression model that tests Granger causality with excellent statistical properties in small samples, although there is cross-section dependence.
Results
Figure 1 shows the behavior of the ITR and EPU variables used in the study. The dependent variable ITR shows that the country with the highest tourist income is the United States; however, all the other countries have a positive trend. The EPU shows more irregular behavior, with strong variations for all countries. In 2018, China led the highest UPE rates, followed by France and Germany.
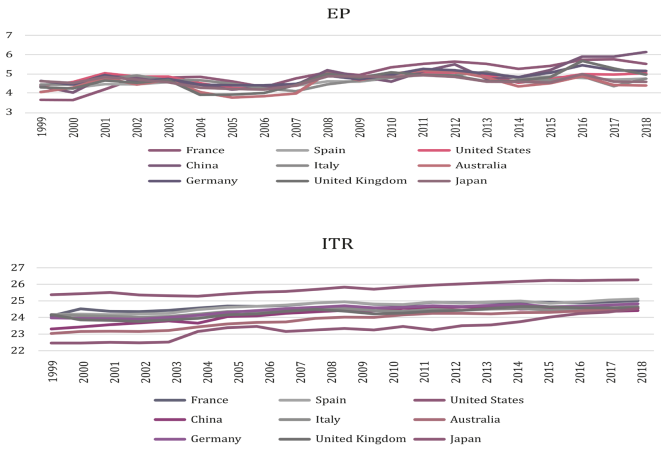
Source: World Bank (https://datos.bancomundial.org/) and The Policy Uncertainty (https://www.policyuncertainty.com/global_monthly.html).
Figure 1 Behavior of the ITR and EPU variables of the sample countries (1998 - 2018).
Cross-section dependence test
The results of the cross-sectional dependence test are presented in Table 1. The null hypothesis of no dependence is rejected for all variables at the 1% significance level except the ER. Therefore, it is concluded that most variables show cross-section dependence, indicating the existing correlation between the data of each country included in the panel.
Table 1 Cross-section dependence test and Pesaran panel unit root test with cross-sectional.
| Cross-section dependence test | |||||
| Variables | Test Pesaran CD | ||||
| Statistic | Prob. | ||||
| ITR | 24.537*** | 0.000 | |||
| GDP | 17.835*** | 0.000 | |||
| ER | 0.212 | 0.831 | |||
| EPU | 17.339*** | 0.000 | |||
| Pesaran panel unit root test with cross-sectional | |||||
| Variables | Deterministic Parameters | CIPS | Critical values 10% | Critical values 5% | Critical values 1% |
| Levels | |||||
| ITR | constant and trend | -2.614 | -2.73 | -2.86 | -3.1 |
| GDP | -1.368 | -2.73 | -2.86 | -3.1 | |
| ER | -2.060 | -2.73 | -2.86 | -3.1 | |
| EPU | -2.652 | -2.73 | -2.86 | -3.1 | |
| First Differences | |||||
| ITR | Constant | -4.521*** | -2.21 | -2.34 | -2.60 |
| GDP | -2.671*** | -2.21 | -2.34 | -2.60 | |
| ER | -3.376*** | -2.21 | -2.34 | -2.60 | |
| EPU | -5.020*** | -2.21 | -2.34 | -2.60 | |
Source: Authors' calculations using Stata 16.0. Notes: *** denotes the rejection of the null hypothesis at the 1% level.
Panel unit root test
When there is cross-sectional dependence in the variables, the second-generation unit root tests suggested by Pesaran (2007) are adequate. Table 1 shows the results of the CIPS unit root test. All variables have a unit root in levels. The variables ITR, GDP, ER, and EPU are stationary in the first difference since the unit root hypothesis is rejected at a significance level of 1%. The results confirm that all variables are integrated of order one.
Westerlund test for cointegration
Westerlund test for cointegration Westerlund’s cointegration test (2007) allows for studying long-term relationships between the model’s variables, given that they are all integrated of order one. Table 2 presents the results of the cointegration test. The null hypothesis is rejected at the 95% confidence level, favoring the alternative hypothesis that some panels are cointegrated. The above results confirm the existence of cointegration between the variables of international tourism receipts, gross domestic product per capita, exchange rate, and economic policy uncertainty. However, as the variables are cointegrated, the Ordinary Least Squares method is not recommended to estimate the coefficients of long-term models since the estimated results may be inconsistent.
Table 2 Westerlund test for cointegration.
| H0: No cointegration | ||
| Ha: Some panels are cointegrated | ||
| Cointegrating vector: | Panel specific | |
| Panel means: | Included | |
| Time trend: | Included | |
| AR parameter: | Panel specific | |
| Variance ratio | Statistic | p-value |
| 1.805** | 0.035 | |
Source: Authors' calculations using Stata 16.0. Notes: ** denotes the rejection of the null hypothesis at the 5% level.
Estimation of long-term coefficients
In estimating the long-term model, all coefficients have the expected signs (Table 3). The coefficient is positive and statistically significant concerning the GDP variable at 1% significance. For example, when using the PCSE estimator, if the GDP increases by 1%, the dependent variable international tourism receipts, will increase by 0.28%, keeping the other variables constant, with a significance of 1%. The ER variable also has a positive coefficient at the 1% significance level. If the ER increases by 1%, the international tourism receipts will grow by 0.69%. It implies that a higher gross domestic product per capita and a real exchange rate depreciation drive higher demand for tourism, measured by the income generated from international tourism.
Table 3 Model estimation with PCSE, FGLS, and FMOLS.
| PCSE | FGLS | FMOLS | ||||
|---|---|---|---|---|---|---|
| Variable | Coef. | p-value | Coef. | p-value | Coef. | p-value |
| GDP | 0.288*** | 0.000 | 0.323*** | 0.000 | 1.891*** | 0.000 |
| ER | 0.695** | 0.033 | 0.653*** | 0.000 | 0.210*** | 0.000 |
| EPU | -0.003 | 0.965 | -0.001 | 0.940 | -0.080 | 0.351 |
Source: Authors' calculations using Stata 16.0. Notes: *** and ** denote the rejection of the null hypothesis at the 1% and 5% levels, respectively.
On the other hand, the EPU variable has a negative and not statistically significant coefficient. The FGLS and FMOLS methods were applied to verify the robustness of the results. The results are confirmed for all variables.
Causality tests
According to Table 4, in the long term, there is a causality relationship from EPU, ER, and GDP to ITR at the 1% level of significance, which implies that any movement of these variables affects the behavior of tourism demand. There is also a causality relationship from EPU, ER, and ITR to GDP at the 1% significance level, reflecting the importance of the three variables in economic activity. In the short term, there are bidirectional causality relationships between EPU and IRT; EPU and GDP; ER and GDP; at the 1% significance level, which means each variable has information that helps to predict the behaviour of the other better. There is a unidirectional causality relationship from ITR to GDP at a 1% significance level. One of the crucial issues in the econometrics of panel data is the heterogeneity of cross-sectional units.
Table 5 presents the results of the proposal developed by Dumitrescu & Hurlin (2012), which considers the analysis units’ heterogeneity in panel data. The null hypothesis of non-causality in a homogeneous way is rejected in seven cases. First, there are bidirectional causality relation- ships between GDP and ITR with 1% significance. Also, between the ER and GDP, with 99% confi- dence in both directions. In addition, three uni- directional heterogeneous causality relationships are established: from GDP to EPU with a signifi- cance of 1%, from ER to EPU with a significance of 5%, and from IRT to ER with a significance of 10%.
Table 4 Granger causality test results.
| Dependent variables | ∆ITR | ∆GDP | Short run ∆ER | ∆EPU | Long run ECT-1 |
|---|---|---|---|---|---|
| ∆ITR | - | 0.668 | 0.386 | 2.062*** | -0.311*** |
| ∆GDP | -4.762*** | - | 2.883*** | 10.771*** | -0.021*** |
| ∆ER | 0.641 | 3.621*** | - | 0.148 | 0.013 |
| ∆EPU | -2.274*** | 27.654*** | 0.117 | - | 0.160 |
Source: Authors' calculations using Eviews 11. Note: *** denotes statistical significance at the 1% level.
Table 5 Results of the heterogeneous causality test.
| Null Hypothesis | W-Stat | Prob. | Decision |
|---|---|---|---|
| GDP does not homogeneously cause ITR | 2.985*** | 0.001 | Reject |
| ITR does not homogeneously cause GDP | 2.863*** | 0.003 | Reject |
| ER does not homogeneously cause ITR | 1.538 | 0.494 | Accept |
| ITR does not homogeneously cause ER | 2.226* | 0.065 | Reject |
| EPU does not homogeneously cause ITR | 1.410 | 0.639 | Accept |
| ITR does not homogeneously cause EPU | 1.654 | 0.379 | Accept |
| ER does not homogeneously cause GDP | 5.662*** | 0.000 | Reject |
| GDP does not homogeneously cause ER | 5.357*** | 0.000 | Reject |
| EPU does not homogeneously cause GDP | 1.154 | 0.970 | Accept |
| GDP does not homogeneously cause EPU | 2.810*** | 0.004 | Reject |
| EPU does not homogeneously cause ER | 0.672 | 0.437 | Accept |
| ER does not homogeneously cause EPU | 2.270** | 0.045 | Reject |
Source: Authors' calculations using Eviews 11. Notes: *** and ** denote the rejection of the null hypothesis at the 1% and 5% levels, respectively.
The results of the long-term model found in this research are consistent with some studies on the relationship between economic growth and tourism. In contrast, the effect of the EPU on tourism demand is negative but not statistically significant. To mention a few examples, Gozgor & Ongan (2016) show a positive influence of disposable income on tourism spending in the United States. In addition, the EPU coefficient was negative and statistically significant in the long term. Furthermore, Ongan & Gozgor (2018) show a positive and significant incidence of real GDP per capita to the number of Japanese tourist arrivals to the US and a negative and significant impact of the EPU on the dependent variable tourist arrivals. Işık et al. (2020) show that GDP increases the number of arrivals with statistically significant coefficients. On the other hand, the EPU shows negative and significant coefficients, which affect Mexico and Canadian tourists in the USA. In this same sense, Navarro-Chávez et al. (2022) find that income positively influences the tourist demand for Mexico in the main developed countries of the OECD, while the EPU negatively affects the demand of these same countries. Some investigations also match the results obtained in the heterogeneous causality test. There is an agreement in the bidirectional causality relationship between the GDP and ITR, with the results obtained by Tugcu (2014) and Dogru & Bulut (2018).
The countries selected for the study have demonstrated their leadership, which are the world’s top ten most important tourist destinations (UNWTO, 2021). The results obtained in this model corroborate the theoretical discussion related to variables that affect the development of tourism demand. The countries in this study must continue promoting tourist activity due to the industry’s macroeconomic and microeconomic development implications. Government officials, as managers of public policies, must consider the importance of economic growth and the EPU in the tourism sector. In addition, the local actors involved must be considered and include interaction with tourists (feedback), which promotes tourism through recommendations to their own friends and relatives.
Conclusions and implications
This paper studies the relationship between tourism demand and economic growth, exchange rate, and economic policy uncertainty in Australia, China, France, Germany, Italy, Japan, Spain, the United States, and the United Kingdom. Panel data analysis is used to attain this. According to the second generation unit root test, cross-section dependence exists in most variables, which are integrated into order one. Furthermore, there is the presence of long-term equilibrium relationships between the variables.
The results of the long-term model for the variables studied were obtained through the PCSE, FGLS, and FMOLS. The GDP and ER positively impact the tourism demand. The EPU negatively influences international tourists, but it is not statistically significant. However, in the long term, there is a causality relationship from EPU, ER, and GDP to ITR, which implies that any movement in these variables affects the behavior of tourism demand. There is also a causality relationship from EPU, ER, and ITR to GDP, which reflects the importance of the three variables in the economic activity of these countries. In the short term, there are two-way causality relationships between EPU and IRT; UPE and GDP; RE and GDP; which means that each variable has information that helps to predict the behaviour of the other better. In addition, there is a unidirectional causality relationship from ITR to GDP, which reflects tourism’s importance in these countries’ economic activity.
The feedback or reciprocal hypothesis is verified through the heterogeneous causality test of Dumitrescu & Hurlin (2012), with a bidirectional relationship between ITR and GDP variables. The feedback hypothesis suggests that tourism investments will affect general economic growth. At the same time, investments in other sectors of the economy will also be reflected in an increase in tourism in general.
The previous implies that these countries must generate economic growth, promote tourism, and facilitate the greatest number of tourist arrivals to boost tourism demand in the main countries that generate the highest income from tourism. Maintaining a competitive exchange rate is essential to boost the demand for international tourism in these countries. Uncertainty is a variable that influences the postponement or cancellation of tourist trips in these countries. Therefore, this uncertainty must be reduced to boost greater demand for tourism from these countries. In future research, it would be interesting to study the influence of some variable that measures environmental degradation, such as carbon dioxide emissions or the ecological footprint. In addition, it is also essential to include an analysis of the possible presence of structural changes in the econometric modeling.

