


Servicios Personalizados
Revista
Articulo
 texto en
  Inglés (pdf)
 Artículo en XML
 Referencias del artículo
 Enviar artículo por email
Indicadores
-
 Citado por SciELO
 -
 Accesos
Links relacionados
-
 Similares en
SciELO
Similares en
SciELO
Compartir

 Permalink
Revista mexicana de ciencias pecuarias
versión On-line ISSN 2448-6698versión impresa ISSN 2007-1124
Rev. mex. de cienc. pecuarias vol.7 no.3 Mérida jul./sep. 2016
Articles
Tier II estimation of enteric methane emission in dairy cow herds in Querétaro, México
a Facultad de Ciencias Naturales. Universidad Autónoma de Querétaro. 76230. Juriquilla, Querétaro. México. Correo electrónico: guevara@uaq.mx. Correspondencia al segundo autor.
b Facultad de Medicina Veterinaria y Zootecnia. Universidad Nacional Autónoma de México. México.
Methane (CH4) contributes to climatic change and livestock enteric fermentation is the most important anthropogenic source. The Intergovernmental Panel on Climate Change establishes continental default emission factors for enteric methane (Tier I); but decisions and evaluation of mitigation needs more precise estimates. Therefore, the objective was to calculate the enteric emission of Holstein-Friesian herds in Queretaro, México using milk test-day records (Tier II). Lactation curves were modeled using the incomplete gamma function according to lactation number and herd. A total of 11,092 lactations from 2007 had an average 305 d milk yield of 9,985 kg. Lactation curve was different between primiparous and multiparous; average days in milk were 365±21 d. During lactation, the primiparous and multiparous enteric emission at 305 d was 165.7±3.8 and 181.6±8.3 kg CH4 head-1; at 365 d was 201.8±4.6 and 223.7±11.0 kg CH4 head-1 (P<0.0025). Enteric emission intensity was similar between primiparous and multiparous (18 and 19 g CH4 kg-1 milk), similar to reports in the literature for high yielding cows. Test day records were useful to characterize yield, days in milk and parity influencing the estimates of enteric emission intensity.
Key words: Climatic change; Emission factor; GHG; Mitigation; Methane
El metano (CH4) contribuye al cambio climático y su fuente antropogénica más importante es la fermentación entérica del ganado. A nivel continental el Panel Intergubernamental de Cambio Climático establece factores de emisión entérica de CH4 por defecto (Tier I); pero las decisiones y evaluación de la mitigación necesitan estimaciones más exactas. Así, el objetivo fue calcular la emisión de metano entérico de hatos de vacas Holstein-Friesian en Querétaro, México con datos de pesaje de leche (Tier II). Las curvas de lactación se modelaron con la función gamma incompleta por lactancia y hato. Un total de 11,092 lactancias del 2007 tuvieron un rendimiento ajustado a 305 días (d) de 9,985 kg leche. La curva de lactancia fue diferente entre primíparas y multíparas; la duración de la lactancia fue 365±21 días. Durante la lactancia, la emisión entérica para primíparas y multíparas a 305 días fue 165.7±3.8 y 181.6±8.3 kg CH4 vaca-1; a 365 d fue de 201.8±4.6 y 223.7±11.0 kg CH4 vaca-1 (P<0.0025). La intensidad de emisión entérica fue semejante entre primíparas y multíparas (18 y 19 g CH4 kg-1 leche), similar a lo reportado en la literatura para vacas de alta producción intensiva. Los registros de rendimiento fueron útiles para caracterizar el rendimiento, duración de la lactancia y el efecto de número de lactancia en su influencia sobre los estimados de intensidad de emisión entérica.
Palabras clave: Cambio climático; Factor de emisión; GEI; Mitigación; Metano
Introduction
Attempts to reduce greenhouse gases (GHG) are aimed at mitigating the causes of climate change. On an international level, GHG inventories measure progress made by different countries in reducing emissions in production sectors. In 2010, Mexico’s GHG emissions totaled 748,252 Gg carbon dioxide equivalents - 1 Gg is equal to 109 g1. The overall mass of gas emitted into the atmosphere and the radiative forcing effect of each GHG in this mass determines the importance of greenhouse gases such as CO2, CH4, N2O, and O3, among others. Methane (CH4) deserves particular attention among the GHG because its radiative forcing effect is 25 to 34 times greater than that of CO2, that is, 1 g CH4 equals at least 25 g Ceq2.
The role of livestock production in GHG emissions is actively debated, but clearly significant3,4,5. In Mexico, for example, total CH4 emissions from enteric fermentation accounted for 20.1 % methane emissions while fugitive emissions from petroleum production represented most of the remainder6. Enteric and manure-related CH4 is responsible for 75 to 95 % of total GHG emissions at dairy farms in 38 countries7. Worldwide, Mexico was in eleventh place as far as enteric CH4 emissions (22,244 Gg) in 19988. By 2010, however, emission from enteric fermentation was 37,961 Gg Ceq and that from feces management was 7,553 Gg Ceq, which together accounted for almost half the 92,184 Gg Ceq total CH4 emissions from the agricultural sector1. However, other studies have generated disparate figures for the total amount of CH4 emitted. One study reported emissions of 144,000 Gg CH4 in 1970 and 270,000 Gg CH4 in 2010 for the dairy sector in Mexico9, whereas another study reported emissions in 1995 to have been 285 Gg CH410. This wide range of figures highlights the need to reduce uncertainty in emissions estimations by studying emission factors and intensities.
Signatory countries of the United Nations Framework Convention on Climate Change (UNFCCC) agreed to annually report GHG emission inventories following Intergovernmental Panel on Climate Change (IPCC) guidelines, using either of three Tier or precision levels11. For CH4 emissions originating in enteric fermentation, Tier I considers activity levels and emission factors (EF) per head of livestock; the former are taken from livestock inventory data and the latter from default values specified for continental regions and productive systems. The CH4 emissions level is then calculated by multiplying the activity level by the EF. In Tier II, the EF are calculated from net energy intake for maintenance, activity, growth, gestation and lactation. Tier III determines the EF using direct GHG emissions measurement methodologies.
The Tier I methodology, based on calculation of EF per head, discourages changes in productivity as a mitigation strategy while GHG emissions per product unit decrease as productivity increases12. Emission intensity varies among producers in response to agroecological conditions, grazing and rearing practices, feed regimes and feed type. The concept of emission intensity is useful in evaluating mitigation strategies at the productive system level and for guiding feed intake patterns13.
Some data are not normally used in GHG inventory generation. Integrating them into inventory calculation can improve the cost:benefit ratio of inventory generation compared to other options such as running experiments, designing new measurement procedures or modifying existing methodologies or equations. For dairy herds in Mexico, an excellent source of this type of data is maintained by the Holstein Association of Mexico (Asociación Holstein de México - AHM), which collects, processes, certifies and publishes data on registered dairy herds. The AHM generates production indicators aimed at improving cattle genetics and archives genealogical data for production in Holstein-Friesian cows. These records are sufficient to allow calculation of enteric fermentation CH4 emissions using the Tier II methodology.
The objective of the present study was to calculate the enteric CH4 emissions for lactation and dry periods of dairy cows using data from 2007 in the state of Querétaro, Mexico. In this same year, the National Institute of Statistics, Geography and Data Processing (Instituto Nacional de Estadística, Geografía e Informática - INEGI) conducted the Agricultural, Livestock and Forestry Census. The Tier II methodology was applied using AHM data representing confined, intensive system dairy herds in the state of Querétaro, Mexico.
Material and methods
The lactation data used in the calculations included herd and cow identification; date of birth; calving date; lactation number; lactation end date; milk yield (kg) and weighing date; and milk fat and protein percentage. The AHM laboratory is certified by Quality Certification Services Inc. and runs fat and protein measurements using a mid infrared analyzer (Bentley 2000, Bentley Instruments Inc., USA). Each lactation record contained up to ten weighing dates at an average interval of 33 d. A total of 11,092 records were used in the analysis, including those with at least one lactation day in 2007, lactations longer than 100 d and shorter than 500 d. Limiting the analysis to lactations of less than 500 d results in a reasonable compromise between cows with lactations of 305 d and those with longer lactations, as only 5 % of cows lactate longer than 500 d14, but 55 % lactate for more than 305 d15.
Milk yield determines a significant proportion of a cow’s energy requirements; daily milk yield can vary during lactation and by lactation number. The incomplete gamma function adequately represents the lactation curve characterized by an ascending phase, a peak and a gradual decline16; indeed, it has an error variance equal to or less than other formulas (e.g. Gaines, Rook, Dijkstra or Pollott) used to represent lactation curves in herds in central Mexico17. Given the relative predictive capacity of complex lactation curve models, those like the incomplete gamma function are recommended, unless mechanistic details are needed for extended lactation curves (> 800 d)15. The formula used here was:
Y t = a · tb · e- ct
where Yt is milk yield on the tth day of lactation; e is the base of the natural logarithms; and a, b and c are the parameters defining the curves to fit. Yield immediately after calving is represented by a; the rate of change from initial production to maximum yield is b; and c is the rate of change from maximum yield to end of lactation. Persistence (s) is defined as the point at which peak milk yield is maintained; it is calculated as “(b+1) · ln(c)”. Milk yield per 305 d lactation (Y) was calculated as the sum of Yt to d 305. Maximum milk yield (Ymax) was determined with the formula a · (b/c) b · e-b , and mean duration of lactation (DL) was the average number of days in each lactation.
The lactation curve model was generated using the package Table Curve 2D (Systat Inc.). Significance was confirmed with the F test for goodness of fit error, normality and homogeneous variance of residuals. Only significant models that met the assumptions of normality and homoscedasticity were considered in the analysis. Residuals independence was confirmed with the autocorrelation function to the 10th order, and a t-test using the Minitab v. 16 pacakege (Minitab Inc.). Modeled variables were milk yield (Yt) and fat percentage (Gt). Cows within each herd were subsamples, while each herd was a replicate. This structure allowed us to infer about the herds, and confirm goodness of fit considering the herd as a characteristic management condition of each group of animals. Repetitions were n = 16, 17, 16, 16, 13, 14 for the first to the sixth lactation (L1 to L6). The sixth lactation included records for cows with six or more lactations. Parameter estimator means for the incomplete gamma function, DL, s, Y, Ymax and peak production were compared with a Tukey-Kramer test for imbalanced models18, with lactation number as the explanatory variable. The contrast between primiparous and multiparous cows was also tested. The confidence level in all analyses was 95% and analyses were run with the JMP v7 package (SAS Institute Inc.).
Methane (CH4) emissions were calculated for each herd and lactation number using the Tier II methodology11. Emissions from enteric fermentation were calculated in terms of gross energy (GE) content and the conversion rate of energy to methane (Ym). The only feed property considered was energy digestibility:
Emissions= EF · Population
Where Emissions is the release of CH4 from enteric fermentation (kg CH4 yr-1); EF is the emission factors corresponding to a specific population (kg CH4 cow-1 yr-1); and Population is the number of cows. The EF is calculated as:
EF= (GE · Ym · 365 d) / (55.65 MJ / kg CH4)
Where Ym is the CH4 conversion rate from GE with a value of 0.06 equivalent to 60 kJ MJ-1(11. However, Ym can vary in response to milk yield and feed properties. For example, Ym is 61 kJMJ-1 in high yielding cows (7,200 kg L cow-1 yr-1) in Germany19, and in high-yield cows in the United States Ym was 5.63 % of GE20. Absorption of GE in MJ cow-1 d-1 is derived from the sum of net energy needs and feed digestibility characteristics (DE= digestible energy, etc.):
GE= {[(Em + Ea + EL + Ep) / (Ema / DE)]} / (DE/100)
Net maintenance energy (Em) in MJ d-1 is: Em= Cfi · (weight)0.75
Where Cfi= 0.335, based on the coefficients for calculating Em11. For the purpose of calculating Em, the body weight corresponding to L1, L2 and L3 were calculated from a sample of 165 cows from eleven corrals. The resulting averages were 526 kg for L1, 590 kg for L2 and 640 kg for L3; the weight 680 kg was used for lactations 4, 5 and 6 since it represents large cows21.
Net energy for milk synthesis (EM), in MJ d-1, is:
Em = Yt · (1.47 + 0.40 · Gt)
Net energy for pregnancy (EM), in MJ d-1 is:
Ep= Cp · Em
where Cp= 0.10, which is the pregnancy coefficient.
The ratio between maintenance energy in a diet and digestible energy (DE) intake (Ema/ DE), in MJ d-1 is:
Ema / DE= 1.123 - (4.092 · 10-3 · DE) + [1.126 · 10-5 · (DE)2] - (25.4/DE)
Feed energy concentration was expressed as digestible energy (DE), calculated in Mcal kg-1 and converted to MJ kg-1(21:
DE= 0.1847371 · TDN (%)
Where TDN is total digestible nutrients. This is equal to 68 % of TDN in the diet of high-yield, large (average weight = 680 kg) cows, and includes a 3 % reduction in digestion efficiency in the TDN value when feeding at three times the maintenance level21. The 12.56 MJ kg-1 value used for DE is similar to the 18.45 MJ kg-1 default value for GE concentration22. Only one energy concentration value was used for all lactations, and changes in live weight during lactation were not considered. Daily CH4 emissions were calculated up to d 305 to generate an EF comparable to the 305 d adjusted yield (Y), and also until the total DL to obtain the EF during lactation. Emission intensity per unit produced (EI, CH4 kg-1 milk) was calculated per lactation by adding the CH4 produced in all the herds during all the lactation days and dividing the result by the number of lactating cows on said days. This figure was divided by average milk yield in the lactation period.
Results and discussion
Means of the lactation curve parameters were different between lactation numbers (Table 1). In terms of milk yield, differences were found between primiparous and multiparous cows in the a and b parameters of the incomplete gamma function (P<0.0001), s (P=0.05) and Ymax (P=0.017); no differences were present for c, DL or Y. Lactation persistence (s) was high due to a low rate of decrease in production after Ymax which generated relatively flat curves. In intensive system dairy herds, the a and b parameters differ between the first, second and third lactations17. These variations are probably better explained through analysis of seasonal variability, herd management conditions or genotype.
Table 1 Means of parameters a, b and c of the incomplete gamma function
| Milk | Fat | ||||||
|---|---|---|---|---|---|---|---|
| Lactation | a | b | c x 10 -4 | s | a | b | c x 10 -4 |
| 1 | 14.7a | 0.236a | 2.42a | 7.5a | 50.8a | 0.110a | 10.004a |
| 2 | 30.9b | 0.032b | 0.39a | 8.3a | 36.7ab | 0.021ab | 1.762b |
| 3 | 31.5b | 0.055b | 1.55a | 8.1a | 39.8ab | 0.040ab | 3.395ab |
| 4 | 24.8ab | 0.132ab | 2.67a | 7.6a | 34.6b | 0.002b | 1.361b |
| 5 | 30.5b | 0.116ab | 1.56a | 7.9a | 31.0b | 0.046b | 2.117b |
| 6+ | 27.6b | 0.089b | 2.05a | 7.7a | 39.8ab | 0.010b | 0.591b |
| SE | 2.9 | 0.039 | 2.43 | 3.0 | 3.9 | 0.024 | 19 |
ab Different letters in the same column indicate difference (P<0.05).
SE= Standard error.
The number of modeled lactations was highest for L1 and then decreased thereafter (Table 2); this is probably an artifact of the voluntary early culling typical of intensive production dairy herds15,23. The incomplete gamma function represented most (89.8 %) of the studied lactations, but all the L1 and L2 lactations had good fit (P<0.05). Lack of fit appeared when records were incomplete, or when the number of records increased as lactation number progressed in some herds. In contrast, the models were not significant when the curve was flat and the b and c values were near zero (Table 1). The capacity of the incomplete gamma function to represent L1 or L2 agreed with reports for dairy herds in central Mexico in which a good fit was attained using this formula for the first, second and third lactations17.
Table 2 Herd and mean production data: Y is yield at 305 d; Ymax is yield at lactation peak; and DL is duration of lactation
| Y | Ymax | DL | |||
| Lactation | Herds | Records | (kg milk) | (kg milk) | (d) |
| 1 | 16 | 4622 | 9437a | 34.0a | 366a |
| 2 | 17 | 2939 | 10468a | 35.1a | 362a |
| 3 | 16 | 1200 | 10359a | 34.8a | 362a |
| 4 | 16 | 696 | 9881a | 35.0a | 368a |
| 5 | 13 | 314 | 11047a | 38.6a | 364a |
| 6+ | 14 | 194 | 10016a | 35.4a | 372a |
| SE | 725 | 2.0 | 21 |
ab Different letters in the same column indicate difference (P<0.0025).
SE= Standard error.
The long average DL (365 d) indicates the presence of extended lactations in the analyzed database (Table 2). Use of extended lactations is a management strategy that capitalizing on high lactation persistence and the financially profitable yield towards the end of a lactation; however, it can also be a consequence of reproductive failure15. Extended and induced lactations are common in Mexican dairy herds, and are maintained by using bovine somatotropin23. This is important to consider when calculating the annual GHG emissions inventory for a state or country since methane emissions will be greater in the absence of a dry period in any given year.
Values for 305 d milk yield (Y) were similar between the analyzed lactations despite differences identified between the a and b estimates. Average Y was 9,985 kg in the database modeled with the incomplete gamma function. In terms of the variation coefficient, variation in Y in the database (28 %) was acceptable. However, as part of the uncertainty in the calculations, the standard error values must be included in the input parameters when calculating methane emissions inventories24. The 95% confidence interval for Y in the present data ranged from 8,550 to 11,419 kg, which differs from the 7,078 L (7,312 kg corrected to 3.5 % fat) reported for Y in intensive diary production systems in Mexico for operations located in the states of Aguascalientes, Hidalgo, Guanajuato, Jalisco, Michoacán, Puebla and Querétaro25.
Using the average DL figure of 365 d, the 95% confidence level was 11,061 to 12,793 kg. These yields are higher than the 6,700 kg milk yield described in the highest emission factors for dairy cattle using the Tier I methodology: in North America, high yield cows fed on grains and high quality forage have EF of 118 kg CH4 cow-1 yr-1(22.
Enteric fermentation EF values differed between primiparous and multiparous cows when the adjustment was made at 305 d (P=0.0025) to 365 d (P=0.0011), although emission intensity remained between 17.6 and 18.6 g CH4 kg milk (Table 3). For primiparous and multiparous cows, methane EF differed depending on the milk and fat production curve modeled for each herd and lactation number (Figure 1). Milk yield was the most valuable factor for describing methane emissions in the analyzed database, although its representation was simplified when expressed as emission intensity per production unit.
Table 3 Enteric methane emission factors (EF) and intensity (EI) per lactation based on duration adjustment from 365 or 305 days
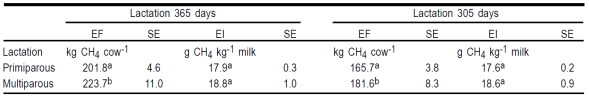
ab Different letters in the same column indicate difference (P<0.0025). SE= Standard error.
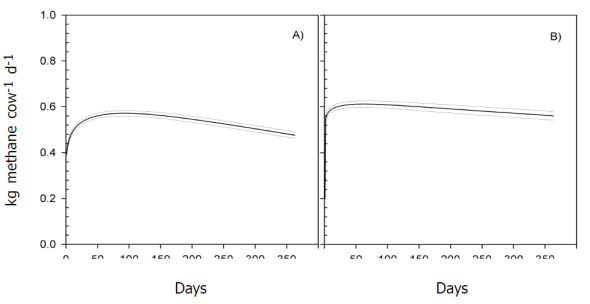
Figure 1 Emission of enteric methane in primiparous (A; n = 16) and multiparous cows (B; n = 76). Lines represent the mean and standard error
The present study contributed to characterize the intensive system milk production in Mexico and reducing uncertainty in application of the IPCC Tier II methodology. However, methane conversion factor (Ym), feed digestibility and feed composition values were taken from the literature, following IPCC best practices for inventory generation11,22. Future research will need to include the wide diversity of management practices and environmental conditions present in any given country. Validation of the enteric CH4 emissions estimates used here could only be by using scaled data for CH4 measurements in individual animals or by disaggregating atmospheric measurements to the farm level by applying gas measurement and turbulent flow systems. Indeed, the Tier II methodology contains greater estimation and systemic errors than do mechanistic models of enteric CH4 emission20,26. This methodology is intended for reporting regional and country inventories, and does not consider emissions associated with electric energy use, processing, fuels, etc. Grain import and transport of liquid milk are important aspects of the dairy market structure in Mexico. When applied in the future, the IPCC methodologies will need to be paired with direct measurements, comparisons with mechanistic models and calculation of lifecycle emissions for production systems.
The emission factors and intensities reported in the literature need to be compared considering environmental conditions, productive systems, livestock management practices, the methane production estimation model used, available databases and study depth, among other factors. The present emission intensity results (17.6 to 18.6 g CH4 kg milk) were within previously reported ranges for high yield cows: 25 g CH4 L-1 milk (enteric fermentation and manure) for the dairy cow population in Mexico9; 15.4 to 17.6 g CH4 kg-1 milk (enteric fermentation) in response to changes in the proportions of grazing to corn silage in the Netherlands26; and 18.0 to 19.1 CH4 g kg-1 in experiments using different proportions of alfalfa and corn silage27.
The present EF per head results (201 to 223 kg CH4 cow-1 in 365 d) were higher than the average reported in some national inventories: 120.76 kg in the USA28; 113 kg in the Netherlands29; and 128.8 to 139 kg in Germany19. This discrepancy is probably due to the fact that the AHM database does not include all the cows in a herd, since it focuses on high-yield dairy cows and longer lactations (365 vs 305 d). Emission of GHG increases as animal yield rises, but emissions per kilogram of milk corrected for fat content decreases notably as production increases12. In addition, Tier II uses a fixed Ym, which can result in a 12.5 % overestimation in dairy cattle, negatively affecting its accuracy19,20. Country-level solutions are needed in enteric methane inventories to derive feed composition and properties as a function of animal performance and thus generate more accurate calculations19.
Enteric methane emission estimates for cattle using emission factors specific to Mexico have been done. In these studies, enteric emissions are represented as a function of energy intake in the feed and typical body mass of cattle classified by age and climatic region, but milk production levels are not considered10. One national inventory applied a modified Tier I methodology using a 305 d lactation, a 60 d dry period, a 4,400 kg average yield per lactation in a typical 400 kg cow; and a lactation curve model30. However, this lactation model was obtained from data fitted for yield from 100 Friesian cows in the third lactation from Reading, UK31,32. Another national inventory used milk yield from FAO reports (2,800 to 4,541 kg milk cow-1 yr-1), milk composition and feed rations taken from previous studies, and assumed that all dairy cows were confined9.
The historical contribution of methane emissions is significant, but simplifications need to be made in the model so that available databases can be used; for example, averaging the dairy and non-dairy cattle emission factors to then multiply it by the cattle population of each country8. Published studies expose the limitations in the availability and quality of cattle activity and population data, highlighting the need for further research in an effort to adequately quantify how much of GHG emissions originate in the livestock sector3,4,5 . Another challenge is difficulty in data analysis caused by inconsistency among the units used to report GHG emission figures, particularly when SI (Sistème international d’unités) units are not employed. For instance, in one study the units Gg (109 g) and Mt (an abbreviation interpreted as megaton - equivalent to 1012 g, or as metric ton equivalent to 106 g) are used interchangeably and produce the same methane emission result for dairy cattle in Mexico9. In another example, worldwide methane concentration from enteric fermentation from 1890 -1998 was calculated as 1,183,095 Gg CH48, but the same authors later published the figure of 8 million Gg Ceq33 for the same concept. These two figures are not comparable using acceptable values for conversion of methane into carbon dioxide equivalents2. Finally, before any attempt at scaling is made to calculate GHG inventories, comparisons will be needed between the emission factors or intensities of different animal classes and productive models.
Conclusions and implications
Analysis with the incomplete gamma formula and lactation curves showed high-yield dairy cows in Querétaro state to differ between primiparous and multiparous individuals for the studied variables. Average lactation was one-year (365 d) long. Enteric methane emission during lactation differed between primiparous and multiparous cows, whether at 365 d or adjusted to 305 d. However, lactation number or duration had no effect on average enteric methane emission intensity per kilogram of milk produced. The uncertainty present in enteric methane emissions inventories can be reduced by incorporating data for milk yield, lactation duration, and herd composition in terms of primiparous and multiparous cows. Milk yield can be represented using the incomplete gamma formula. However, an acceptable simplification would be to multiply average daily milk yield by the number of lactation days. This was shown to be viable in the present study in which relatively flat, highly precise curves were identified for high-yield cows. If enteric methane emission on a dairy farm is assumed to be 75 % of its GHG emissions, and the emission factors are accounted for, then a dairy producer managing more than 2,500 cows would surpass the 25,000 Gg Ceq threshold established in the Rules of the General Climate Change Law for the National Register of Emissions for the Republic of Mexico (Reglamento de la Ley General de Cambio Climático en Materia del Registro Nacional de Emisiones para la República Mexicana - RENE), and the farm would be forced to report its emissions beginning in 2018. In response to applicable laws (e.g. NMX-SAA-14064/1-IMNC- 2007, NMX-SAA-14064/2-IMNC-2007, among others), the Mexican Certification Organization (Entidad Mexicana de Acreditación) maintains current lists of the organizations that implement GHG emissions verification and validation to meet RENE stipulations.
Acknowledgements
The research reported here was financed by the CONACYT-SEMARNAT 10873 fund, INE-Gobierno del Estado de Querétaro Anexo 34 2010, INECC Convenio INE/PS-051/20. Thanks to the Asociación Holstein de México for access to and use of their database.
REFERENCES
1. INECC. Instituto Nacional de Ecología y Cambio Climático. México quinta comunicación nacional ante la convención marco de las Naciones Unidas sobre el cambio climático. México, DF, México: Secretaría de Medio Ambiente y Recursos Naturales e Instituto Nacional de Ecología y Cambio Climático. 2012. [ Links ]
2. Shindell TD, Faluvegi G, Koch MD, Schmidt AG, Unger N, Bauer ES. Improved attribution of climate forcing to emissions. Science 2009;326(5953):716-718. [ Links ]
3. FAO. Food and Agriculture Organization of the United Nations. Livestock's long shadow. Rome, Italy: Food and Agriculture Organization of the United Nations; 2006. [ Links ]
4. Glatzle A. Questioning key conclusions of FAO publications 'Livestock's long shadow' (2006) appearing again in 'Tackling climate change through livestock' (2013). Pastor Res Policy Pract 2014;4(1):1-6. [ Links ]
5. Reddy PP. Climate resilient agriculture for ensuring food security. New Delhi, India: Springer; 2015. [ Links ]
6. INE. Instituto Nacional de Ecología. México cuarta comunicación nacional ante la convención marco de las Naciones Unidas sobre el cambio climático. México, DF, México: Secretaría de Medio Ambiente y Recursos Naturales e Instituto Nacional de Ecología. 2009. [ Links ]
7. Hagemann M, Hemme T, Ddambi A, Alqaisi O, Sultana MN. Benchmarking of greenhouse gas emissions of bovine milk production systems for 38 countries. Anim Feed Sci Technol 2011;(166-167):46- 58. [ Links ]
8. Muylaert de Araujo MS, Pires de Campos C, Pinguelli RL. Historical emissions, by country, of N2O from animal manure management and of CH4 from enteric fermentation in domestic livestock. Clim Res 2007;34(3):253-258. [ Links ]
9. Rendón-Huerta JA, Pinos-Rodríguez JM, García López JC, Yáñez-Estrada LG, Kebreab E. Trends in greenhouse gas emissions from dairy cattle in Mexico between 1970 and 2010. Anim Prod Sci 2013;54(3):292- 298. [ Links ]
10. Ruiz-Suárez LG, González-Avalos E. Modeling methane emissions from cattle in Mexico. Sci Total Environ 1997;206(2-3):177-186. [ Links ]
11. IPCC. Intergovernmental Panel on Climate Change. 2006 IPCC Guidelines for national greenhouse gas inventories. Hayama, Japan: Institute for Global Environmental Strategies. 2006. [ Links ]
12. Gerber P, Vellinga T, Opio C, Steinfeld H. Productivity gains and greenhouse gas emissions intensity in dairy systems. Livestock Sci 2011;139(1-2):100-108. [ Links ]
13. Knapp JR, Laur GL, Vadas PA, Weiss WP, Tricarico JM. Enteric methane in dairy cattle production: Quantifying the opportunities and impact of reducing emissions. J Dairy Sci 2014;97(6):3231- 3261. [ Links ]
14. Cole JB, Null DJ, VanRaden PM. Best prediction of yields for long lactations. J Dairy Sci 2009;92(4):1796-1810. [ Links ]
15. Dematawea CMB, Pearson RE, VanRaden PM. Modeling extended lactations of Holsteins. J Dairy Sci 2007;90(8):3924-3936. [ Links ]
16. Wood PDP. Algebraic model of the lactation curve in cattle. Nature 1967;216(5111):164-165. [ Links ]
17. Val-Arreola D, Kebreab E, Dijkstra J, France J. Study of the lactation curve in dairy cattle on farms in central Mexico. J Dairy Sci 2004;87(11):3789-3799. [ Links ]
18. Rafter AJ, Abell LM, Braselton PJ. Multiple comparison methods for means. SIAM Rev 2002;44(2):259-278. [ Links ]
19. Dämmgen U, Rösemann C, Haenel HD, Hutchings NJ. Enteric methane emissions from German dairy cows. Landbauforschung - vTI Agric For Res 2012;62(1-2):21-32. [ Links ]
20. Kebreab E, Johnson KA, Archibeque SL, Pape D, Wirth T. Model for estimating enteric methane emissions from United States dairy and feedlot cattle. J Anim Sci 2008;86(10):2738-2748. [ Links ]
21. NRC. National Research Council. Nutrient Requirements of Dairy Cattle. 7th ed. Washington, DC, USA: National Academy of Sciences; 2001. [ Links ]
22. IPCC. Intergovernmental Panel on Climate Change. Good practice guidance and uncertainty management in national greenhouse gas inventories. Chapter 4: Agriculture. Hayama, Japan: Institute for Global Environmental Strategies. 2000. [ Links ]
23. Mellado M, Antonio- Chirino E, Meza-Herrera C, Veliz FG, Arévalo JR, Mellado J, de Santiago A. Effect of lactation number, year, and season of initiation of lactation on milk yield of cows hormonally induced into lactation and treated with recombinant bovine somatotropin. J Dairy Sci 2011;94(9):4524-4530. [ Links ]
24. Gentner DR, Ford TB, Guha A, Boulanger K, Brioude J, Angevine WM, et al. Emissions of organic carbon and methane from petroleum and dairy operations in California's San Joaquin Valley. Atmos Chem Phys 2014;14(10):4955-4978. [ Links ]
25. Mariscal VA, Estrella HQ, Ruiz AF, Sagarnaga MV, Salas JMG, González MA, Juárez AZ. La cadena productiva de bovinos lecheros y el TLCAN. En: Avila DJA, et al.editores. Presente y futuro de los sectores ganadero, forestal y de la pesca mexicanos en el contexto del TLCAN. México DF, México: El Colegio de México, Centro de Estudios Económicos Universidad Autónoma Chapingo. 2008. [ Links ]
26. Bannink A, van Schijndel MW, Dijkstra J. A model of enteric fermentation in dairy cows to estimate methane emission for the Dutch National Inventory Report using the IPCC Tier 3 approach. Anim Feed Sci Technol 2011;(166-167):603-618. [ Links ]
27. Arndt C, Powell JM, Aguerre MJ, Wattiaux MA. Performance, digestion, nitrogen balance, and emission of manure ammonia, enteric methane, and carbon dioxide in lactating cows fed diets with varying alfalfa silage- to-corn silage ratios. J Dairy Sci 2015;98(1):418-430. [ Links ]
28. EPA. United States Environmental Protection Agency. Inventory of U.S. greenhouse gas emissions and sinks: 1990-2012. Common reporting format (CRF) tables. USA-2014-2012-v1.1.xls. Table 4. A Sectorial background data for agriculture: enteric fermentation. Washington DC, USA: United States Environmental Protection Agency. 2014. [ Links ]
29. Smink W, Pellikaan WF, van der Kolk LJ, van der Hoek KW. Methane production as a result from rumen fermentation in cattle calculated by using the IPCC-GPG Tier 2 method. Feed Innovation Services Report FS 04 12 E, Utrecht, The Netherlands: National Institute for Public Health and the Environment. 2004. [ Links ]
30. Castelán -Ortega OA. Modeling methane emissions and methane inventories for cattle production systems in Mexico. Atmósfera 2014;27(2):185-191. [ Links ]
31. Morant SV, Gnanasakthy A. A new approach to the mathematical formulation of lactation curves. Anim Prod 1989;49(2):151-162. [ Links ]
32. Ducker MJ, Haggett RA, Fisher WJ, Morant SV, Bloomeld GA. Nutrition and reproductive performance of dairy cattle 1. The effect of level of feeding in late pregnancy and around the time of insemination on the reproductive performance of first lactation dairy heifers. Anim Prod 1985;41(1):1 -12. [ Links ]
33. Muylaert de Araujo MS, Pires de Campos C, Pinguelli LR. GHG historical contribution by sectors, sustainable development and equity. Ren Sust Energy Rev 2007;11(5):988-997. [ Links ]
Received: May 06, 2005; Accepted: September 04, 2015
 Este es un artículo publicado en acceso abierto bajo una licencia Creative Commons
